- Page 2: Commodity Investing Maximizing Retu
- Page 5 and 6: Founded in 1807, John Wiley & Sons
- Page 7 and 8: Copyright C○ 2008 by Adam Dunsby,
- Page 9 and 10: vi CONTENTS PART THREE Understandin
- Page 12: Acknowledgments We thank Kumar Dand
- Page 16 and 17: CHAPTER 1 Introduction In 1980 Juli
- Page 18 and 19: Introduction 5 to the theme of inve
- Page 20 and 21: Introduction 7 Are we sliding down
- Page 22 and 23: CHAPTER 2 Commodity Futures as Inve
- Page 24 and 25: Commodity Futures as Investments 11
- Page 26 and 27: Commodity Futures as Investments 13
- Page 28 and 29: Commodity Futures as Investments 15
- Page 30 and 31: Commodity Futures as Investments 17
- Page 32 and 33: Commodity Futures as Investments 19
- Page 34 and 35: Commodity Futures as Investments 21
- Page 36 and 37: Commodity Futures as Investments 23
- Page 38 and 39: Commodity Futures as Investments 25
- Page 40 and 41: Commodity Futures as Investments 27
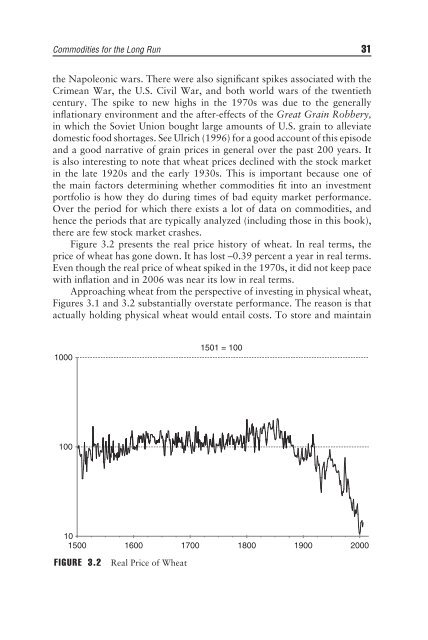
- Page 42 and 43: CHAPTER 3 Commodities for the Long
- Page 46 and 47: Commodities for the Long Run 33 com
- Page 48: Commodities for the Long Run 35 of
- Page 52 and 53: CHAPTER 4 Crude Oil Crude oil, also
- Page 54 and 55: Crude Oil 41 called in-situ process
- Page 56 and 57: Crude Oil 43 HUBBERT’S PEAK Durin
- Page 58 and 59: Crude Oil 45 TABLE 4.1 Oil Producti
- Page 60 and 61: Crude Oil 47 consumption levels, cu
- Page 62 and 63: Crude Oil 49 characteristics of cru
- Page 64 and 65: Crude Oil 51 accessible to the spot
- Page 66 and 67: Crude Oil 53 oil crisis was fresh i
- Page 68: Crude Oil 55 hay, and switchgrass,
- Page 71 and 72: 58 UNDERSTANDING ENERGY PRODUCTION
- Page 73 and 74: 60 UNDERSTANDING ENERGY vehicles, f
- Page 75 and 76: 62 UNDERSTANDING ENERGY $100 $90 $
- Page 77 and 78: 64 UNDERSTANDING ENERGY $10.00 Natu
- Page 80 and 81: CHAPTER 6 Gasoline Gasoline is one
- Page 82 and 83: Gasoline 69 oxygenated gasoline, wi
- Page 84 and 85: Gasoline 71 a total of 230 million
- Page 86 and 87: Gasoline 73 other nations for these
- Page 88 and 89: Gasoline 75 The RBOB is made so tha
- Page 90 and 91: Gasoline 77 The Weekly Petroleum St
- Page 92 and 93: CHAPTER 7 Natural Gas When people t
- Page 94 and 95:
Natural Gas 81 price received for n
- Page 96 and 97:
Natural Gas 83 natural gas liquids
- Page 98 and 99:
Natural Gas 85 it is onshore or off
- Page 100 and 101:
Natural Gas 87 CONSUMPTION Natural
- Page 102 and 103:
Natural Gas 89 $6 $4 Heating Oil Ch
- Page 104 and 105:
Natural Gas 91 $18 $16 Hurricanes K
- Page 106:
PART Three Understanding Grains and
- Page 109 and 110:
96 UNDERSTANDING GRAINS AND OILSEED
- Page 111 and 112:
98 UNDERSTANDING GRAINS AND OILSEED
- Page 113 and 114:
100 UNDERSTANDING GRAINS AND OILSEE
- Page 115 and 116:
102 UNDERSTANDING GRAINS AND OILSEE
- Page 117 and 118:
104 UNDERSTANDING GRAINS AND OILSEE
- Page 119 and 120:
106 UNDERSTANDING GRAINS AND OILSEE
- Page 121 and 122:
108 UNDERSTANDING GRAINS AND OILSEE
- Page 123 and 124:
110 UNDERSTANDING GRAINS AND OILSEE
- Page 125 and 126:
112 UNDERSTANDING GRAINS AND OILSEE
- Page 127 and 128:
114 UNDERSTANDING GRAINS AND OILSEE
- Page 130 and 131:
CHAPTER 10 Soybeans Soybeans date b
- Page 132 and 133:
Soybeans 119 the past 20 years. It
- Page 134 and 135:
Soybeans 121 20% 18% GPM as % of So
- Page 136 and 137:
Soybeans 123 More recently, soymeal
- Page 138 and 139:
Soybeans 125 gallons) of biodiesel
- Page 140 and 141:
Soybeans 127 $350 $300 $ per Short
- Page 142:
Soybeans 129 ADDITIONAL SOURCES OF
- Page 146 and 147:
CHAPTER 11 Hogs Hogs, along with go
- Page 148 and 149:
Hogs 135 We next turn to an interes
- Page 150 and 151:
Hogs 137 more than 50 plants closin
- Page 152 and 153:
Hogs 139 two commodities may be exp
- Page 154 and 155:
CHAPTER 12 Cattle Perhaps the cow o
- Page 156 and 157:
Cattle 143 Choice or Select, with t
- Page 158 and 159:
Cattle 145 Thousands of Metric Tons
- Page 160 and 161:
Cattle 147 100 90 80 Beef + Veal Po
- Page 162 and 163:
Cattle 149 demand for beef. Further
- Page 164:
PART Five Understanding Industrial
- Page 167 and 168:
154 UNDERSTANDING INDUSTRIAL METALS
- Page 169 and 170:
156 UNDERSTANDING INDUSTRIAL METALS
- Page 171 and 172:
158 UNDERSTANDING INDUSTRIAL METALS
- Page 173 and 174:
160 UNDERSTANDING INDUSTRIAL METALS
- Page 175 and 176:
162 UNDERSTANDING INDUSTRIAL METALS
- Page 178 and 179:
CHAPTER 14 Aluminum Aluminum is the
- Page 180 and 181:
Aluminum 167 35 33 31 Millions of m
- Page 182 and 183:
Aluminum 169 CONSUMPTION Primary an
- Page 184 and 185:
Aluminum 171 metallurgically unwork
- Page 186 and 187:
Aluminum 173 3.5 3 Copper Aluminum
- Page 188:
Aluminum 175 1:00 PM. The second se
- Page 191 and 192:
178 UNDERSTANDING INDUSTRIAL METALS
- Page 193 and 194:
180 UNDERSTANDING INDUSTRIAL METALS
- Page 195 and 196:
182 UNDERSTANDING INDUSTRIAL METALS
- Page 197 and 198:
184 UNDERSTANDING INDUSTRIAL METALS
- Page 200:
PART Six Understanding the Softs
- Page 203 and 204:
190 UNDERSTANDING THE SOFTS eating
- Page 205 and 206:
192 UNDERSTANDING THE SOFTS Other 2
- Page 207 and 208:
194 UNDERSTANDING THE SOFTS 70,000
- Page 209 and 210:
196 UNDERSTANDING THE SOFTS ADDITIO
- Page 211 and 212:
198 UNDERSTANDING THE SOFTS sugarca
- Page 213 and 214:
200 UNDERSTANDING THE SOFTS 30% 25%
- Page 215 and 216:
202 UNDERSTANDING THE SOFTS market
- Page 217 and 218:
204 UNDERSTANDING THE SOFTS curb de
- Page 220 and 221:
CHAPTER 18 Cocoa Cocoa is the funda
- Page 222 and 223:
Cocoa 209 4,000 3,500 Gross Crop Gr
- Page 224:
Cocoa 211 6,000 5,000 Disease damag
- Page 227 and 228:
214 UNDERSTANDING THE SOFTS PRODUCT
- Page 229 and 230:
216 UNDERSTANDING THE SOFTS 50,000
- Page 231 and 232:
218 UNDERSTANDING THE SOFTS tick (.
- Page 233 and 234:
220 UNDERSTANDING THE SOFTS ADDITIO
- Page 236 and 237:
CHAPTER 20 Some Building Blocks of
- Page 238 and 239:
Some Building Blocks of a Commodity
- Page 240 and 241:
Some Building Blocks of a Commodity
- Page 242 and 243:
Some Building Blocks of a Commodity
- Page 244 and 245:
Some Building Blocks of a Commodity
- Page 246 and 247:
Some Building Blocks of a Commodity
- Page 248 and 249:
Some Building Blocks of a Commodity
- Page 250 and 251:
Some Building Blocks of a Commodity
- Page 252 and 253:
Some Building Blocks of a Commodity
- Page 254 and 255:
Some Building Blocks of a Commodity
- Page 256 and 257:
Some Building Blocks of a Commodity
- Page 258 and 259:
CHAPTER 21 The Rise of the Indexes
- Page 260 and 261:
The Rise of the Indexes 247 markets
- Page 262 and 263:
Correlation of Monthly Returns CRB
- Page 264 and 265:
The Rise of the Indexes 251 100% Me
- Page 266 and 267:
The Rise of the Indexes 253 Table 2
- Page 268 and 269:
TABLE 21.3 Decomposing S&P GSCI Ret
- Page 270 and 271:
The Rise of the Indexes 257 ending
- Page 272 and 273:
The Rise of the Indexes 259 EQUITY
- Page 274 and 275:
Aluminum Alcoa, Inc. AA US 0.39 0.5
- Page 276 and 277:
The Rise of the Indexes 263 TABLE 2
- Page 278 and 279:
CHAPTER 22 Conclusion Without doubt
- Page 280:
Conclusion 267 Building Blocks of a
- Page 283 and 284:
270 HOW TO INVEST or contango relat
- Page 285 and 286:
272 HOW TO INVEST 45 minutes. Kerbs
- Page 287 and 288:
274 NOTES 14. Energy Information Ad
- Page 289 and 290:
276 NOTES 11. BP. BP Annual Statist
- Page 291 and 292:
278 NOTES 14. European Biodiesel Bo
- Page 293 and 294:
280 NOTES CHAPTER 14 1. Internation
- Page 296 and 297:
References Andersen, T.G., T. Bolle
- Page 298:
References 285 Plain, Ronald. “St
- Page 302 and 303:
Index Alternative Energy, 54-55. Se