FT-NIR Analysis of the Hock Process for the ... - Nicolet CZ sro
FT-NIR Analysis of the Hock Process for the ... - Nicolet CZ sro
FT-NIR Analysis of the Hock Process for the ... - Nicolet CZ sro

You also want an ePaper? Increase the reach of your titles
YUMPU automatically turns print PDFs into web optimized ePapers that Google loves.
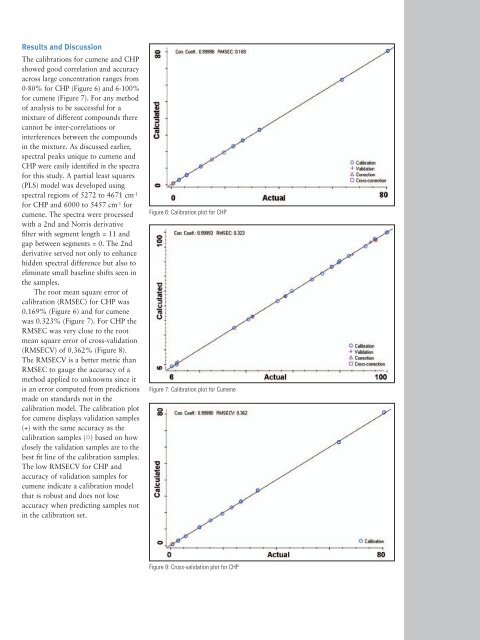
Results and Discussion<br />
The calibrations <strong>for</strong> cumene and CHP<br />
showed good correlation and accuracy<br />
across large concentration ranges from<br />
0-80% <strong>for</strong> CHP (Figure 6) and 6-100%<br />
<strong>for</strong> cumene (Figure 7). For any method<br />
<strong>of</strong> analysis to be successful <strong>for</strong> a<br />
mixture <strong>of</strong> different compounds <strong>the</strong>re<br />
cannot be inter-correlations or<br />
interferences between <strong>the</strong> compounds<br />
in <strong>the</strong> mixture. As discussed earlier,<br />
spectral peaks unique to cumene and<br />
CHP were easily identified in <strong>the</strong> spectra<br />
<strong>for</strong> this study. A partial least squares<br />
(PLS) model was developed using<br />
spectral regions <strong>of</strong> 5272 to 4671 cm -1<br />
<strong>for</strong> CHP and 6000 to 5457 cm -1 <strong>for</strong><br />
cumene. The spectra were processed<br />
with a 2nd and Norris derivative<br />
filter with segment length = 11 and<br />
gap between segments = 0. The 2nd<br />
derivative served not only to enhance<br />
hidden spectral difference but also to<br />
eliminate small baseline shifts seen in<br />
<strong>the</strong> samples.<br />
The root mean square error <strong>of</strong><br />
calibration (RMSEC) <strong>for</strong> CHP was<br />
0.169% (Figure 6) and <strong>for</strong> cumene<br />
was 0.323% (Figure 7). For CHP <strong>the</strong><br />
RMSEC was very close to <strong>the</strong> root<br />
mean square error <strong>of</strong> cross-validation<br />
(RMSECV) <strong>of</strong> 0.362% (Figure 8).<br />
The RMSECV is a better metric than<br />
RMSEC to gauge <strong>the</strong> accuracy <strong>of</strong> a<br />
method applied to unknowns since it<br />
is an error computed from predictions<br />
made on standards not in <strong>the</strong><br />
calibration model. The calibration plot<br />
<strong>for</strong> cumene displays validation samples<br />
(+) with <strong>the</strong> same accuracy as <strong>the</strong><br />
calibration samples () based on how<br />
closely <strong>the</strong> validation samples are to <strong>the</strong><br />
best fit line <strong>of</strong> <strong>the</strong> calibration samples.<br />
The low RMSECV <strong>for</strong> CHP and<br />
accuracy <strong>of</strong> validation samples <strong>for</strong><br />
cumene indicate a calibration model<br />
that is robust and does not lose<br />
accuracy when predicting samples not<br />
in <strong>the</strong> calibration set.<br />
Figure 6: Calibration plot <strong>for</strong> CHP<br />
Figure 7: Calibration plot <strong>for</strong> Cumene<br />
Figure 8: Cross-validation plot <strong>for</strong> CHP