The Analysis of Beer Components Using FT-NIR ... - Nicolet CZ sro
The Analysis of Beer Components Using FT-NIR ... - Nicolet CZ sro
The Analysis of Beer Components Using FT-NIR ... - Nicolet CZ sro

Create successful ePaper yourself
Turn your PDF publications into a flip-book with our unique Google optimized e-Paper software.
Application<br />
Note: 51892<br />
Key Words<br />
Antaris<br />
<strong>Beer</strong><br />
<strong>FT</strong>-<strong>NIR</strong><br />
Transflectance<br />
<strong>The</strong> <strong>Analysis</strong> <strong>of</strong> <strong>Beer</strong> <strong>Components</strong> <strong>Using</strong><br />
<strong>FT</strong>-<strong>NIR</strong> Spectroscopy<br />
Kelly Mayumi Narimoto, Álvaro Modesto de Oliveira, Charis Technologies, Vinhedo, SP, Brazil<br />
Introduction<br />
<strong>Beer</strong> is a beverage produced from cereals fermentation,<br />
usually malted barley, and is believed to be the first<br />
alcoholic beverage developed by man. A beer is any variety<br />
<strong>of</strong> alcoholic beverages produced by fermentation <strong>of</strong> starch<br />
related to, or derived from, grain or other plant sources.<br />
Because the ingredients that are used to make beer differ<br />
according to region, the characteristics (e.g. type, flavor<br />
and color) vary widely. Pure beer is typically made from<br />
water, malted barley, hops and yeast unless clearly labeled<br />
otherwise, such as wheat beer. <strong>The</strong> addition <strong>of</strong> other<br />
condiments or other sources <strong>of</strong> sugar may also occur.<br />
Because beer is composed mainly <strong>of</strong> water, the origin <strong>of</strong><br />
the water and its characteristics has an important effect on<br />
the quality <strong>of</strong> the beer, influencing, for example, the taste.<br />
Many beer styles are influenced and determined by the<br />
characteristics <strong>of</strong> water in the region where it is produced.<br />
Yeast is used in the fermentation process to metabolize<br />
the sugars extracted from cereals, producing many<br />
compounds, including alcohol and carbon dioxide.<br />
<strong>Beer</strong>s tend to have between 4% to 5% alcohol content,<br />
although this can vary considerably depending on the style<br />
and beer. In fact, there are beers with alcohol contents<br />
from 2% to over 20%.<br />
<strong>Beer</strong> represents a significant analytical challenge because<br />
it is a very complex sample containing a wide range <strong>of</strong><br />
components including vitamins, amino acids, proteins and<br />
bitter acids, all imparting particular organoleptic properties<br />
to the drink. <strong>The</strong> presence and quality <strong>of</strong> certain compounds<br />
are monitored to ensure a consistent product.<br />
Conventionally, a separate instrument is required for the<br />
analysis <strong>of</strong> each component in beer. For example, specific<br />
gravity measurements require a hydrometer. Alcohol content<br />
and specific gravity are usually determined by reference<br />
methods like distillation and pycnometry or by analytical<br />
instruments which combine oscillation-type densimetry<br />
and refractometry. In addition to organoleptical and<br />
microbiological examination for a standard beer analysis,<br />
color and bitterness are assessed by photometry; organic<br />
acids are determined using enzymatic analyses or liquid<br />
chromatography, and higher alcohols using gas<br />
chromatography. As a result <strong>of</strong> the sample preparation<br />
required for these methods, beer analysis is both<br />
time-consuming and expensive.<br />
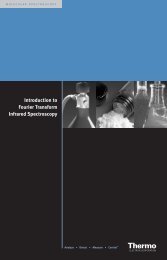
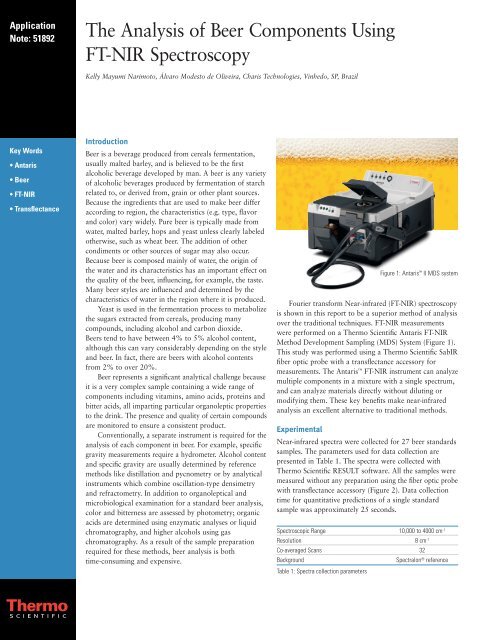
Figure 1: Antaris II MDS system<br />
Fourier transform Near-infrared (<strong>FT</strong>-<strong>NIR</strong>) spectroscopy<br />
is shown in this report to be a superior method <strong>of</strong> analysis<br />
over the traditional techniques. <strong>FT</strong>-<strong>NIR</strong> measurements<br />
were performed on a <strong>The</strong>rmo Scientific Antaris <strong>FT</strong>-<strong>NIR</strong><br />
Method Development Sampling (MDS) System (Figure 1).<br />
This study was performed using a <strong>The</strong>rmo Scientific SabIR<br />
fiber optic probe with a transflectance accessory for<br />
measurements. <strong>The</strong> Antaris <strong>FT</strong>-<strong>NIR</strong> instrument can analyze<br />
multiple components in a mixture with a single spectrum,<br />
and can analyze materials directly without diluting or<br />
modifying them. <strong>The</strong>se key benefits make near-infrared<br />
analysis an excellent alternative to traditional methods.<br />
Experimental<br />
Near-infrared spectra were collected for 27 beer standards<br />
samples. <strong>The</strong> parameters used for data collection are<br />
presented in Table 1. <strong>The</strong> spectra were collected with<br />
<strong>The</strong>rmo Scientific RESULT s<strong>of</strong>tware. All the samples were<br />
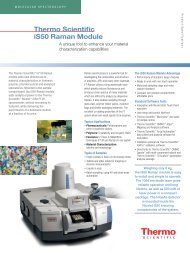
measured without any preparation using the fiber optic probe<br />
with transflectance accessory (Figure 2). Data collection<br />
time for quantitative predictions <strong>of</strong> a single standard<br />
sample was approximately 25 seconds.<br />
Spectroscopic Range 10,000 to 4000 cm-1 Resolution 8 cm-1 Co-averaged Scans 32<br />
Background Spectralon ® Table 1: Spectra collection parameters<br />
reference
Figure 2: Data collection from transflectance<br />
module<br />
<strong>The</strong> universal capacity <strong>of</strong> the <strong>FT</strong>-<strong>NIR</strong> technique is based<br />
on chemometrics, and allows for a correlation between<br />
the spectra and their chemical and physical properties.<br />
A calibration model was developed using the <strong>The</strong>rmo<br />
Scientific TQ Analyst s<strong>of</strong>tware package for quantitative<br />
analysis. In this application, the spectra were then analyzed<br />
quantitatively for alcohol content, color, refractive index<br />
and specific density. <strong>The</strong>se parameters were predicted using<br />
a single <strong>FT</strong>-<strong>NIR</strong> spectrum for each <strong>of</strong> the standards sample.<br />
All spectra were mean-centered and the pathlength type<br />
used was multiplicative signal correction (MSC).<br />
Partial Least Squares (PLS) calibration models were<br />
developed for all quantitative analysis. Each component <strong>of</strong><br />
this quantitative method was analyzed, using different regions<br />
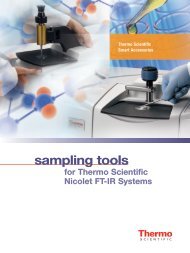
<strong>of</strong> the spectra. Figure 3 shows a representative spectrum,<br />
as well as, first and second derivatives spectra used for<br />
the analysis. Table 2 summarizes the parameters used<br />
for the analysis.<br />
<strong>Using</strong> PLS regression, the <strong>FT</strong>-<strong>NIR</strong> spectra was correlated<br />
with results from reference methods to establish a model<br />
for calculation <strong>of</strong> the beer samples.<br />
Spectral Region Spectral<br />
Component <strong>of</strong> <strong>Analysis</strong> Treatment Smoothing<br />
Alcohol 5500– 4000 cm-1 First Derivative None<br />
Color 9900– 4100 cm-1 None None<br />
Refractive Index 7000– 4000 cm-1 First Derivative Norris Derivative<br />
(segment 5, gap 2)<br />
Specific Density 7162– 4099 cm-1 Second Derivative Norris Derivative<br />
(segment 3, gap 2)<br />
Table 2: Summary <strong>of</strong> the parameters used for the analysis <strong>of</strong> beer<br />
standards samples<br />
Figure 3: Representative spectrum from beer standard samples, first and second derivative <strong>of</strong> the spectrum, respectively
Quantitative <strong>Analysis</strong> Results<br />
For quality control <strong>of</strong> beer, the quantitative determination <strong>of</strong><br />
alcohol and some physical parameters were determined.<br />
One <strong>of</strong> the quality attributes <strong>of</strong> beer that can be<br />
observed is the color. Currently, the classification <strong>of</strong> the<br />
color <strong>of</strong> beer is made during production, using a standard<br />
scale known as EBC (European Brewery Convention) where,<br />
for example, clear beer must contain less than 20 units.<br />
<strong>The</strong> PLS model, verified through cross-validation,<br />
showed an excellent correlation between the values<br />
generated from the conventional techniques and the <strong>FT</strong>-<strong>NIR</strong><br />
prediction. <strong>The</strong> regression lines show that there are no<br />
significant differences between the two procedures.<br />
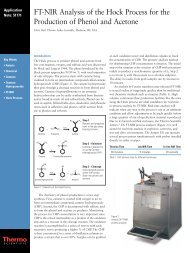
<strong>The</strong> samples were analyzed using a PLS method to<br />
quantify the alcohol content, color, refractive index and<br />
specific density. Figure 4 shows correlation plots between<br />
the actual value obtained with conventional techniques<br />
and the chemometric calculated values obtained with<br />
<strong>FT</strong>-<strong>NIR</strong>. We observed high correlation and low error for<br />
the four components. <strong>The</strong> method proved to be accurate<br />
and robust shown by low Root Mean Square Error <strong>of</strong><br />
Prediction (RMSEP) and the Root Mean Square Error <strong>of</strong><br />
Cross-Validation (RMSECV). A summary <strong>of</strong> the calibration<br />
results are presented in Table 3. <strong>The</strong> calibration data shows<br />
that it is possible to predict unknown samples accurately.<br />
Component Corr. Coeff. RMSEC RMSEP RMSECV<br />
Alcohol 0.99886 0.0430 0.0247 0.383<br />
Color 0.99983 0.0315 0.0793 0.187<br />
Refractive Index 0.99965 0.132 0.172 0.367<br />
Specific Density 0.99619 0.188 × 10⁻³ 0.306 × 10⁻³ 0.341 × 10⁻³ Table 3: Data showing calibration results<br />
Predicted Residual Error Sum <strong>of</strong> Squares (PRESS)<br />
plots were obtained through the cross-validation metric.<br />
This diagnostic indicates the validity <strong>of</strong> the chemometric<br />
model. PRESS plots follow the expected behavior <strong>of</strong> a<br />
robust and accurate prediction chemometric model, because<br />
it shows a decrease to a minimum and then stabilization.<br />
Figure 5 shows the PRESS plots for the components<br />
measured in the beer.<br />
Alcohol<br />
Color<br />
Refraction Index<br />
Specific Density<br />
Figure 4: PLS calibration results for beer
Conclusion<br />
This application demonstrates the feasibility and<br />
advantages <strong>of</strong> the <strong>FT</strong>-IR technique in beer analysis using<br />
a transflectance accessory, and also the superior speed<br />
in relation to conventional techniques. Since there is no<br />
sample preparation, it was possible to quantify multiple<br />
components simultaneously in approximately 25 seconds.<br />
<strong>The</strong> quantitative analysis was performed on the samples<br />
using a PLS model. <strong>The</strong> results <strong>of</strong> the PLS regression models<br />
confirmed that <strong>FT</strong>-<strong>NIR</strong> spectroscopy is a suitable technique<br />
for this purpose because the calibrations are <strong>of</strong> high quality,<br />
indicating the model is appropriate and robust. Furthermore,<br />
the Antaris <strong>FT</strong>-<strong>NIR</strong> spectrometer allows for high quality<br />
accurate measurements <strong>of</strong> multiple components in beer.<br />
Implementation <strong>of</strong> <strong>FT</strong>-<strong>NIR</strong> methods using the Antaris<br />
system can lead to improved efficiency, better process and<br />
quality control for the analysis <strong>of</strong> beer.<br />
Part <strong>of</strong> <strong>The</strong>rmo Fisher Scientific<br />
Alcohol<br />
Color<br />
Figure 5: PRESS plots <strong>of</strong> the components measured in beer samples<br />
Refraction Index<br />
Specific Density<br />
©2010 <strong>The</strong>rmo Fisher Scientific Inc. All rights reserved. Spectralon is a registered trademark <strong>of</strong> Labsphere, Inc. All other trademarks are the property <strong>of</strong> <strong>The</strong>rmo Fisher Scientific Inc. and its<br />
subsidiaries. Specifications, terms and pricing are subject to change. Not all products are available in all countries. Please consult your local sales representative for details.<br />
In addition to these<br />
<strong>of</strong>fices, <strong>The</strong>rmo Fisher<br />
Scientific maintains<br />
a network <strong>of</strong> represen -<br />
tative organizations<br />
throughout the world.<br />
Africa-Other<br />
+27 11 570 1840<br />
Australia<br />
+61 2 8844 9500<br />
Austria<br />
+43 1 333 50 34 0<br />
Belgium<br />
+32 53 73 42 41<br />
Canada<br />
+1 800 530 8447<br />
China<br />
+86 10 8419 3588<br />
Denmark<br />
+45 70 23 62 60<br />
Europe-Other<br />
+43 1 333 50 34 0<br />
Finland/Norway/<br />
Sweden<br />
+46 8 556 468 00<br />
France<br />
+33 1 60 92 48 00<br />
Germany<br />
+49 6103 408 1014<br />
India<br />
+91 22 6742 9434<br />
Italy<br />
+39 02 950 591<br />
Japan<br />
+81 45 453 9100<br />
Latin America<br />
+1 608 276 5659<br />
Middle East<br />
+43 1 333 50 34 0<br />
Netherlands<br />
+31 76 579 55 55<br />
South Africa<br />
+27 11 570 1840<br />
Spain<br />
+34 914 845 965<br />
Switzerland<br />
+41 61 716 77 00<br />
UK<br />
+44 1442 233555<br />
USA<br />
+1 800 532 4752<br />
www.thermo.com<br />
<strong>The</strong>rmo Electron Scientific<br />
Instruments LLC, Madison, WI<br />
USA is ISO Certified.<br />
AN51892_E 03/10M