Biogas for a better life - SNV Netherlands Development Organisation
Biogas for a better life - SNV Netherlands Development Organisation
Biogas for a better life - SNV Netherlands Development Organisation

Create successful ePaper yourself
Turn your PDF publications into a flip-book with our unique Google optimized e-Paper software.
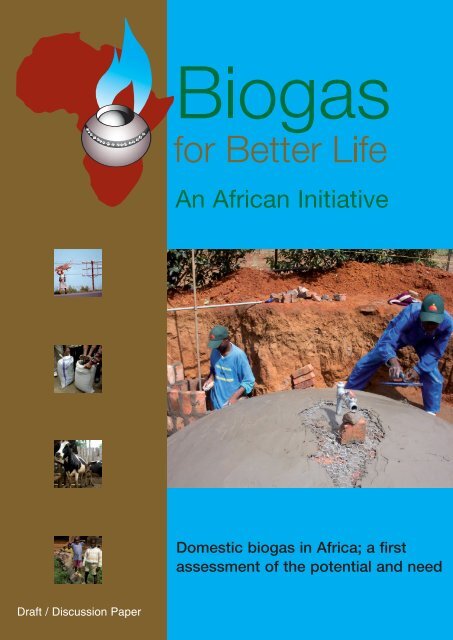
<strong>Biogas</strong> <strong>for</strong> a <strong>better</strong> <strong>life</strong><br />
Draft / Discussion Paper<br />
An African Initiative<br />
C6 M94 Y100 K35<br />
C100 M0 Y0 K0<br />
C100 M25 Y100 K25 C60 M63 Y54 K0<br />
C20 M40 Y80 K45<br />
Domestic biogas in Africa; a first<br />
assessment of the potential and need
Felix ter Heegde 1 , Kai Sonder 2<br />
1 <strong>Biogas</strong> Practice Team, <strong>SNV</strong>-the <strong>Netherlands</strong> <strong>Development</strong> Organization, Dr. Kuijperstr 5, 2514BA Den Haag, the <strong>Netherlands</strong>.<br />
2 International Institute of Tropical Agriculture, PMB 5320, Ibadan, Oyo State, Nigeria.<br />
May 2007
Domestic biogas in Africa; a first assessment of the potential and need.<br />
Abstract.<br />
To estimate the technical potential of domestic<br />
biogas in Africa, two main indicators have been used,<br />
the number of households with access to water and the<br />
number of domestic cattle per household. Land-use and<br />
cattle-type in<strong>for</strong>mation has been used to correct <strong>for</strong><br />
pastoral farming practices. With this methodology, the<br />
technical potential <strong>for</strong> domestic biogas <strong>for</strong> Africa turns<br />
out to be 18.5 million installations. At country level, this<br />
calculation matches the lower estimates <strong>for</strong> Ethiopia and<br />
Rwanda but overstates the estimates <strong>for</strong> Senegal, <strong>for</strong><br />
which more detailed recent feasibility studies are<br />
available.<br />
This technical potential value on its own provides an<br />
incomplete picture on the feasibility of large(r) scale<br />
biogas dissemination initiatives. To improve the<br />
accuracy, and thus the reliability, four supporting “aspect<br />
areas” –development, energy, health & sanitation and<br />
environment- have been assessed from a biogas<br />
perspective. For each of these aspect areas, a “<strong>Biogas</strong><br />
Feasibility Index” is suggested, providing an indication of<br />
the situation of the aspect area relative to domestic<br />
biogas.<br />
Introduction.<br />
Global understanding on sustainable energy supply<br />
as a critical factor <strong>for</strong> development is steadily increasing.<br />
For farming households in developing countries<br />
domestic biogas could contribute in a modest but<br />
significant manner, providing multiple benefits, beyond<br />
energy, in the areas of health, nutrition and<br />
environmental sustainability.<br />
Fig 1:<br />
Fixed dome domestic biogas installation<br />
Production of biogas through anaerobic digestion is<br />
a relative simple technology that can be implemented at<br />
industrial, village and household scale (fig 1). At<br />
domestic level, the controlled management of animal<br />
dung and other organic waste allows <strong>for</strong> the safe<br />
production of gas <strong>for</strong> cooking and lighting and improves<br />
the sanitary situation of the farm yard. In addition the<br />
fermented bio-slurry provides an extremely valuable<br />
organic fertilizer. Replacing traditional biomass fuels and<br />
inefficient stoves, biogas virtually eliminates indoor air<br />
pollution and reduces the workload –mostly <strong>for</strong> women<br />
and children- related to food preparation significantly.<br />
In Asia, the potential of domestic biogas is well<br />
exploited. By the end of 2004, over 15 million<br />
households in China were using biogas, the government<br />
aiming to increase this number to 27 million by 2010.<br />
India registered 3.67 million domestic biogas<br />
installations at that time 1 . National programmes <strong>for</strong><br />
domestic biogas have also been established in Nepal i , 2<br />
and Vietnam ii and, more recently in Cambodia and<br />
Bangladesh.<br />
Africa has not seen such propagation of domestic<br />
biogas. Despite several biogas dissemination initiatives<br />
the number of constructed installations <strong>for</strong> the continent<br />
as a whole is rather in the order of thousands 3,4 and a<br />
large share of them has fallen into disrepair or disuse<br />
[World Energy Council and FAO, 1999].<br />
At the same time, however, many households in<br />
Africa are facing problems with energy supply.<br />
Traditional biomass covers 70-90% of the primary<br />
energy supply and up to 95% of the total energy<br />
consumed [World Energy Council, 2005]. The availability<br />
of traditional cooking fuels such as wood, agricultural<br />
residue, dried dung and charcoal is declining, while<br />
commercial fuels often are too expensive and their<br />
availability unreliable. Collection of traditional fuels is<br />
time intensive, preventing -in particular women and<br />
children- from engaging in education or productive<br />
activities. Burning biomass fuels exposes family<br />
members to indoor air pollution, causing respiratory<br />
diseases and eye ailments [Rehfuess, 2006] iii . Often the<br />
same households face the consequences of lacking<br />
hygiene and sanitation, resulting in waterborne diseases.<br />
Studies from the WHO 5 and Winrock indicate that the<br />
benefits from latrines and improved hygiene far outweigh<br />
the costs. At many places, the collection of traditional<br />
fuels and the production of charcoal exhausts natural<br />
resources and damages the very environment on which<br />
people heavily rely.<br />
There is, in short, an urgent need in Africa <strong>for</strong><br />
alternative more sustainable energy sources and<br />
improved sanitation.<br />
i The <strong>Biogas</strong> Sector Partnership / Nepal, established in 1992,<br />
supported construction by the end of 2006 165,000 installations<br />
ii The Vietnam <strong>Biogas</strong> Programme, established in 2003, supported<br />
construction by the end of 2006 over 26,000 installations<br />
iii It is estimated that several hundred thousands of women and children<br />
die annually as a result of traditional fuel burning
Technical potential 6 .<br />
For this paper, “technical potential” is defined as the<br />
number of households that can meet the two basic<br />
requirements –sufficient availability of dung and waterto<br />
run a biogas installation.<br />
Although biogas can be generated by a score of<br />
organic material, cattle dung i is arguably best suited as a<br />
substrate <strong>for</strong> small installations; the digestion process is<br />
robust and the material is abundantly available on many<br />
farmyards. For a biogas plant to be attractive to a family,<br />
it should be able to provide at least 0.8 to 1 m 3 biogas<br />
daily ii . To generate this amount of biogas, the household<br />
should have 20 to 30 kg of fresh dung available at a<br />
daily basis. Theoretically, two healthy mature cattle<br />
would be able to produce this amount of dung, but as <strong>for</strong><br />
large parts of Africa zero-grazing is not common and<br />
cattle are generally small and undernourished, most<br />
African households would rather need at least 3 or 4<br />
night-stabled heads of cattle iii .<br />
To enable both the installation’s micro-biological<br />
process as well as the hydraulic functioning, the feeding<br />
material, dung, has to be mixed with equal amounts of<br />
water. This process water does not have to be of<br />
“drinking water” quality, but –in view of the significant<br />
amount needed on a daily basis, should be available in<br />
the vicinity iv of the installation.<br />
For the process to run in a relatively simple,<br />
domestic installation, the ambient temperatures should<br />
remain over 15 O C. At continental level the temperature<br />
will not be a limiting factor (map 1a) v .<br />
Agricultural households with access to water.<br />
Freshwater withdrawal <strong>for</strong> domestic and agricultural<br />
use in Africa rank amongst the lowest in the world (fig 2).<br />
Also, Africa features the lowest share of cultivated land<br />
being irrigated (5.9% in 2003) 7 . Although these numbers<br />
do not indicate actual domestic or agricultural water<br />
consumption, and even less the geographical and<br />
seasonal distribution of water availability, clearly<br />
(domestic) water comes at a premium in Africa.<br />
In absence of detailed data on water proximity and<br />
availability to households, “access to safe water<br />
sources” is used as a proxy. Out of a total population of<br />
just over 837 million, Africa has an agricultural<br />
i Pig manure and poultry litter make a good anaerobic substrate as<br />
well, but densities of these animals in most countries of rural Africa<br />
may not justify a larger dissemination programme.<br />
ii Such amount of biogas would provide about 2 to 3 “stove hours”;<br />
sufficient to prepare at least one family meal.<br />
iii To properly assess the availability of dung, the actual collected<br />
amount over a longer period (1 week) should be measured.<br />
iv <strong>Biogas</strong> programmes in Nepal and Vietnam use the criterion that a<br />
suitable water source shall be within 20 minutes walking.<br />
v Main maps are inserted in the document. Supporting maps, indicated<br />
with a suffix, are combined in the annex.<br />
Domestic biogas in Africa; a first assessment of the potential and need.<br />
population of 455 million persons. Assuming an average<br />
family size of 6 persons, this equals about 76 million<br />
agricultural households.<br />
m3 / cap / year<br />
700<br />
600<br />
500<br />
400<br />
300<br />
200<br />
100<br />
0<br />
World<br />
Africa<br />
Freshwater withdrawal (2003)<br />
Asia<br />
Latin America<br />
Caribbean<br />
North America<br />
Oceania<br />
Of the total urban population, 85% has access to<br />
safe water, a claim that can only be made by 50% of the<br />
rural population. Assuming that 80% of the agricultural<br />
households are living in rural areas, 43 million<br />
agricultural households can be expected to have<br />
access to safe water (map 1b).<br />
Domestic cattle population.<br />
The total cattle population of Africa amounts to 277<br />
million heads [FAO 2006]. Lacking official data on the<br />
share of the total cattle population that is –at least- night<br />
stabled, it is assumed that domestic cattle vi is equal to all<br />
dairy cattle (46 million heads) plus a share of the nondairy<br />
cattle (draft animals, local grazing).<br />
For an approximation of the share of non-dairy cattle<br />
that is night-stabled, the land-use factor (box 1) based<br />
on the ratio arable / pastoral land area is proposed. With<br />
this land-use factor, 122 million heads of non-dairy cattle<br />
(53% of the total non-dairy cattle herd of Africa) are<br />
expected “domestic”. Based on these assumptions,<br />
Africa is estimated to have some 168 million heads of<br />
domestic cattle (map 1c).<br />
Box 1:<br />
Domestic cattle:<br />
milk cattle + (land-use factor x non-milk cattle)<br />
Land Use Factor:<br />
arable land / (arable land + 20% pastoral land)<br />
domestic<br />
agriculture<br />
Europe<br />
Fig 2<br />
vi Domestic cattle is in this paper defined as cattle that is al least kept<br />
stabled at the farmyard during the night
Technical potential <strong>for</strong> domestic biogas.<br />
As argued earlier, <strong>for</strong> a domestic biogas plant to<br />
work satisfactorily, a household would need at least 3<br />
heads of domestic cattle and good access to water. On<br />
average an African agricultural household with access to<br />
water has 4.15 heads of cattle (map 1d).<br />
Box 2:<br />
Technical potential:<br />
Agric hh with water x cattle holding factor<br />
Cattle holding factor:<br />
0.75 if cattle holding /ah > 3<br />
0.50 if cattle holding / ah >2 and < 3<br />
0.25 if cattle holding / ah >1 and < 2<br />
0.00 if cattle holding / ah
The <strong>Biogas</strong> Feasibility Index.<br />
Technical potential of domestic biogas is not the sole<br />
indicator <strong>for</strong> successful large scale introduction of the<br />
technology. As biogas has an impact on aspects of<br />
energy, environment, agricultural production, socioeconomic<br />
development and health & sanitation, (proxy-)<br />
indicators of these aspect areas should be assessed as<br />
well.<br />
Box 4:<br />
<strong>Biogas</strong> Feasibility Index (BFI):<br />
([x-value] – [min value]) / ([max value – min value])<br />
To be able to compare indicators of such different<br />
areas, the “<strong>Biogas</strong> Feasibility Index” is proposed (box 4).<br />
This index assesses values within an aspect area<br />
relative to each other, not unlike the calculation method<br />
of the human development index.<br />
<strong>Development</strong> 11 .<br />
The indicators<br />
selected to arrive at the<br />
development BFI are:<br />
Human <strong>Development</strong><br />
Index [HDR i value];<br />
Gross Domestic Product<br />
(ppp) per Capita<br />
[US$ppp/cap]; Gender<br />
<strong>Development</strong> Index<br />
[HDR value]; and;<br />
Female / male Income<br />
Earning Ratio [HDR<br />
value].<br />
The Human<br />
<strong>Development</strong> Index<br />
(HDI) (map 2a) indicates<br />
the general level of<br />
development of a<br />
population, based on a<br />
range of economic and<br />
social indicators. For<br />
biogas the HDI is<br />
relevant in two ways:<br />
Countries with a very<br />
high HDI value (North-<br />
African countries, South<br />
Africa, Namibia and<br />
Gabon) and a significant<br />
biogas potential can be<br />
expected to embark up<br />
on domestic biogas on their own strength, and<br />
dissemination may pick-up quickly. Countries with a very<br />
low HDI value (e.g. the Sahel countries and Ethiopia),<br />
despite a high biogas potential, may be slow in<br />
i HDR: Human <strong>Development</strong> Report<br />
Map 2<br />
<strong>Development</strong> BFI<br />
Domestic biogas in Africa; a first assessment of the potential and need.<br />
accepting the new technology both <strong>for</strong> social as well as<br />
economic reasons.<br />
Although the Gross Domestic Product per Capita<br />
(GDPppp/cap) (map 2b) is also included in the HDI<br />
indicator, the GDPppp/cap indicator on its own more<br />
precisely indicates the financial capacity of the<br />
population to bear the investment costs of a domestic<br />
biogas installation. In addition, higher GDP rates may<br />
point towards <strong>better</strong> financial infrastructure, possibly<br />
including rural (micro) credit.<br />
The Gender <strong>Development</strong> Index (GDI) (map 2c)<br />
measures the extent to which women play an equal role<br />
in society. As women often are the main biogas plant<br />
operators and reap an important share of the benefits of<br />
an installation, the GDI provides an impression on the<br />
role women can be expected to play in the investment<br />
decision, plant operation and promotion of the<br />
technology.<br />
The Female/Male<br />
Income Earning Ratio<br />
(FMIE) (map 2d)<br />
approaches gender<br />
equality from a more<br />
economic perspective.<br />
The <strong>Development</strong> BFI<br />
(map 2), calculated with<br />
these four indicators, point<br />
at South Africa, Zimbabwe,<br />
Uganda, Tanzania, Gabon<br />
and Equatorial Guinea,<br />
combining a high technical<br />
potential <strong>for</strong> domestic<br />
biogas with a high<br />
“<strong>Development</strong> BFI”.
Energy 12 .<br />
The two indicators used to arrive at the Energy BFI<br />
are Traditional energy use as share of total energy use<br />
[%] and Forest area as share of total land area [%].<br />
The lion share of Africa’s domestic energy<br />
consumption is (in-) directly sourced from biomass:<br />
fuelwood, agricultural residue and dung (map 3a).<br />
Typically, the common biomass combustion devices are<br />
characterised by a very low efficiency 13 and high<br />
emission rates of toxic / harmful exhaust gasses 14 .<br />
Whereas traditional energy used to be a commodity in<br />
the in-<strong>for</strong>mal domain of the economy, increasing<br />
demand (population growth and consumption per capita)<br />
have commercialized the trade in fuelwood, agricultural<br />
residue and dung cake. This development causes<br />
severe “energy poverty”, to the extent that cooked meals<br />
are becoming a luxury <strong>for</strong> many rural African<br />
households. <strong>Biogas</strong> (partly) substitutes traditional fuel,<br />
offering at least a partial solution <strong>for</strong> the domestic energy<br />
crisis and easing the environmental pressure resulting<br />
from fuelwood and dung burning.<br />
Although biogas offers multiple benefits, <strong>for</strong> many<br />
households the initial prime attraction of biogas is the<br />
substitution of fuelwood. In areas with high <strong>for</strong>est<br />
coverage, fuelwood is often easily available and free of<br />
(financial) costs. On the other hand, low <strong>for</strong>est coverage<br />
–particularly in<br />
combination with a high Map 3<br />
share of traditional Energy BFI<br />
energy use- is an<br />
indicator <strong>for</strong><br />
commercialization of<br />
fuelwood, dung and<br />
even agricultural waste.<br />
<strong>Biogas</strong> programmes,<br />
hence, can be expected<br />
to be more successful in<br />
countries with low <strong>for</strong>est<br />
coverage (map 3b).<br />
The main use of<br />
electricity <strong>for</strong> households<br />
is <strong>for</strong> lighting and<br />
running small electric<br />
equipment. Especially<br />
domestic illumination is<br />
a highly valued<br />
commodity <strong>for</strong> rural<br />
households. Although<br />
biogas lighting, using<br />
mantle lamps similar to<br />
kerosene pressure<br />
lamps, cannot compete<br />
with the com<strong>for</strong>t of<br />
electric lighting, they<br />
may offer the best option<br />
Domestic biogas in Africa; a first assessment of the potential and need.<br />
in areas that are not connected to the grid. This would<br />
suggest an inversed relation between the electricity<br />
consumption and the attractiveness of biogas, an<br />
assumption that is supported by programme experiences<br />
in remoter areas. At the same time, however,<br />
experiences in the Nepal and Vietnam programmes<br />
indicate a positive correlation between biogas<br />
penetration and electric grid connection; electricity is<br />
rarely used as cooking energy and grid connection might<br />
here be an indicator <strong>for</strong> improved accessibility /<br />
development opportunities of rural areas, supporting -<br />
amongst a score of other things- biogas dissemination.<br />
Electricity consumption thus seems to indicate two<br />
different issues, one addressing need (<strong>for</strong> illumination)<br />
and one related to accessibility aspects of in<strong>for</strong>mation<br />
and promotion. Although a map is provided (map 3c), <strong>for</strong><br />
its ambiguous nature the indicator is not included in the<br />
Energy BFI calculation.<br />
The energy BFI, combining traditional energy and<br />
<strong>for</strong>est coverage indicators, provides an insight in the<br />
location of areas that share a high demand with low<br />
supply of traditional energy (map 3). Roughly the entire<br />
central band of African countries is facing a serious<br />
domestic energy crisis. In view of the technical potential<br />
of domestic biogas in most of these countries, the<br />
technology could assist in (partly) alleviating this<br />
problem.
Health & sanitation.<br />
Indicators used to arrive at the Health & sanitation<br />
BFI are: Population undernourished [%]; Access to<br />
improved sanitation [%]; Access to improved water<br />
source [%]; Mortality children
Environment 16 .<br />
Indicators used <strong>for</strong> the Environment BFI are: Soil<br />
degradation and erosion; De<strong>for</strong>estation; Desertification;<br />
Overgrazing; Water shortage, and; Water pollution<br />
(organic).<br />
Soil degradation and<br />
erosion is an indicator <strong>for</strong><br />
the level of sustainability<br />
of agricultural practices.<br />
The CIA fact book<br />
mentions degradation<br />
and erosion as an<br />
environmental issue <strong>for</strong><br />
most of the African<br />
countries (map 5a). Their<br />
assessment is supported<br />
in a more quantitative<br />
way by Henon 17 (map<br />
5b). Many agricultural<br />
systems in Africa deplete<br />
nutrients and further<br />
degrade soils. Domestic<br />
biogas prevents valuable<br />
manure and its nutrients<br />
from being wasted<br />
through evaporation,<br />
leakage and burning.<br />
Proper application of bioslurry<br />
will improve<br />
nutrient cycling at a local<br />
level, improving the<br />
quality of agricultural<br />
soils.<br />
Map 5<br />
Environment BFI<br />
Forest resources in<br />
Africa are dwindling;<br />
some countries report an<br />
annual decline of <strong>for</strong>ested<br />
area at a rate of 4% p.a.<br />
between 1990 and 2000. Main causes of de<strong>for</strong>estation<br />
(map 5c) include increasing population pressure; poor<br />
<strong>for</strong>est management practices; conflict; extension of<br />
agricultural land, and; the increasing need <strong>for</strong> (domestic)<br />
energy. <strong>Biogas</strong> contributes to combating de<strong>for</strong>estation;<br />
directly, as biogas substitutes fuelwood, and; indirectly<br />
as bio-slurry improves soil-fertility and thus reduces the<br />
requirement <strong>for</strong> new agricultural land.<br />
Desertification (map 5d), possibly even more than<br />
de<strong>for</strong>estation, is an indicator <strong>for</strong> unsustainable land use<br />
(livestock) and a high demand <strong>for</strong> domestic fuel, often<br />
triggered by periodically declining rainfall patterns 18 (map<br />
5e). <strong>Biogas</strong> will, at best, only marginally contribute to<br />
reducing desertification, and the implied water shortage<br />
in these areas will hamper implementation of large scale<br />
programmes<br />
Linked with the above is overgrazing (map 5f); in<br />
large parts of Africa the traditional way of livestock<br />
Domestic biogas in Africa; a first assessment of the potential and need.<br />
keeping with large free-roaming herds <strong>for</strong> centuries was<br />
a symbol of well-being. In combination with the<br />
increasing population pressure, however, pasture land is<br />
reducing and increasingly overgrazed. Although<br />
livestock <strong>for</strong> many rural families is the cornerstone <strong>for</strong><br />
survival, many countries<br />
(e.g. Ethiopia, Kenya<br />
Rwanda) are<br />
contemplating on farreaching<br />
measures (from<br />
promoting “cut and carry”<br />
practices to penalties on<br />
free roaming cattle) to<br />
drive back this practice.<br />
The availability of<br />
water (map 5g) <strong>for</strong><br />
domestic or agricultural<br />
use cannot be taken <strong>for</strong><br />
granted <strong>for</strong> the majority of<br />
Africa’s rural population.<br />
For domestic biogas to<br />
function properly however,<br />
process water (not<br />
necessarily of drinking<br />
water quality) is required<br />
in roughly equal quantity<br />
as the amount of manure<br />
fed to the installation. For<br />
practical purposes, in view<br />
of the significant amounts<br />
of water needed, water<br />
should be within a<br />
distance of –say- 20 to 30<br />
minutes from the<br />
installation.<br />
Water sources –<br />
particularly in (peri)urban<br />
areas- are often polluted<br />
with organic matter (map 5h) as a result of poor sewage<br />
and sanitation practices. Domestic biogas, especially<br />
where toilets are connected to installations, controls the<br />
pollution of water sources and reduces the biological<br />
oxygen demand <strong>for</strong> the subsequent final decomposition.<br />
From an environmental perspective it would be more<br />
correct to speak of necessity rather than feasibility. The<br />
cause of Africa’s high environmental pressure (map 5) is<br />
complex and multi-facetted. Domestic biogas can only<br />
play a modest supporting role in <strong>better</strong>ing this situation,<br />
and than only in combination with other measures.
Conclusions.<br />
This assessment is based entirely on macro-level<br />
data whereby some of the in<strong>for</strong>mation had to be<br />
“manipulated” to arrive at –<strong>for</strong> biogas- meaningful<br />
indicators. Hence, this assessment cannot be a<br />
substitute <strong>for</strong> detailed research at country level.<br />
Nevertheless, the results of this assessment are in the<br />
same order of magnitude as some of these recent<br />
feasibility studies.<br />
The technical potential <strong>for</strong> domestic biogas in Africa<br />
appears to be significant; 1 in 4 agricultural households<br />
on the continent would qualify, translating in a total<br />
potential of some 18.5 million installations. With the<br />
current –UN Millennium <strong>Development</strong> Goals and UN<br />
Millennium Ecosystem Assessment induced- activities<br />
aiming to improve livestock holding practices, water<br />
accessibility and the environment in general, the<br />
technical potential <strong>for</strong> domestic biogas is likely to<br />
increase over the coming decade. In addition, the<br />
growing scarcity of traditional and fossil energy sources<br />
as well as the high costs of modern energy sources<br />
(electricity, LNG) in most rural areas will likely improve<br />
the economy of investment in a biogas installation over<br />
time.<br />
The need <strong>for</strong> biogas, in terms of its potential<br />
contribution to development, energy, health & sanitation<br />
and environment, seems even larger than its potential<br />
demand; Africa’s status on these aspects is alarming. In<br />
this respect the BFIs provide an indication of “low<br />
hanging fruit” <strong>for</strong> starting large-scale biogas<br />
programmes, but are by no means a guarantee <strong>for</strong><br />
success.<br />
Domestic biogas in Africa; a first assessment of the potential and need.
Annex 1<br />
Main data <strong>for</strong> technical potential calculation<br />
agricultural<br />
households<br />
agric hh with<br />
access to water non-milk cattle<br />
landuse factor<br />
arable vs<br />
pastoral land<br />
[arable / arable<br />
+ 20% pastoral<br />
land]<br />
calculated nonmilk<br />
domestic<br />
cattle milk cattle<br />
total domestic<br />
cattle<br />
cattle holding<br />
per agricultural<br />
household<br />
75% of agric hh<br />
<strong>for</strong> avg holding<br />
>3<br />
50% of agric hh<br />
<strong>for</strong> avg holding<br />
>2 but 1 but 3 bio_ah>2 bio_ah>1 bio_ahtot bio_ahprogtot<br />
ALGERIA 1234 1111 1560 0.55 853 1003 1856 1.67 0 0 278 278 278<br />
ANGOLA 1660 644 4150 0.22 902 404 1306 2.03 0 322 322 322<br />
BENIN 577 339 1745 0.96 1673 210 1882 5.55 254 254 254<br />
BOTSWANA 131 121 1700 0.07 115 290 405 3.34 91 91 91<br />
BURKINA FASO 2058 1169 5200 0.78 4075 1040 5115 4.38 876 876 876<br />
BURUNDI 1057 736 325 0.83 271 55 326 0.44 0 0 0 0 0<br />
CAMEROON 1301 651 5950 0.94 5576 260 5836 8.97 488 488 488<br />
CAPE VERDE 16 13 23 0.89 20 9 29 2.13 0 7 7 0<br />
CENTRAL AFRICAN REPUBLIC 451 238 3423 0.76 2586 246 2832 11.89 179 179 179<br />
CHAD 1053 284 6400 0.29 1829 248 2077 7.30 213 213 213<br />
COMOROS, THE 95 91 50 0.96 48 9 57 0.63 0 0 0 0 0<br />
CONGO, THE 238 66 123 0.09 11 2 13 0.19 0 0 0 0 0<br />
DJIBOUTI 91 91 297 0.00 1 23 24 0.26 0 0 0 0 0<br />
EGYPT 4155 3922 3900 0.50 1950 2050 4000 1.02 0 0 980 980 980<br />
EQUATORIAL GUINEA 58 25 5 0.86 4 nd nd nd 19 19 0<br />
ERITREA 546 252 1930 0.26 510 200 710 2.81 0 126 126 126<br />
ETHIOPIA 4735 1222 35500 0.71 25311 7500 32811 26.86 916 916 916<br />
GABON 74 43 35 0.26 9 6 15 0.35 0 0 0 0 0<br />
GAMBIA, THE 189 111 328 0.73 240 44 284 2.56 0 55 55 55<br />
GHANA 1967 1113 1365 0.71 975 273 1248 1.12 0 0 278 278 278<br />
GUINEA 1183 511 3400 0.30 1007 442 1449 2.84 0 255 255 255<br />
GUINEA-BISSAU 210 104 520 0.58 302 84 386 3.70 78 78 78<br />
IVORY COAST, THE 1262 883 1111 0.54 604 197 801 0.91 0 0 0 0 0<br />
KENYA 3979 1679 11500 0.52 5971 5500 11471 6.83 1259 1259 1259<br />
LESOTHO 115 104 540 0.45 244 95 339 3.27 78 78 78<br />
LIBERIA 381 nd 36 0.49 18 6 23 nd nd nd nd 0 0<br />
LIBYA 44 30 130 0.45 58 108 166 5.49 23 23 0<br />
MADAGASCAR 2162 904 10500 0.38 3997 1900 5897 6.52 678 678 678<br />
MALAWI 1547 838 750 0.86 646 76 722 0.86 0 0 0 0 0<br />
MALI 1758 1118 7500 0.44 3279 750 4029 3.60 839 839 839<br />
MAURITANIA 258 100 1500 0.06 88 345 433 4.33 75 25 100 100<br />
MOROCCO 4833 3209 2689 0.67 1792 1380 3172 0.99 0 0 0 0 0<br />
MOZAMBIQUE 2423 1265 1320 0.32 426 355 781 0.62 0 0 0 0 0<br />
NAMIBIA 154 113 2500 0.10 242 260 502 4.45 85 28 113 113<br />
NIGER 1797 1057 2260 0.65 1472 460 1932 1.83 0 0 264 264 264<br />
NIGERIA 6305 2988 15200 0.79 12067 1800 13867 4.64 2241 2241 2241<br />
RWANDA 1274 561 815 0.92 752 251 1003 1.79 0 0 140 140 140<br />
SAO TOME AND PRINCIPE 17 nd 4 0.97 4 1 5 nd nd nd nd 0 0<br />
SENEGAL 1248 879 3100 0.69 2124 310 2434 2.77 0 439 439 439<br />
SIERRA LEONE 517 152 400 0.55 219 85 304 2.00 0 76 76 76<br />
SOMALIA 1192 nd 5350 0.11 580 1165 1745 nd nd nd nd 0 0<br />
SOUTH AFRICA 937 772 13600 0.47 6362 930 7292 9.45 579 579 579<br />
SUDAN 3285 2378 38325 0.41 15677 6800 22477 9.45 1784 1784 1784<br />
SWAZILAND 57 nd 580 0.43 247 130 377 nd nd nd nd 0 0<br />
TANZANIA 4788 2375 17800 0.36 6473 4828 11300 4.76 1781 1781 1781<br />
TOGO 479 227 279 0.93 258 41 299 1.32 0 0 57 57 57<br />
TUNISIA 383 259 760 0.74 563 575 1138 4.39 194 194 194<br />
UGANDA 3422 1752 6100 0.83 5081 2000 7081 4.04 1314 1314 1314<br />
WESTERN SAHARA 18 nd nd nd nd nd nd nd nd nd nd 0 0<br />
ZAIRE 5559 2146 765 0.69 528 6 534 0.25 0 0 0 0 0<br />
ZAMBIA 1219 683 2600 0.47 1215 214 1429 2.09 0 341 341 341<br />
ZIMBABWE 1298 1059 5760 0.48 2785 800 3585 3.39 794 794 794<br />
[biogas plant<br />
potential x<br />
1000]<br />
[biogas plant<br />
potential x<br />
1000]<br />
[biogas plant<br />
potential x<br />
1000]<br />
[biogas plant<br />
potential x<br />
1000]<br />
75785 40387 231702 122039 45764 167799 4.15 14838 1622 2051 18511 18463
Annex 2<br />
Supporting maps <strong>for</strong> “Technical Potential”<br />
Map 1c<br />
Domestic cattle population<br />
Map 1a<br />
Minimum temperature<br />
Map 1d<br />
Domestic cattle holding / agric hh<br />
Annexes<br />
Map 1b<br />
Agric hh with access to water<br />
Map 1e<br />
<strong>Biogas</strong> potential density
Annex 2<br />
Supporting maps <strong>for</strong> “<strong>Development</strong>” Map 2a<br />
Human <strong>Development</strong> Index<br />
Map 2c<br />
Gender <strong>Development</strong> Index<br />
Annexes<br />
Map 2b<br />
Gross Domestic Product ppp / Cap<br />
Map 2d<br />
Female/male Income Earning Ratio
Annex 3<br />
Supporting maps <strong>for</strong> “Energy”<br />
Map 3a<br />
Traditional energy use<br />
Map 3b<br />
Forest coverage<br />
Map 3c<br />
Electricity consumption<br />
Electricity consumption<br />
per capita<br />
[kWh/pers]<br />
Annexes
Annex 4<br />
Supporting maps <strong>for</strong> “health & sanitation”<br />
Map 4c<br />
Access to improved water source<br />
Map 4a<br />
Population undernourished<br />
Map 4d<br />
< 5 mortality diarrhoea<br />
Map 4b<br />
Access to improved sanitation<br />
Map 4e<br />
Annex 5<br />
Supporting maps <strong>for</strong> “environment”<br />
Map 5a<br />
Soil degradation / erosion<br />
Map 5e<br />
Precipitation<br />
Map 5b<br />
Nutrient balance<br />
Nutrient balance<br />
[kg/ha/yr]<br />
No data<br />
Map 5f<br />
Overgrazing<br />
Map 5c<br />
De<strong>for</strong>estation<br />
Map 5g<br />
Water shortage<br />
Map 5d<br />
Desertification<br />
Map 5h<br />
Water pollution (organic)<br />
Annexes
Refences<br />
1<br />
Wim J van Nes (2006): “Asia hits the gas” in Renewable<br />
Energy World.<br />
2<br />
Saroj Rai (2006): Paper “Necessary conditions <strong>for</strong> successful<br />
introduction of a large scale biogas programme: deriving from<br />
Nepal experience”.<br />
3<br />
Dr. Joseph Mumba (2006), <strong>Biogas</strong> initiatives undertaken in<br />
Africa so far: successes and failures.<br />
4<br />
GTZ presentation <strong>for</strong> B4A workshop, unpublished<br />
5<br />
Hutton, G. and Haller, L. (2004), Evaluation of the costs and<br />
benefits of water and sanitation improvements at the global<br />
level, World Health <strong>Organisation</strong> (WHO/SDE/WSH/04.04),<br />
Geneva, Switzerland, page 87<br />
(http://www.who.int/water_sanitation_health/wsh0404.pdf)<br />
6<br />
All data obtained from Faostat.<br />
7<br />
Data obtained from FAO Aquastat<br />
8<br />
Guy Dekelver, Ruzigana, S, Lam, J (2005): Report on the<br />
feasibility study <strong>for</strong> a biogas support programme in the republic<br />
of Rwanda.<br />
9<br />
Felix ter Heegde, Sonder, K, Eshete, G (2006): Report on the<br />
feasibility study of a national programme <strong>for</strong> domestic biogas in<br />
Ethiopia.<br />
10<br />
Felix ter Heegde, Diop, L, Ukkerman, R, (2006) Report on<br />
the feasibility study of a national programme <strong>for</strong> domestic<br />
biogas in Senegal.<br />
11<br />
Data from UNDP’s Human <strong>Development</strong> on-line database,<br />
most data origins from 2002.<br />
12<br />
Data from UNDP’s Human <strong>Development</strong> on-line database,<br />
most data origins from 2003.<br />
13<br />
See <strong>for</strong> data e.g. IPCC guidelines 2006.<br />
14<br />
Kirk R. Smith, 1987, Bio fuels, air pollution, and health<br />
15<br />
WHO(2000): Addressing the links between Indoor Air<br />
Pollution, Household energy and human health<br />
16<br />
Data from the CIA World Fact Book 2006. Indicators scored<br />
“0” or “1” when mentioned under “environmental issues”.<br />
17<br />
Henon (2002) in the UN Millenium Ecosystem Assessment<br />
Chapter 12, pg 335.<br />
18<br />
Jonathan A Foley et al (2003) in Ecosystems Regime shifts<br />
in Sahara and Sahel, interactions between ecological and<br />
climatic systems in Northern Africa.