
Create successful ePaper yourself
Turn your PDF publications into a flip-book with our unique Google optimized e-Paper software.
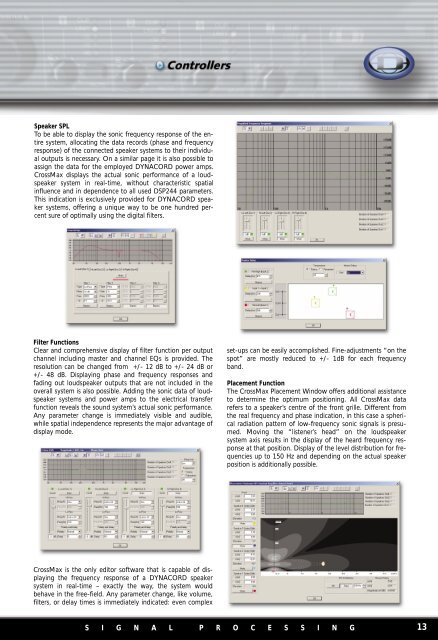
Speaker SPL<br />
To be able to display the sonic frequency response of the entire<br />
system, allocating the data records (phase and frequency<br />
response) of the connected speaker systems to their individual<br />
outputs is necessary. On a similar page it is also possible to<br />
assign the data for the employed DYNACORD power amps.<br />
CrossMax displays the actual sonic performance of a loudspeaker<br />
system in real-time, without characteristic spatial<br />
influence and in dependence to all used DSP244 parameters.<br />
This indication is exclusively provided for DYNACORD speaker<br />
systems, offering a unique way to be one hundred percent<br />
sure of optimally using the digital filters.<br />
Filter Functions<br />
Clear and comprehensive display of filter function per output<br />
channel including master and channel EQs is provided. The<br />
resolution can be changed from +/- 12 dB to +/- 24 dB or<br />
+/- 48 dB. Displaying phase and frequency responses and<br />
fading out loudspeaker outputs that are not included in the<br />
overall system is also possible. Adding the sonic data of loudspeaker<br />
systems and power amps to the electrical transfer<br />
function reveals the sound system’s actual sonic performance.<br />
Any parameter change is immediately visible and audible,<br />
while spatial independence represents the major advantage of<br />
display mode.<br />
set-ups can be easily accomplished. Fine-adjustments “on the<br />
spot” are mostly reduced to +/- 1dB for each frequency<br />
band.<br />
Placement Function<br />
The CrossMax Placement Window offers additional assistance<br />
to determine the optimum positioning. All CrossMax data<br />
refers to a speaker’s centre of the front grille. Different from<br />
the real frequency and phase indication, in this case a spherical<br />
radiation pattern of low-frequency sonic signals is presumed.<br />
Moving the “listener’s head” on the loudspeaker<br />
system axis results in the display of the heard frequency response<br />
at that position. Display of the level distribution for frequencies<br />
up to 150 Hz and depending on the actual speaker<br />
position is additionally possible.<br />
CrossMax is the only editor software that is capable of displaying<br />
the frequency response of a DYNACORD speaker<br />
system in real-time – exactly the way, the system would<br />
behave in the free-field. Any parameter change, like volume,<br />
filters, or delay times is immediately indicated: even complex<br />
S I G N A L P R O C E S S I N G 13