Abstract
Abstract
Abstract

Create successful ePaper yourself
Turn your PDF publications into a flip-book with our unique Google optimized e-Paper software.
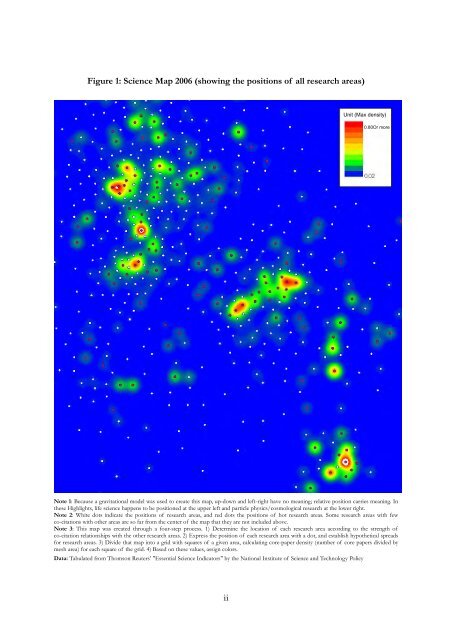
Figure 1: Science Map 2006 (showing the positions of all research areas)<br />
Unit (Max density)<br />
0.80Or more<br />
Note 1: Because a gravitational model was used to create this map, up-down and left-right have no meaning; relative position carries meaning. In<br />
these Highlights, life science happens to be positioned at the upper left and particle physics/cosmological research at the lower right.<br />
Note 2: White dots indicate the positions of research areas, and red dots the positions of hot research areas. Some research areas with few<br />
co-citations with other areas are so far from the center of the map that they are not included above.<br />
Note 3: This map was created through a four-step process. 1) Determine the location of each research area according to the strength of<br />
co-citation relationships with the other research areas. 2) Express the position of each research area with a dot, and establish hypothetical spreads<br />
for research areas. 3) Divide that map into a grid with squares of a given area, calculating core-paper density (number of core papers divided by<br />
mesh area) for each square of the grid. 4) Based on these values, assign colors.<br />
Data: Tabulated from Thomson Reuters’ "Essential Science Indicators" by the National Institute of Science and Technology Policy<br />
ii