Abstract
Abstract
Abstract

You also want an ePaper? Increase the reach of your titles
YUMPU automatically turns print PDFs into web optimized ePapers that Google loves.
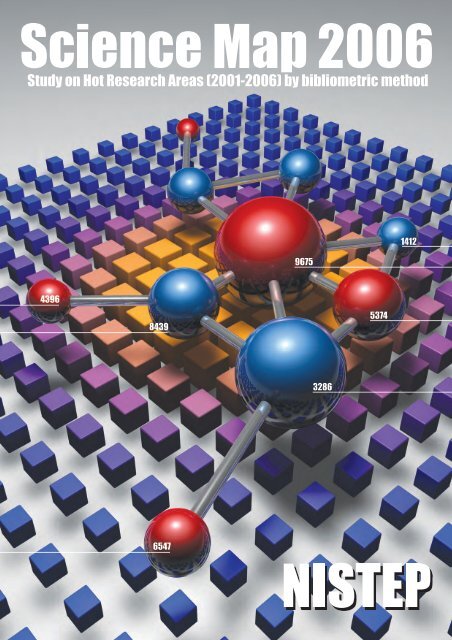
Science Map 2006<br />
- Study on Hot Research Areas (2001-2006) by bibliometric method -<br />
Ayaka SAKA, Masatsura IGAMI, Terutaka KUWAHARA<br />
June, 2008<br />
Research Unit for Science and Technology Analysis and Indicators,<br />
National Institute of Science and Technology Policy (NISTEP)<br />
Ministry of Education, Culture, Sports, Science and Technology (MEXT)<br />
Japan
Science Map 2006 Highlights<br />
1. What is the Science Map<br />
There is a long history of attempts to describe the structure and development of science and technology<br />
from a bibliometric perspective. The dramatic development of information processing technology and<br />
enhancement of databases of scientific papers and patents in recent years have brought innovation to research<br />
in this field. The mapping of knowledge is a growing area of research, and a variety of studies are being<br />
conducted, mainly in the USA and Europe. The targets of mapping are diverse. They include analysis of<br />
relationships between fields of science through examination of journal citations and analysis of co-authorships<br />
by country, organization, and researcher.<br />
The National Institute of Science and Technology Policy's Science Map project aims to periodically observe<br />
dynamic change in natural science. 1 The unit of the mapping is research areas.<br />
Analysis of scientific research using Science Map is carried out through 1) structuring of research areas<br />
through the clustering of research papers, 2) visualization of research areas by mapping, and 3) content analysis<br />
of hot research areas.<br />
Science Map 2006 used the top 1 percent highly-cited research papers (approximately 50,000) during each<br />
year in each of 22 fields (including Clinical medicine, Plant and Animal Science, Chemistry, Physics, etc.)<br />
among research papers published during the six years 2001 through 2006. These highly-cited research papers<br />
were clustered in two stages (research papers → research fronts → research areas) by using "co-citation." Six<br />
hundred eighty-seven research areas were obtained. Of these, detailed content analysis was performed on 124<br />
hot research areas above a certain size.<br />
These highlights summarize the results of the following analyses using the Science Map.<br />
◦ The snapshot of the current status of scientific research<br />
◦ Changes in scientific research, a comparison of Science Map 2004 and Science Map 2006<br />
◦ Observation of inter-/multi-disciplinary research on the Science Map<br />
◦ The breadth and intensity of research activities in Japan, the USA, and China<br />
How to read the Science Map<br />
In the main part of this report, three Science Maps (the Individual Research Area Map, the Academic<br />
Disciplines Relation Map, and the Research Area Correlation Map) are used to visualize and analyze scientific<br />
research. In this summary, only analysis using the Research Area Correlation Map is described, so the Research<br />
Area Correlation Map will be referred to as "the Science Map."<br />
Figure 1 and Figure 2 depict the Science Map. The unit of visualization is research areas. Research areas with<br />
a high degree of co-citation are located near one another.<br />
In the Science Map 2006, all 687 research areas obtained by clustering research papers were mapped. By<br />
showing the positions of 124 hot research areas for which content analysis was performed, the roles of the hot<br />
research areas within scientific research as a whole become evident. In Figure 1, the white dots represent the<br />
positions of research areas, and the red dots the positions of hot research areas. The Science Map can be<br />
regarded as a two-dimensional aerial map showing the accumulations of core papers and the formation of<br />
mountains of science on the land. The hot research areas are mountains that exceed a certain elevation.<br />
Because showing all 687 research areas on the Science Map makes it overly complex, hot research areas alone<br />
are shown in these Highlights. (See Figure 2.)<br />
1 This is the third report. The first report is NISTEP REPORT No. 95, Study on Rapidly-developing Research Area (May 2005); the second<br />
report is NISTEP REPORT No. 100, Science Map 2004 (March 2007).<br />
i
Figure 1: Science Map 2006 (showing the positions of all research areas)<br />
Unit (Max density)<br />
0.80Or more<br />
Note 1: Because a gravitational model was used to create this map, up-down and left-right have no meaning; relative position carries meaning. In<br />
these Highlights, life science happens to be positioned at the upper left and particle physics/cosmological research at the lower right.<br />
Note 2: White dots indicate the positions of research areas, and red dots the positions of hot research areas. Some research areas with few<br />
co-citations with other areas are so far from the center of the map that they are not included above.<br />
Note 3: This map was created through a four-step process. 1) Determine the location of each research area according to the strength of<br />
co-citation relationships with the other research areas. 2) Express the position of each research area with a dot, and establish hypothetical spreads<br />
for research areas. 3) Divide that map into a grid with squares of a given area, calculating core-paper density (number of core papers divided by<br />
mesh area) for each square of the grid. 4) Based on these values, assign colors.<br />
Data: Tabulated from Thomson Reuters’ "Essential Science Indicators" by the National Institute of Science and Technology Policy<br />
ii
Figure 2: Science Map 2006 (showing the positions only of hot research areas)<br />
Research on heart and blood vessels<br />
Unit (Max density)<br />
0.80Or more<br />
Research on infectious<br />
diseases<br />
Study of obesity<br />
Cancer research<br />
Brain research<br />
Post genome research<br />
Nanoscience<br />
Plant science research<br />
Chemical synthesis<br />
Environment<br />
Condensed matter physics<br />
Particle physics and cosmology<br />
Note 1: The yellow circles indicate the center locations of hot research areas. The numbers next to the yellow circles are the hot research areas' ID<br />
numbers. Gradations in the map correspond to the density of core papers. Warm colors represent greater concentrations of core papers, with<br />
colors becoming cooler as the density of core papers decreases. The standard for colors in the Science Map is "Observational cosmology and an<br />
elementary model for it (ID 69)," which has the highest density of core papers. Places with a maximum density of about 0.8 are red; higher<br />
densities are represented as white.<br />
Note 2: Some research areas with few co-citations with other areas are so far from the center of the map that they are not included above.<br />
Data: Tabulated from Thomson Reuters’ "Essential Science Indicators" by the National Institute of Science and Technology Policy<br />
iii
2. The snapshot of the current status of scientific research<br />
(1) Relationships among research areas<br />
Scientific research develops through mutual relationships. The Science Map shows that<br />
research areas can be divided into several groups, and that these groups of research areas are<br />
interrelated.<br />
The research areas at the lower right of the Science Map are related to particle physics/cosmology. The<br />
group of research areas related to condensed matter physics spreads out above them. There are two groups of<br />
research areas at the center of the Science Map. The group of research areas related to nanoscience is at the<br />
center-right, and the group of research areas related to chemical synthesis at the center left. To the left and<br />
below chemical synthesis is the group of research areas related to environmental research. Unlike the group of<br />
research areas related to chemical synthesis that concentrate close together, this group is spread out on the<br />
map.<br />
Groups of research areas related to life science are at the upper left of the Science Map. The lowest of these<br />
groups and the closest to the group of chemical synthesis is plant science research. Above it spreads<br />
post-genomics, with linkage to research on infectious diseases/immunology, cancer research, study of obesity,<br />
and brain research. Above them is the group of research areas related to research on heart and blood vessels.<br />
(2) What does core-paper density indicate<br />
Looking at the Science Map, both particle physics/cosmology and life science have high<br />
core-paper density. The characteristics of each group, however, are different. Particle<br />
physics/cosmology has a limited relationship to other groups of research areas, so its position is<br />
unlikely to change significantly, and its core papers are likely to remain concentrated. In life<br />
science, on the other hand, the evolution of science has brought about links among research<br />
areas that developed separately, creating new research areas. This makes it likely that the locations<br />
of core papers will shift on the map.<br />
The Science Map shown in Figure 2 can be regarded as depicting a two-dimensional aerial map with<br />
accumulations of core papers forming mountains of science on the land. On the Science Map, grids with red<br />
gradation are those with high core-paper density. Core-paper density is high in research areas and groups of<br />
research areas in which many highly-cited research papers are published and frequently co-cited. This is<br />
characteristic of all parts of the map with high densities.<br />
The processes, by which regions with high core-paper density form, however, are not uniform. Figure 3<br />
shows the orthographic projection of the Science Map 2006 on vertical and horizontal axes. Orthographic<br />
projection on the vertical axis is the vertical projection, and orthographic projection on the horizontal axis is<br />
the horizontal projection.<br />
Looking at the breadth of research areas in these vertical and horizontal projections, the group of research<br />
areas related to life science has the broadest breadth. The breadths of other groups vary somewhat in their<br />
vertical and horizontal projections. The particle physics/cosmology group of research areas is separate from<br />
other research areas and has a narrow skirt.<br />
The isolated location of the particle physics/cosmology group on the map is attributable to a limited<br />
knowledge transfer between this group and other groups. Particle physics/cosmology has ultimate goals such<br />
as the unification of force fields and understanding of the origin of the universe, and experimental and<br />
theoretical research are co-evolved over time in deep entanglement. There is thus a tendency towards<br />
co-citation among specific research papers and research areas, resulting in a relatively narrow distribution for<br />
iv
the group of research areas on the map. Because co-citation with research areas other than particle<br />
physics/cosmology is limited, even in time series, the peaks of particle physics/cosmology will probably<br />
change little, and core papers will remain concentrated.<br />
The situation is different for the group of research areas related to life science. The subjects of life science<br />
research are diverse (plants, animals, fungi, etc.), as are its approaches (i.e., the molecular, cell, organ, and<br />
individual level). Thus, widely diverse themes can be set and joined in complex combinations to advance<br />
understanding of nature. This makes it possible for research areas fuse, separate, move, nucleate, and disappear<br />
on the map. There is therefore no need for the core papers to concentrate in a single region the way those of<br />
particle physics/cosmology do.<br />
Furthermore, citation of life science related research papers begins sooner after publication than with other<br />
fields. In other words, the process of research area formation is more volatile. A snapshot of a given time such<br />
as the Science Map should therefore enable one to view research areas in various phases of development. In<br />
fact, on the Science map that plots 687 research areas (Figure 1), the majority of research areas are observed in<br />
the life science related region.<br />
Figure 3: Science Map 2006 in horizontal and vertical projection<br />
[Horizontal projection]<br />
Physics research<br />
Particle physics/cosmology<br />
Nanoscience<br />
Chemical synthesis<br />
Life science<br />
Unit<br />
(Max density)<br />
0.80<br />
Or more<br />
Life science<br />
Nanoscience<br />
Chemical synthesis<br />
Physics research<br />
[Vertical projection]<br />
Environment<br />
Particle physics/cosmology<br />
Note 1: Orthographic projection on the vertical axis is the vertical projection, and orthographic projection on the horizontal axis is the horizontal<br />
projection.<br />
Note 2: The height of the mountains indicates core-paper density. The higher the mountain, the greater the concentration of core papers.<br />
Data: Tabulated from Thomson Reuters’ "Essential Science Indicators" by the National Institute of Science and Technology Policy<br />
v
3. Changes in scientific research, a comparison of Science Map 2004 and<br />
Science Map 2006<br />
Comparison of Science Map 2004 (covering the years 1999–2004) and Science Map 2006 (2001–2006) and<br />
interviews with experts confirmed steady, ongoing change over two years. The important points were as<br />
follows.<br />
(1) Life science<br />
In life science related research areas, post-genomics is about to bridge 1) plant science research<br />
that focuses mainly on studying plants and fungi and 2) heart and blood vessels research, brain<br />
research, study of obesity, cancer research, and research on infectious diseases/immunology that<br />
focus mainly on studying animals and fungi.<br />
Two factors contribute to this phenomenon. First, there is the trend in life science research to attempt to<br />
understand broader and more complex regulatory mechanisms of life phenomena. Research on life phenomena<br />
in animals and plants, long focused on elucidating the regulatory mechanisms for transcription from DNA to<br />
RNA. Beginning in 2000, however, much research on RNAi and other regulatory mechanisms at the RNA level,<br />
regulatory mechanisms after protein translation, and in vivo protein localization regulation has also been<br />
published. On the Science Map, this trend can be observed in the fusion of "Research on epigenetic<br />
transcriptional regulation (2004, ID 130)" and "Analysis of mechanism of regulation of plant growth (2004, ID<br />
33)" to form "Multi-hierarchical regulatory mechanism of life phenomena (2006, ID 111)" (movement<br />
indicated by the blue arrow in Figure 4).<br />
Figure 4: Changes in life science related research<br />
Science Map 2004 Science Map 2006<br />
Note: Yellow arrows indicate hot research areas in which concentrations of core papers continued without division. Red arrows indicate hot<br />
research areas in which concentrations of core papers divided into multiple groups. Blue arrows indicate hot research areas that fused on the<br />
Science Map 2006. This indicates a correspondence relationship in which there were at least 80 core papers, with at least 20 overlapping between<br />
different hot research areas. Hot research areas with at least 80 core papers are depicted as yellow dots, while the locations of those with less than<br />
80 core papers are indicated with red dots.<br />
Data: Tabulated from Thomson Reuters’ "Essential Science Indicators" by the National Institute of Science and Technology Policy<br />
vi
Second, the position of protein research changed. In the Science Map 2004, "Research on proteome (2004,<br />
ID 105)" had a somewhat isolated position between chemical synthesis and life science. In the Science Map<br />
2006, however, its successor research area, "Isotope labeling/quantitative mass spectrometry/protein analysis<br />
(2006, ID 119)," moved to the center of the post-genomics group of research areas. This kind of research has<br />
a very strong "chemistry" element to it, which can be taken as a scientific trend. In mass spectrographic analysis<br />
of proteins, Koichi Tanaka of Shimadzu Corp. developed a "desorption ionization" method for mass<br />
spectrographic analysis of macromolecules, which earned him a Nobel Prize in chemistry. As genome<br />
sequencing using model organisms advances, comprehensive research on proteins is drawing attention. Mass<br />
spectrography is being aggressively incorporated into life science related research and has taken root as a<br />
post-genomics method.<br />
<br />
Links between post-genomics and plant science research have grown stronger, changing the characters of<br />
some research areas and dividing others. "Stress response in plants (2004, ID 34)" in the Science Map 2004<br />
divided into "Environmental stress response/metabolic profiling/cellular structure and phospholipid<br />
metabolism in plant (2006, ID 33)" and "Plant defense against infection/plant immunity" in the Science Map<br />
2006. In the 2000s, research on gene identification, intergenetic networks, transcriptome analysis, and<br />
metabolome in model plants has grown active. More detailed research has progressed, and various research<br />
communities have formed. Experts indicated that henceforth the relationship between such research and<br />
environmental and food-related issues will likely become important. As in the Science Map 2004, Japan is<br />
making a strong effort in plant science. China's presence in the field, however, is growing, so that trend bears<br />
watching.<br />
<br />
Clinical medicine is one of the more rapidly changing fields in science. Since the Science Map 2004, research<br />
areas directly related to or linked to clinical medicine have continued at a larger size or grown so large that they<br />
have split. In the Science Map 2006, it was found that many research areas expected to grow further in the<br />
future were scattered around the group of research areas relate to life science. The seeds for the next hot<br />
research areas have already been planted.<br />
vii
(2) Chemical synthesis and nanoscience<br />
In life science and nanoscience, as research at the molecular level progresses, the territory of<br />
"chemistry" is broadening. Nanoscience is steadily developing. As can be seen in the Science Map,<br />
the volume of research linking chemical synthesis and nanoscience is increasing.<br />
<br />
Research on asymmetric synthesis using organic catalysts<br />
showed a rapid increase. Understanding nature at the level of<br />
chemical structural formulas is fundamental to chemistry. With<br />
life science and nanoscience research at the molecular level<br />
progressing, the territory covered by chemistry is expanding. On<br />
the Science Map, chemistry is located between life science and<br />
physics, reflecting this situation.<br />
<br />
Nanoscience is steadily progressing. In the Science Map 2004,<br />
"Development of nanostructure and its application to molecular<br />
devices (2004, ID 106)" is observed as a single research area. It<br />
has since expanded to three independent research areas, "Study<br />
on supramolecular nanodevice by molecular machine and<br />
single-molecule conductor (2006, ID 86)," "DNA-nanomaterial<br />
and nanodevice (2006, ID 87)," and "Study on synthesis and<br />
optical application of metal and metal oxide<br />
nanoparticle/nanostructure (2006, ID116)." As can be seen in<br />
the Science Map (See Figure 5), the volume of research linking<br />
chemical synthesis and nanoscience is increasing.<br />
Figure 5: Increase in research areas<br />
between chemical synthesis and<br />
nanoscience<br />
【Projected figure】<br />
【Science map】<br />
Density distribution of Papers<br />
Science Map<br />
2004<br />
Chemical synthesis<br />
Data: Tabulated by the National Institute of Science and<br />
Technology Policy based on Thomson Reuters’<br />
"Essential Science Indicators"<br />
Nanoscience<br />
Science Map<br />
2006<br />
Chemical synthesis<br />
Nanoscience<br />
(3) Condensed matter physics and particle physics/cosmology<br />
In condensed matter physics, quantum computing and superconductivity were extracted as hot<br />
research areas. Launch of the European Organization for Nuclear Research's (CERN) Large<br />
Hadron Collider (LHC) will be a large step for particle physics/cosmology. Discoveries of new<br />
phenomena and verification and testing of theories will take place.<br />
<br />
Condensed matter physics includes hot research areas related to quantum computing and superconductivity.<br />
Comparing the Science Map 2004 with the Science Map 2006, the number of research papers in<br />
"Ferromagnetic semiconductor spintronics (2006, ID 55)" and "Electrical control of spin in<br />
semiconductors/quantum computer using solid state components (2006, ID 57)" increased. Experts suggested<br />
that while the location of condensed matter physics in between chemical synthesis and particle<br />
physics/cosmology on the map will probably not change, the hot research areas are likely to change with the<br />
times.<br />
<br />
Comparing the Science Map 2004 with the Science Map 2006, the hot research areas from 2004 generally<br />
continued, although some merged. This is because particle physics/cosmology has ultimate goals such as the<br />
unification of force fields and understanding of the origin of the universe, and research continues to evolve in<br />
those directions. Relationships between particle physics/cosmology and other groups of research areas were<br />
viii
not expected to change significantly, and indeed observation of changes in the Science Map over time found no<br />
change in the group's position on the map, even though research content changed.<br />
Particle physics/cosmology is a field that progresses as experimentation and theory mutually stimulate one<br />
another. Theory has led the way, but with the launch of the European Organization for Nuclear Research's<br />
(CERN) Large Hadron Collider (LHC), discoveries of new phenomena and verification and testing of theories<br />
will take place.<br />
4. Observation of inter-/multi-disciplinary research on the Science Map<br />
It was found that the mapping is helpful to distinguish multidisciplinary research, e.g.,<br />
environmental research, from interdisciplinary research, e.g., nanoscience.<br />
Figure 6 shows the field distribution of core papers in the Science Map, and plots inter-/multi-disciplinary<br />
hot research areas by analysis of field category.<br />
The differences in the distribution of hot research areas in nanoscience and environment were distinctive. In<br />
the map, the group of research areas related to nanoscience stakes out a clear domain between chemical<br />
synthesis and physics, but the group of research areas related to environment spreads out spatially. This<br />
indicates that mapping is helpful to distinguish multidisciplinary research from interdisciplinary research.<br />
Interdisciplinary research that relies on shared knowledge is generated when separate fields such as physics<br />
and chemistry interact. Nanoscience typifies this phenomenon. In interdisciplinary research that relies on<br />
shared knowledge, the important thing is that research development stages (research methods and research<br />
targets) should be the same in multiple fields. If development stages differ, generation of interdisciplinary<br />
research is extremely unlikely. For example, interdisciplinary research in nanoscience was realized during the<br />
early 1990s because both chemistry and physics were targeting nanoscale phenomena and matter, the former at<br />
the molecular level and the latter at the bulk level. The accumulation of knowledge is a precondition that sets<br />
the stage for interdisciplinary research that relies on shared knowledge. Observation of such research can<br />
therefore be expected in the Science Map where existing research interacts. In fact, nanoscience appears on the<br />
Science Map where differing fields such as physics and chemistry intersect.<br />
In multidisciplinary research, various disciplines address scientific and social challenges independently rather<br />
than in collaboration. Thus it shares goals of research. Environmental research typifies this phenomenon. For<br />
example, in environmental research, study of biodiversity requires approaches from plant and animal science,<br />
while research on the environmental impacts of chemicals requires approaches from chemistry. These research<br />
areas stand on the foundation of knowledge in existing fields, and goal-oriented approaches are common. This<br />
means that in the Science Map, environmental research is likely to come from the vicinity of existing fields. In<br />
fact, the environment group of research areas appears on the Science Map with ongoing links to existing fields,<br />
and a broad spread with sometimes weak ties to environmental research.<br />
It thus becomes clear that interdisciplinary research that relies on shared knowledge (nanoscience) and<br />
multidisciplinary research that relies on shared goals (environment) are observed in differing forms in the<br />
Science Map.<br />
The points to bear in mind differ when promoting interdisciplinary type research or multidisciplinary type<br />
research. To promote interdisciplinary research that relies on shared knowledge, an arena for interdisciplinary<br />
research must be constructed when the research development stages (research methods and targets) of multiple<br />
fields match. On the other hand, to promote multidisciplinary research that relies on shared goals, clear goals<br />
must be set, and an arena for researchers who have the knowledge to meet those goals to gather must be<br />
constructed.<br />
ix
Figure 6: Locations of inter-/multi-disciplinary research areas in the Science Map<br />
Clinical medicine<br />
Chemistry<br />
Materials science<br />
Physics<br />
Computer science<br />
Engineering<br />
Environment/ecology/Earth science<br />
Clinical medicine<br />
Basic biology<br />
Other<br />
Basic biology<br />
Computer science<br />
Materials science<br />
Engineering<br />
Nanoscience<br />
Environment<br />
Chemistry<br />
Physics<br />
Environment/ecology/Earth science<br />
Engineering<br />
Space science<br />
Physics<br />
Note: Locations where at least 60 percent of core papers in a given field are distributed have that field's color. Locations where less than 60<br />
percent of a given field's core papers are distributed are considered inter-/multi-disciplinary and not given a field color.<br />
Data: Tabulated from Thomson Reuters’ "Essential Science Indicators" by the National Institute of Science and Technology Policy<br />
x
5. The breadth and intensity of research activities in Japan, the USA, and<br />
China<br />
Adding information such as the ratios of each country's research papers to the Science Map<br />
enables visualization of activity in the countries. In the Science Map 2006, it became clear that<br />
the breadth and intensity of China's scientific research are expanding.<br />
Japan's average share of research papers in the 124 hot research areas derived for the Science Map 2006 is<br />
9.6%, an increase from the Science Map 2004 (9.1%). Furthermore, the percentage of the 124 hot research<br />
areas for which Japan has a 0-percent share decreased. Within the 124 hot research areas, Japan's presence is<br />
relatively large in hot research areas in physics, chemistry, and plant and animal science.<br />
The hot research area where Japan's share of core papers is highest is "Construction of artificial<br />
photosynthesis model mimicking antenna system and charge separation system (ID 80)," with an 80-percent<br />
share. Japan's next highest shares are in "High-temperature superconductivity spectroscopy/new electron phase<br />
(ID 58)," "Innate immunity (ID 108)," "Brane cosmology from the perspective of duality of anti de sitter space<br />
and conformal field theory (ID 65)," and "Ghrelin/function and pathophysiological significance (ID 15)."<br />
Looking at other countries, even though many nations around the world are increasing their production of<br />
research papers, the USA remains an important source of knowledge for science as a whole. The USA's<br />
activities as illustrated in the Science Map show lower shares of research papers in the chemical synthesis and<br />
nanoscience groups of research areas than in life science.<br />
In the Science Map 2004, China's scientific research was limited to nanoscience. Over the following two<br />
years, China increased both the breadth and intensity of its activities. (See Figure 7.) China increased its share<br />
of research papers in nanoscience, with an increase in the neighboring area of physics as well. Furthermore, in<br />
the Science Map 2006, China's share of research papers in plant science research also increased. The breadth<br />
of scientific research in China has thus extended to life science.<br />
Figure 7: China's share of research papers as shown in Science Map 2004 and Science Map 2006<br />
Research on heart and blood vessels<br />
Share within grid<br />
At least<br />
0.30<br />
Research on heart and blood vessels<br />
Share within grid<br />
At least<br />
0.30<br />
Research on<br />
infectious<br />
diseases/<br />
immunology<br />
Study of obesity<br />
Cancer<br />
research<br />
Post-genomics<br />
Brain research<br />
Research on<br />
infectious<br />
diseases/<br />
immunology<br />
Study of obesity<br />
Cancer<br />
research<br />
Brain research<br />
Post-genomics<br />
Nanoscience<br />
Nanoscience<br />
Plant science<br />
research<br />
Plant science<br />
research<br />
Environment<br />
Chemical<br />
synthesis<br />
Environment<br />
Chemical<br />
synthesis<br />
Physics research<br />
Physics research<br />
Particle physics/cosmology<br />
Particle physics/cosmology<br />
Science Map 2004<br />
Science Map 2006<br />
Note: Research paper shares of at least 5 percent are shown in light blue, and shares of at least 30 percent in red. Research paper shares were<br />
calculated by whole number count.<br />
Data: Tabulated from Thomson Reuters’ "Essential Science Indicators" by the National Institute of Science and Technology Policy<br />
xi
6. Future developments<br />
Use of the Science Map has established methodology for observation of dynamic change in<br />
natural science, analysis of the forms of inter-/multi-disciplinary research areas, and analysis of<br />
the status of scientific activity in various countries. The following are four possible developments<br />
for the future developments.<br />
<br />
Comparison of the Science Map 2004 and the Science Map 2006 and interviews with experts confirmed that<br />
scientific research gradually changes over a two-year period. Even as the Science Map 2006 was being created,<br />
science continued its development with accomplishments such as the production of iPS cells. By carrying out<br />
periodic observation of science and taking panoramic snapshots of science over time with the Science Map, we<br />
can describe dynamic change in natural science, such as the way one scientific innovation influences other<br />
research areas.<br />
Furthermore, considering the application of the Science Map to science and technology policy, finding<br />
emerging research areas that will develop in the future is an important theme. This research experimented with<br />
attempting to find research areas likely to develop in the future. Beginning with the next Science Map, trends in<br />
these research areas will be tracked. This should deepen knowledge of methods for using science mapping to<br />
find emerging research areas.<br />
<br />
Adding statistical data to the Science Map, such as the ratios of research papers from various countries, is<br />
effective. The Science Map 2006 clearly showed that China is expanding the breadth and intensity of its<br />
scientific research activity. In addition to the ratios of research papers for various countries, linkage to the<br />
distribution of research funding or the distribution of universities and government research institutions, for<br />
example, is possible. Analysis of the relationship between the development of scientific research and such<br />
information over time could obtain data on the influence of research funding on the development of scientific<br />
research or the role of universities and government research institutions in the generation of knowledge.<br />
Moreover, detailed investigation of co-authorship within research areas could clarify dependence on interaction<br />
among researchers and organizations in the process of forming scientific knowledge.<br />
<br />
Considered from the perspective of science and technology, the breadth of observation using the Science<br />
Map is limited to science, in terms of results published in research papers. In order to take a broader view of<br />
science and technology, it is necessary to create technology maps as well, using data such as patents. Using the<br />
research papers cited in patent documents, Science Maps and technology maps could be linked. The knowledge<br />
transfer from science to technology and from technology to science and field dependence could be observed.<br />
<br />
During interviews, we were struck by the usefulness of the Science map as a basis for discussion. In most<br />
interviews with experts, they express their opinions based on their own backgrounds. With shared data such as<br />
the Science Map, researchers from different fields can engage in more meaningful discussion of the<br />
development of scientific research. By sharing the same "arena," researchers can mutually adjust their sense of<br />
distance, facilitating discussion among researchers or among researchers and policy makers. In the future, we<br />
will incorporate this idea of the Science Map as an arena for discussion.<br />
xii