

Multivariate Statistical Analysis of Indiana Hydrologic Data
Multivariate Statistical Analysis of Indiana Hydrologic Data
Multivariate Statistical Analysis of Indiana Hydrologic Data

Create successful ePaper yourself
Turn your PDF publications into a flip-book with our unique Google optimized e-Paper software.
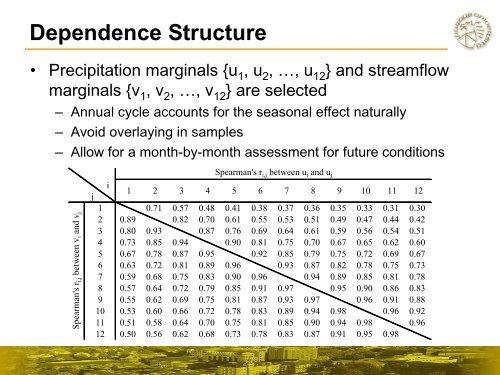
Dependence Structure<br />
• Precipitation marginals {u 1 , u 2 , …, u 12 } and streamflow<br />
marginals {v 1 , v 2 , …, v 12 } are selected<br />
– Annual cycle accounts for the seasonal effect naturally<br />
– Avoid overlaying in samples<br />
– Allow for a month-by-month assessment for future conditions<br />
Spearman's r i,j between v i and v j<br />
j<br />
1<br />
2<br />
3<br />
4<br />
5<br />
6<br />
7<br />
8<br />
9<br />
10<br />
11<br />
12<br />
i<br />
Spearman's r i,j between u i and u j<br />
1 2 3 4 5 6 7 8 9 10 11 12<br />
0.71 0.57 0.48 0.41 0.38 0.37 0.36 0.35 0.33 0.31 0.30<br />
0.89 0.82 0.70 0.61 0.55 0.53 0.51 0.49 0.47 0.44 0.42<br />
0.80 0.93 0.87 0.76 0.69 0.64 0.61 0.59 0.56 0.54 0.51<br />
0.73 0.85 0.94 0.90 0.81 0.75 0.70 0.67 0.65 0.62 0.60<br />
0.67 0.78 0.87 0.95 0.92 0.85 0.79 0.75 0.72 0.69 0.67<br />
0.63 0.72 0.81 0.89 0.96 0.93 0.87 0.82 0.78 0.75 0.73<br />
0.59 0.68 0.75 0.83 0.90 0.96 0.94 0.89 0.85 0.81 0.78<br />
0.57 0.64 0.72 0.79 0.85 0.91 0.97 0.95 0.90 0.86 0.83<br />
0.55 0.62 0.69 0.75 0.81 0.87 0.93 0.97 0.96 0.91 0.88<br />
0.53 0.60 0.66 0.72 0.78 0.83 0.89 0.94 0.98 0.96 0.92<br />
0.51 0.58 0.64 0.70 0.75 0.81 0.85 0.90 0.94 0.98 0.96<br />
0.50 0.56 0.62 0.68 0.73 0.78 0.83 0.87 0.91 0.95 0.98


