StrataPlot â A Graphic Correlation Software Application and ... - Geon
StrataPlot â A Graphic Correlation Software Application and ... - Geon
StrataPlot â A Graphic Correlation Software Application and ... - Geon
You also want an ePaper? Increase the reach of your titles
YUMPU automatically turns print PDFs into web optimized ePapers that Google loves.
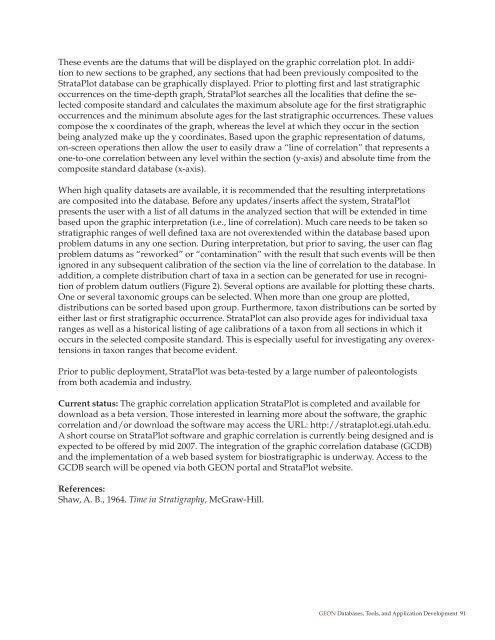
These events are the datums that will be displayed on the graphic correlation plot. In addition<br />
to new sections to be graphed, any sections that had been previously composited to the<br />
<strong>StrataPlot</strong> database can be graphically displayed. Prior to plotting first <strong>and</strong> last stratigraphic<br />
occurrences on the time-depth graph, <strong>StrataPlot</strong> searches all the localities that define the selected<br />
composite st<strong>and</strong>ard <strong>and</strong> calculates the maximum absolute age for the first stratigraphic<br />
occurrences <strong>and</strong> the minimum absolute ages for the last stratigraphic occurrences. These values<br />
compose the x coordinates of the graph, whereas the level at which they occur in the section<br />
being analyzed make up the y coordinates. Based upon the graphic representation of datums,<br />
on-screen operations then allow the user to easily draw a “line of correlation” that represents a<br />
one-to-one correlation between any level within the section (y-axis) <strong>and</strong> absolute time from the<br />
composite st<strong>and</strong>ard database (x-axis).<br />
When high quality datasets are available, it is recommended that the resulting interpretations<br />
are composited into the database. Before any updates/inserts affect the system, <strong>StrataPlot</strong><br />
presents the user with a list of all datums in the analyzed section that will be extended in time<br />
based upon the graphic interpretation (i.e., line of correlation). Much care needs to be taken so<br />
stratigraphic ranges of well defined taxa are not overextended within the database based upon<br />
problem datums in any one section. During interpretation, but prior to saving, the user can flag<br />
problem datums as “reworked” or “contamination” with the result that such events will be then<br />
ignored in any subsequent calibration of the section via the line of correlation to the database. In<br />
addition, a complete distribution chart of taxa in a section can be generated for use in recognition<br />
of problem datum outliers (Figure 2). Several options are available for plotting these charts.<br />
One or several taxonomic groups can be selected. When more than one group are plotted,<br />
distributions can be sorted based upon group. Furthermore, taxon distributions can be sorted by<br />
either last or first stratigraphic occurrence. <strong>StrataPlot</strong> can also provide ages for individual taxa<br />
ranges as well as a historical listing of age calibrations of a taxon from all sections in which it<br />
occurs in the selected composite st<strong>and</strong>ard. This is especially useful for investigating any overextensions<br />
in taxon ranges that become evident.<br />
Prior to public deployment, <strong>StrataPlot</strong> was beta-tested by a large number of paleontologists<br />
from both academia <strong>and</strong> industry.<br />
Current status: The graphic correlation application <strong>StrataPlot</strong> is completed <strong>and</strong> available for<br />
download as a beta version. Those interested in learning more about the software, the graphic<br />
correlation <strong>and</strong>/or download the software may access the URL: http://strataplot.egi.utah.edu.<br />
A short course on <strong>StrataPlot</strong> software <strong>and</strong> graphic correlation is currently being designed <strong>and</strong> is<br />
expected to be offered by mid 2007. The integration of the graphic correlation database (GCDB)<br />
<strong>and</strong> the implementation of a web based system for biostratigraphic is underway. Access to the<br />
GCDB search will be opened via both GEON portal <strong>and</strong> <strong>StrataPlot</strong> website.<br />
References:<br />
Shaw, A. B., 1964. Time in Stratigraphy, McGraw-Hill.<br />
GEON Databases, Tools, <strong>and</strong> <strong>Application</strong> Development 91


