StrataPlot â A Graphic Correlation Software Application and ... - Geon
StrataPlot â A Graphic Correlation Software Application and ... - Geon
StrataPlot â A Graphic Correlation Software Application and ... - Geon

You also want an ePaper? Increase the reach of your titles
YUMPU automatically turns print PDFs into web optimized ePapers that Google loves.
<strong>StrataPlot</strong> – A <strong>Graphic</strong> <strong>Correlation</strong> <strong>Software</strong><br />
<strong>Application</strong> <strong>and</strong> Database<br />
Emil Platon (University of Utah)<br />
Paul J. Sikora (University of Utah)<br />
Objective: Promote the use of graphic correlation for biostratigraphic analysis <strong>and</strong> make available<br />
to the public a large chronostratigraphic dataset. To achieve this objective, a professional,<br />
user-friendly software application for graphic correlation was designed, built, tested, <strong>and</strong><br />
distributed. A subsequent objective is to integrate the supporting chronostratigraphic database<br />
with other paleontological databases <strong>and</strong> implement a web based query system for retrieving<br />
age data generated via graphic correlation.<br />
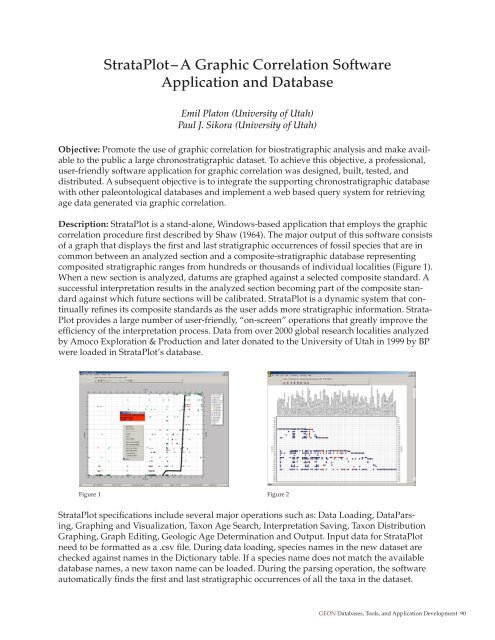
Description: <strong>StrataPlot</strong> is a st<strong>and</strong>-alone, Windows-based application that employs the graphic<br />
correlation procedure first described by Shaw (1964). The major output of this software consists<br />
of a graph that displays the first <strong>and</strong> last stratigraphic occurrences of fossil species that are in<br />
common between an analyzed section <strong>and</strong> a composite-stratigraphic database representing<br />
composited stratigraphic ranges from hundreds or thous<strong>and</strong>s of individual localities (Figure 1).<br />
When a new section is analyzed, datums are graphed against a selected composite st<strong>and</strong>ard. A<br />
successful interpretation results in the analyzed section becoming part of the composite st<strong>and</strong>ard<br />
against which future sections will be calibrated. <strong>StrataPlot</strong> is a dynamic system that continually<br />
refines its composite st<strong>and</strong>ards as the user adds more stratigraphic information. Strata-<br />
Plot provides a large number of user-friendly, “on-screen” operations that greatly improve the<br />
efficiency of the interpretation process. Data from over 2000 global research localities analyzed<br />
by Amoco Exploration & Production <strong>and</strong> later donated to the University of Utah in 1999 by BP<br />
were loaded in <strong>StrataPlot</strong>’s database.<br />
Figure 1 Figure 2<br />
<strong>StrataPlot</strong> specifications include several major operations such as: Data Loading, DataParsing,<br />
Graphing <strong>and</strong> Visualization, Taxon Age Search, Interpretation Saving, Taxon Distribution<br />
Graphing, Graph Editing, Geologic Age Determination <strong>and</strong> Output. Input data for <strong>StrataPlot</strong><br />
need to be formatted as a .csv file. During data loading, species names in the new dataset are<br />
checked against names in the Dictionary table. If a species name does not match the available<br />
database names, a new taxon name can be loaded. During the parsing operation, the software<br />
automatically finds the first <strong>and</strong> last stratigraphic occurrences of all the taxa in the dataset.<br />
GEON Databases, Tools, <strong>and</strong> <strong>Application</strong> Development 90
These events are the datums that will be displayed on the graphic correlation plot. In addition<br />
to new sections to be graphed, any sections that had been previously composited to the<br />
<strong>StrataPlot</strong> database can be graphically displayed. Prior to plotting first <strong>and</strong> last stratigraphic<br />
occurrences on the time-depth graph, <strong>StrataPlot</strong> searches all the localities that define the selected<br />
composite st<strong>and</strong>ard <strong>and</strong> calculates the maximum absolute age for the first stratigraphic<br />
occurrences <strong>and</strong> the minimum absolute ages for the last stratigraphic occurrences. These values<br />
compose the x coordinates of the graph, whereas the level at which they occur in the section<br />
being analyzed make up the y coordinates. Based upon the graphic representation of datums,<br />
on-screen operations then allow the user to easily draw a “line of correlation” that represents a<br />
one-to-one correlation between any level within the section (y-axis) <strong>and</strong> absolute time from the<br />
composite st<strong>and</strong>ard database (x-axis).<br />
When high quality datasets are available, it is recommended that the resulting interpretations<br />
are composited into the database. Before any updates/inserts affect the system, <strong>StrataPlot</strong><br />
presents the user with a list of all datums in the analyzed section that will be extended in time<br />
based upon the graphic interpretation (i.e., line of correlation). Much care needs to be taken so<br />
stratigraphic ranges of well defined taxa are not overextended within the database based upon<br />
problem datums in any one section. During interpretation, but prior to saving, the user can flag<br />
problem datums as “reworked” or “contamination” with the result that such events will be then<br />
ignored in any subsequent calibration of the section via the line of correlation to the database. In<br />
addition, a complete distribution chart of taxa in a section can be generated for use in recognition<br />
of problem datum outliers (Figure 2). Several options are available for plotting these charts.<br />
One or several taxonomic groups can be selected. When more than one group are plotted,<br />
distributions can be sorted based upon group. Furthermore, taxon distributions can be sorted by<br />
either last or first stratigraphic occurrence. <strong>StrataPlot</strong> can also provide ages for individual taxa<br />
ranges as well as a historical listing of age calibrations of a taxon from all sections in which it<br />
occurs in the selected composite st<strong>and</strong>ard. This is especially useful for investigating any overextensions<br />
in taxon ranges that become evident.<br />
Prior to public deployment, <strong>StrataPlot</strong> was beta-tested by a large number of paleontologists<br />
from both academia <strong>and</strong> industry.<br />
Current status: The graphic correlation application <strong>StrataPlot</strong> is completed <strong>and</strong> available for<br />
download as a beta version. Those interested in learning more about the software, the graphic<br />
correlation <strong>and</strong>/or download the software may access the URL: http://strataplot.egi.utah.edu.<br />
A short course on <strong>StrataPlot</strong> software <strong>and</strong> graphic correlation is currently being designed <strong>and</strong> is<br />
expected to be offered by mid 2007. The integration of the graphic correlation database (GCDB)<br />
<strong>and</strong> the implementation of a web based system for biostratigraphic is underway. Access to the<br />
GCDB search will be opened via both GEON portal <strong>and</strong> <strong>StrataPlot</strong> website.<br />
References:<br />
Shaw, A. B., 1964. Time in Stratigraphy, McGraw-Hill.<br />
GEON Databases, Tools, <strong>and</strong> <strong>Application</strong> Development 91