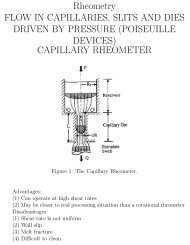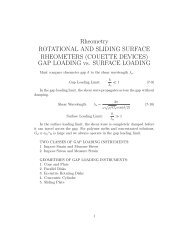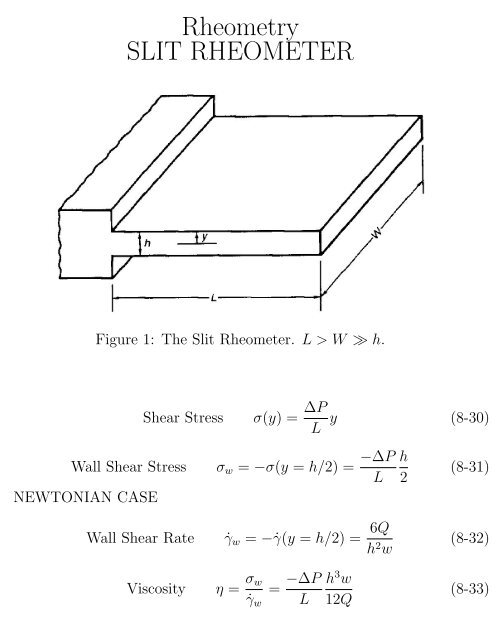
Rheometry SLIT RHEOMETER
Rheometry SLIT RHEOMETER
Rheometry SLIT RHEOMETER

Create successful ePaper yourself
Turn your PDF publications into a flip-book with our unique Google optimized e-Paper software.
<strong>Rheometry</strong><br />
<strong>SLIT</strong> <strong>RHEOMETER</strong><br />
Figure 1: The Slit Rheometer. L > W ≫ h.<br />
Shear Stress<br />
Wall Shear Stress<br />
NEWTONIAN CASE<br />
σ(y) = ∆P<br />
L y (8-30)<br />
σ w = −σ(y = h/2) = −∆P<br />
L<br />
h<br />
2<br />
(8-31)<br />
Wall Shear Rate<br />
Viscosity<br />
˙γ w = − ˙γ(y = h/2) = 6Q<br />
h 2 w<br />
η = σ w<br />
= −∆P h 3 w<br />
˙γ w L 12Q<br />
(8-32)<br />
(8-33)
<strong>Rheometry</strong><br />
<strong>SLIT</strong> <strong>RHEOMETER</strong><br />
NON-NEWTONIAN CASE<br />
Correction for the real wall shear rate is analogous to the Rabinowitch<br />
correction.<br />
( ) ( )<br />
6Q 2 + β<br />
Wall Shear Rate ˙γ w =<br />
(8-34a)<br />
h 2 w 3<br />
β = d [log(6Q/h2 w)]<br />
d [log(σ w )]<br />
(8-34b)<br />
Apparent Viscosity<br />
η = σ w<br />
= −∆P<br />
˙γ w L<br />
h 3 w<br />
4Q(2 + β)<br />
NORMAL STRESS DIFFERENCE<br />
The normal stress difference N 1 can be determined from the exit pressure<br />
P e .<br />
( ) dPe<br />
N 1 ( ˙γ w ) = P e + σ w (8-45)<br />
dσ w<br />
(<br />
N 1 ( ˙γ w ) = P e 1 + d(log P )<br />
e)<br />
(8-46)<br />
d(log σ w )<br />
These relations were calculated assuming straight parallel streamlines<br />
right up to the exit of the die. This assumption is not found to be valid<br />
in either experiment or computer simulation.
<strong>Rheometry</strong><br />
<strong>SLIT</strong> <strong>RHEOMETER</strong><br />
NORMAL STRESS DIFFERENCE<br />
N 1 ( ˙γ w ) = P e + σ w<br />
( dPe<br />
dσ w<br />
)<br />
N 1 ( ˙γ w ) = P e<br />
(<br />
1 + d(log P e)<br />
d(log σ w )<br />
)<br />
(8-45)<br />
(8-46)<br />
Figure 2: Determination of the Exit Pressure.
<strong>Rheometry</strong><br />
<strong>SLIT</strong> <strong>RHEOMETER</strong><br />
NORMAL STRESS DIFFERENCE<br />
Figure 3: Comparison of First Normal Stress Difference Values for LDPE<br />
from Slit Rheometer Exit Pressure (filled symbols) and Cone&Plate (open<br />
symbols).<br />
The poor agreement indicates that the more work is needed in order to<br />
use exit pressures to measure normal stress differences.
<strong>Rheometry</strong><br />
<strong>SLIT</strong> <strong>RHEOMETER</strong><br />
ENTRANCE PRESSURE DROP<br />
There is a pressure drop in the flow contraction at the entrance of the slit<br />
die (just like the capillary die).<br />
Figure 4: Birefringent Fringe Patterns for HDPE in the Entrance Region of<br />
a Slit Die.<br />
However, using multiple flush-mounted pressure transducers avoids the<br />
necessity of the Bagley end correction in the slit rheometer.
<strong>Rheometry</strong><br />
<strong>SLIT</strong> AND CAPILLARY <strong>RHEOMETER</strong>S<br />
DIE SWELL<br />
Figure 5: Extrudate Swell after Exiting the Die Diminishes as the Die is<br />
Made Longer.<br />
Die swell is a viscoelastic memory effect from the flow contraction at the<br />
entrance to the die.
<strong>Rheometry</strong><br />
<strong>SLIT</strong> AND CAPILLARY <strong>RHEOMETER</strong>S<br />
DIE SWELL<br />
Figure 6: Apparent Viscosity and Die Swell Ratio for a Polystyrene in a<br />
Capillary Rheometer.<br />
At ˙γ w = 10 −1 s −1 , the chain has time to relax during flow.<br />
Deborah Number λ ˙γ w < 1<br />
λ is the molecular relaxation time.<br />
1/ ˙γ w is the experimental time scale.<br />
At ˙γ w = 10 2 s −1 , the chain is stretched by the flow.<br />
Deborah Number λ ˙γ w > 1
<strong>Rheometry</strong><br />
<strong>SLIT</strong> AND CAPILLARY <strong>RHEOMETER</strong>S<br />
DIE SWELL<br />
Figure 7: Die Swell Ratio from a Polystyrene in a Capillary Rheometer, as<br />
Functions of Wall Shear Rate and Wall Shear Stress.<br />
For a given die, the die swell is a function of the wall shear stress in the<br />
liquid.
<strong>Rheometry</strong><br />
<strong>SLIT</strong> AND CAPILLARY <strong>RHEOMETER</strong>S<br />
DIE SWELL<br />
Figure 8: Capillary Die Swell.<br />
Figure 9: Die Swell from Three Different Capillary Dies.<br />
Die swell is not a unique function of stress for different die geometries.<br />
Longer dies have less die swell (at the same shear stress) because the memory<br />
of the flow contraction at the entrance fades with increasing die length.
<strong>Rheometry</strong><br />
<strong>SLIT</strong> AND CAPILLARY <strong>RHEOMETER</strong>S<br />
DIE SWELL<br />
Figure 10: Die Swell in a Slit Die.<br />
Die swell also has important consequences in polymer processing, as dies<br />
must be designed with extrudate swell in mind. Changing polymer also<br />
changes the amount of die swell.<br />
Rheology is an important quality control tool to verify that raw materials<br />
are the same from batch to batch. Often viscosity and die swell from a<br />
capillary rheometer are checked are for quality control.
<strong>Rheometry</strong><br />
<strong>SLIT</strong> AND CAPILLARY <strong>RHEOMETER</strong>S<br />
EXTRUDATE DISTORTION<br />
Figure 11: Examples of Extrudate Distortion: (a) Spiralling, (b) Oscillatory<br />
Ripple, (c) Bambooing, and (d) Random Melt Fracture. At high rates (and<br />
stresses) a variety of flow instabilities can occur.
<strong>Rheometry</strong><br />
<strong>SLIT</strong> AND CAPILLARY <strong>RHEOMETER</strong>S<br />
EXTRUDATE DISTORTION<br />
Figure 12: Wall Shear Stress vs. Wall Shear Rate for HDPE Showing Flow<br />
Instabilities and Wall Slip.
<strong>Rheometry</strong><br />
MELT FLOW INDEX “<strong>RHEOMETER</strong>”<br />
Figure 13: The Melt Flow Indexer.
<strong>Rheometry</strong><br />
MELT-FLOW INDEX<br />
MF I = ρQ<br />
at constant stress<br />
If Newtonian, know µ =<br />
Polymers are non-Newtonian<br />
π∆P R4<br />
8QL<br />
µ ∼ 1<br />
MF I<br />
Figure 14: Viscosity versus shear rate for a nearly monodisperse polystyrene<br />
at several temperatures.
<strong>Rheometry</strong><br />
MELT-FLOW INDEX<br />
Can a single point measurement characterize η( ˙γ)<br />
Figure 15: Viscosity versus shear rate for a nearly monodisperse polystyrene<br />
at several temperatures.<br />
Two polymers have the same melt flow index, but very different flow<br />
properties.<br />
MF I is only useful for quality control if the molecular weight distributions<br />
of the materials are all similar.<br />
MF I is useless for process modeling.<br />
MF I is the single most widely used quality control measure in the plastics<br />
industry.