Bangladesh e-Journal of Sociology - Bangladeshsociology.org
Bangladesh e-Journal of Sociology - Bangladeshsociology.org
Bangladesh e-Journal of Sociology - Bangladeshsociology.org

Create successful ePaper yourself
Turn your PDF publications into a flip-book with our unique Google optimized e-Paper software.
<strong>Bangladesh</strong> e-<strong>Journal</strong> <strong>of</strong> <strong>Sociology</strong>. Volume 6, Number 1. 2009.<br />
14<br />
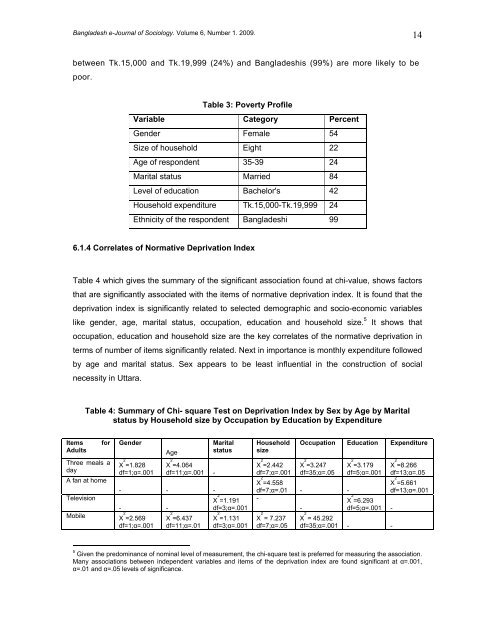
between Tk.15,000 and Tk.19,999 (24%) and <strong>Bangladesh</strong>is (99%) are more likely to be<br />
poor.<br />
Table 3: Poverty Pr<strong>of</strong>ile<br />
Variable Category Percent<br />
Gender Female 54<br />
Size <strong>of</strong> household Eight 22<br />
Age <strong>of</strong> respondent 35-39 24<br />
Marital status Married 84<br />
Level <strong>of</strong> education Bachelor's 42<br />
Household expenditure Tk.15,000-Tk.19,999 24<br />
Ethnicity <strong>of</strong> the respondent <strong>Bangladesh</strong>i 99<br />
6.1.4 Correlates <strong>of</strong> Normative Deprivation Index<br />
Table 4 which gives the summary <strong>of</strong> the significant association found at chi-value, shows factors<br />
that are significantly associated with the items <strong>of</strong> normative deprivation index. It is found that the<br />
deprivation index is significantly related to selected demographic and socio-economic variables<br />
like gender, age, marital status, occupation, education and household size. 5 It shows that<br />
occupation, education and household size are the key correlates <strong>of</strong> the normative deprivation in<br />
terms <strong>of</strong> number <strong>of</strong> items significantly related. Next in importance is monthly expenditure followed<br />
by age and marital status. Sex appears to be least influential in the construction <strong>of</strong> social<br />
necessity in Uttara.<br />
Table 4: Summary <strong>of</strong> Chi- square Test on Deprivation Index by Sex by Age by Marital<br />
status by Household size by Occupation by Education by Expenditure<br />
Items<br />
Adults<br />
for<br />
Three meals a<br />
day<br />
A fan at home<br />
Television<br />
Gender<br />
Χ 2 =1.828<br />
df=1;α=.001<br />
Age<br />
Χ 2 =4.064<br />
df=11;α=.001 -<br />
- - -<br />
- -<br />
Mobile Χ 2 =2.569<br />
df=1;α=.001<br />
Χ 2 =6.437<br />
df=11;α=.01<br />
Marital<br />
status<br />
Χ 2 =1.191<br />
df=3;α=.001<br />
Χ 2 =1.131<br />
df=3;α=.001<br />
Household<br />
size<br />
Χ 2 =2.442<br />
df=7;α=.001<br />
Occupation Education Expenditure<br />
Χ 2 =3.247<br />
df=35;α=.05<br />
Χ 2 =4.558<br />
df=7;α=.01 - -<br />
-<br />
-<br />
Χ 2 = 7.237<br />
df=7;α=.05<br />
Χ 2 =3.179<br />
df=5;α=.001<br />
Χ 2 =6.293<br />
df=5;α=.001 -<br />
Χ 2 = 45.292<br />
df=35;α=.001 - -<br />
Χ 2 =8.266<br />
df=13;α=.05<br />
Χ 2 =5.661<br />
df=13;α=.001<br />
5<br />
Given the predominance <strong>of</strong> nominal level <strong>of</strong> measurement, the chi-square test is preferred for measuring the association.<br />
Many associations between independent variables and items <strong>of</strong> the deprivation index are found significant at α=.001,<br />
α=.01 and α=.05 levels <strong>of</strong> significance.