Bangladesh e-Journal of Sociology - Bangladeshsociology.org
Bangladesh e-Journal of Sociology - Bangladeshsociology.org
Bangladesh e-Journal of Sociology - Bangladeshsociology.org

Create successful ePaper yourself
Turn your PDF publications into a flip-book with our unique Google optimized e-Paper software.
<strong>Bangladesh</strong> e-<strong>Journal</strong> <strong>of</strong> <strong>Sociology</strong>. Volume 6, Number 1. 2009.<br />
18<br />
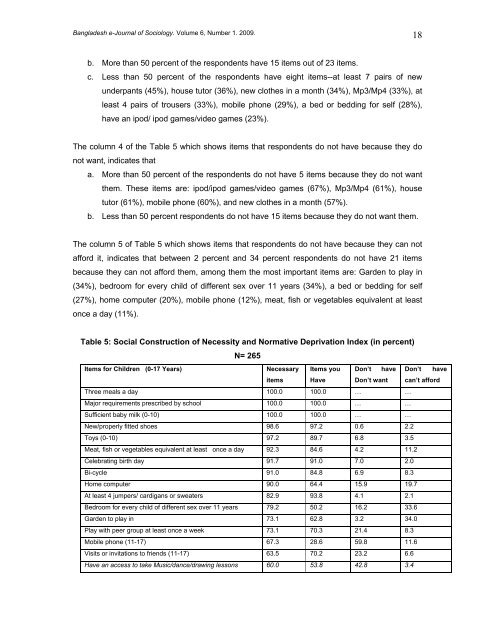
b. More than 50 percent <strong>of</strong> the respondents have 15 items out <strong>of</strong> 23 items.<br />
c. Less than 50 percent <strong>of</strong> the respondents have eight items--at least 7 pairs <strong>of</strong> new<br />
underpants (45%), house tutor (36%), new clothes in a month (34%), Mp3/Mp4 (33%), at<br />
least 4 pairs <strong>of</strong> trousers (33%), mobile phone (29%), a bed or bedding for self (28%),<br />
have an ipod/ ipod games/video games (23%).<br />
The column 4 <strong>of</strong> the Table 5 which shows items that respondents do not have because they do<br />
not want, indicates that<br />
a. More than 50 percent <strong>of</strong> the respondents do not have 5 items because they do not want<br />
them. These items are: ipod/ipod games/video games (67%), Mp3/Mp4 (61%), house<br />
tutor (61%), mobile phone (60%), and new clothes in a month (57%).<br />
b. Less than 50 percent respondents do not have 15 items because they do not want them.<br />
The column 5 <strong>of</strong> Table 5 which shows items that respondents do not have because they can not<br />
afford it, indicates that between 2 percent and 34 percent respondents do not have 21 items<br />
because they can not afford them, among them the most important items are: Garden to play in<br />
(34%), bedroom for every child <strong>of</strong> different sex over 11 years (34%), a bed or bedding for self<br />
(27%), home computer (20%), mobile phone (12%), meat, fish or vegetables equivalent at least<br />
once a day (11%).<br />
Table 5: Social Construction <strong>of</strong> Necessity and Normative Deprivation Index (in percent)<br />
N= 265<br />
Items for Children (0-17 Years)<br />
Necessary Items you Don’t have Don’t have<br />
items Have Don’t want can’t afford<br />
Three meals a day 100.0 100.0 … …<br />
Major requirements prescribed by school 100.0 100.0 … …<br />
Sufficient baby milk (0-10) 100.0 100.0 … …<br />
New/properly fitted shoes 98.6 97.2 0.6 2.2<br />
Toys (0-10) 97.2 89.7 6.8 3.5<br />
Meat, fish or vegetables equivalent at least once a day 92.3 84.6 4.2 11.2<br />
Celebrating birth day 91.7 91.0 7.0 2.0<br />
Bi-cycle 91.0 84.8 6.9 8.3<br />
Home computer 90.0 64.4 15.9 19.7<br />
At least 4 jumpers/ cardigans or sweaters 82.9 93.8 4.1 2.1<br />
Bedroom for every child <strong>of</strong> different sex over 11 years 79.2 50.2 16.2 33.6<br />
Garden to play in 73.1 62.8 3.2 34.0<br />
Play with peer group at least once a week 73.1 70.3 21.4 8.3<br />
Mobile phone (11-17) 67.3 28.6 59.8 11.6<br />
Visits or invitations to friends (11-17) 63.5 70.2 23.2 6.6<br />
Have an access to take Music/dance/drawing lessons 60.0 53.8 42.8 3.4