Sediment trap time series from the North Pacific Ocean - PICES
Sediment trap time series from the North Pacific Ocean - PICES
Sediment trap time series from the North Pacific Ocean - PICES

You also want an ePaper? Increase the reach of your titles
YUMPU automatically turns print PDFs into web optimized ePapers that Google loves.
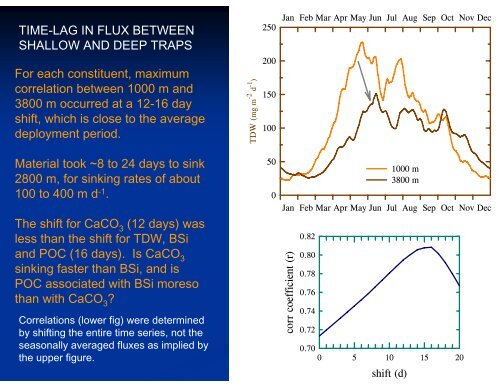
TIME-LAG IN FLUX BETWEEN<br />
SHALLOW AND DEEP TRAPS<br />
For each constituent, maximum<br />
correlation between 1000 m and<br />
3800 m occurred at a 12-16 day<br />
shift, which is close to <strong>the</strong> average<br />
deployment period.<br />
TDW (mg m -2 d -1 )<br />
250<br />
200<br />
150<br />
100<br />
Jan Feb Mar Apr May Jun Jul Aug Sep Oct Nov Dec<br />
Material took ~8 to 24 days to sink<br />
2800 m, for sinking rates of about<br />
100 to 400 m d -1 .<br />
The shift for CaCO 3<br />
(12 days) was<br />
less than <strong>the</strong> shift for TDW, BSi<br />
and POC (16 days). Is CaCO 3<br />
sinking faster than BSi, and is<br />
POC associated with BSi moreso<br />
than with CaCO 3<br />
<br />
Correlations (lower fig) were determined<br />
by shifting <strong>the</strong> entire <strong>time</strong> <strong>series</strong>, not <strong>the</strong><br />
seasonally averaged fluxes as implied by<br />
<strong>the</strong> upper figure.<br />
50<br />
0<br />
1000 m<br />
3800 m<br />
Jan Feb Mar Apr May Jun Jul Aug Sep Oct Nov Dec<br />
corr coefficient (r)<br />
0.82<br />
0.80<br />
0.78<br />
0.76<br />
0.74<br />
0.72<br />
0.70<br />
0 5 10 15 20<br />
shift (d)