Status and Trends 2009 - Nature Uganda
Status and Trends 2009 - Nature Uganda
Status and Trends 2009 - Nature Uganda

You also want an ePaper? Increase the reach of your titles
YUMPU automatically turns print PDFs into web optimized ePapers that Google loves.
Methods<br />
Chapter Two<br />
Data capture<br />
A simple global monitoring framework for IBAs has been<br />
designed. From this, an IBA monitoring form for Ug<strong>and</strong>a was<br />
adopted. This is a simple <strong>and</strong> easy to use form <strong>and</strong> contains<br />
guidelines on how to collect data on the three variables: State,<br />
Pressure <strong>and</strong> Response. These data collection forms are used<br />
by different institutions in monitoring. However, this is not the<br />
only means of generating data. Other data sources include<br />
newspaper stories, agricultural <strong>and</strong> forestry statistics, visitor<br />
<strong>and</strong> tourist monitoring data, management plans <strong>and</strong> bird<br />
monitoring data amongst others.<br />
Variables considered<br />
IBA Monitoring involves assessing the <strong>Status</strong> of a few indicators<br />
of state (key species or important habitats), the pressure<br />
(threats) <strong>and</strong> responses (interventions) at an IBA (Bennun,<br />
2003). Details of scoring State, Pressure <strong>and</strong> Response differ,<br />
but the resulting scales are the same; <strong>Status</strong> scores assigned<br />
on a simple 4-point scale, from 0 to 3 (BirdLife International,<br />
2006).<br />
Calculating scores for State<br />
State can be assessed basing on the population of the IBA<br />
trigger species, i.e. those species for which the site is recognised<br />
as an IBA or the habitats they use. Each species or habitat is<br />
scored independently. Using a ‘weakest link’ approach, the IBA is<br />
assigned a status score based on the species/habitat with the<br />
‘worst’ status. The IBA condition status scores are as follows: 3<br />
= good; 2 = moderate; 1 = poor; 0 = very poor.<br />
Calculating scores for Pressures<br />
Pressures or threats are assessed by scoring information on<br />
time, scope <strong>and</strong> severity. Timing refers to the particular period<br />
a threat is occurring. Scope refers to the extent of coverage or<br />
the scale of the threat while severity refers to the severity of the<br />
resultant effect of the threat. Different threats are assessed<br />
independently, <strong>and</strong> using the weakest link, the threat that poses<br />
the highest risk is used to assign the score to the whole IBA.<br />
Timing, scope <strong>and</strong> severity scores are combined to give an<br />
impact score as follows: 3 = Good; 2 = Moderate; 1 = Poor <strong>and</strong><br />
0 = Very Poor.<br />
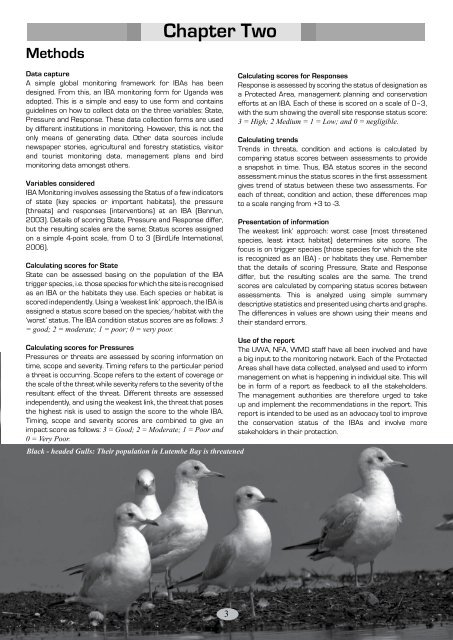
Black - headed Gulls: Their population in Lutembe Bay is threatened<br />
Calculating scores for Responses<br />
Response is assessed by scoring the status of designation as<br />
a Protected Area, management planning <strong>and</strong> conservation<br />
efforts at an IBA. Each of these is scored on a scale of 0–3,<br />
with the sum showing the overall site response status score:<br />
3 = High; 2 Medium = 1 = Low; <strong>and</strong> 0 = negligible.<br />
Calculating trends<br />
<strong>Trends</strong> in threats, condition <strong>and</strong> actions is calculated by<br />
comparing status scores between assessments to provide<br />
a snapshot in time. Thus, IBA status scores in the second<br />
assessment minus the status scores in the first assessment<br />
gives trend of status between these two assessments. For<br />
each of threat, condition <strong>and</strong> action, these differences map<br />
to a scale ranging from +3 to -3.<br />
Presentation of information<br />
The weakest link’ approach: worst case (most threatened<br />
species, least intact habitat) determines site score. The<br />
focus is on trigger species (those species for which the site<br />
is recognized as an IBA) - or habitats they use. Remember<br />
that the details of scoring Pressure, State <strong>and</strong> Response<br />
differ, but the resulting scales are the same. The trend<br />
scores are calculated by comparing status scores between<br />
assessments. This is analyzed using simple summary<br />
descriptive statistics <strong>and</strong> presented using charts <strong>and</strong> graphs.<br />
The differences in values are shown using their means <strong>and</strong><br />
their st<strong>and</strong>ard errors.<br />
Use of the report<br />
The UWA, NFA, WMD staff have all been involved <strong>and</strong> have<br />
a big input to the monitoring network. Each of the Protected<br />
Areas shall have data collected, analysed <strong>and</strong> used to inform<br />
management on what is happening in individual site. This will<br />
be in form of a report as feedback to all the stakeholders.<br />
The management authorities are therefore urged to take<br />
up <strong>and</strong> implement the recommendations in the report. This<br />
report is intended to be used as an advocacy tool to improve<br />
the conservation status of the IBAs <strong>and</strong> involve more<br />
stakeholders in their protection.