Status and Trends 2009 - Nature Uganda
Status and Trends 2009 - Nature Uganda
Status and Trends 2009 - Nature Uganda

You also want an ePaper? Increase the reach of your titles
YUMPU automatically turns print PDFs into web optimized ePapers that Google loves.
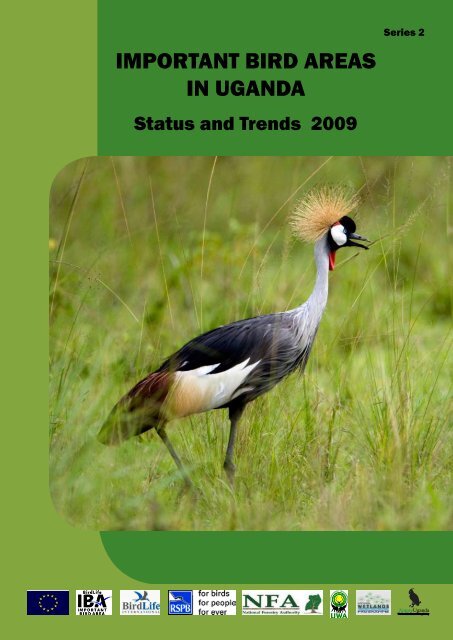
IMPORTANT BIRD AREAS<br />
IN UGANDA<br />
<strong>Status</strong> <strong>and</strong> <strong>Trends</strong> <strong>2009</strong><br />
Series 2<br />
<strong>Nature</strong>Ug<strong>and</strong>a<br />
The East Africa Natural History Society
Important Bird Areas in Ug<strong>and</strong>a<br />
<strong>Status</strong> <strong>and</strong> <strong>Trends</strong><br />
<strong>2009</strong><br />
Compiled by:<br />
Michael Opige Odull <strong>and</strong> Achilles Byaruhanga<br />
Edited by:<br />
Julius Arinaitwe<br />
Th<strong>and</strong>iwe Chikomo <strong>and</strong> George Eshiamwata<br />
Map illustrations by David Mushabe<br />
Graphic designs by Nambooze Irene<br />
January 2010
Important Bird Areas in Ug<strong>and</strong>a<br />
<strong>Status</strong> <strong>and</strong> <strong>Trends</strong><br />
<strong>2009</strong><br />
Reproduction of this publication for educational or other non commercial purposes<br />
is authorized without further written permission from the copyright holder provided<br />
the source is fully acknowledged.<br />
Production of this publication for resale or other commercial purposes is prohibited<br />
without prior written notice of the copyright holder.<br />
Citation: <strong>Nature</strong>Ug<strong>and</strong>a (2010). Important Bird Areas in Ug<strong>and</strong>a, <strong>Status</strong> <strong>and</strong> <strong>Trends</strong><br />
Report <strong>2009</strong>.<br />
Copyright<br />
© <strong>Nature</strong>Ug<strong>and</strong>a – The East Africa Natural History Society<br />
Published by <strong>Nature</strong>Ug<strong>and</strong>a<br />
P.O.Box 27034,<br />
Kampala Ug<strong>and</strong>a<br />
Plot 83 Tufnel Drive<br />
Kamwokya.<br />
Email nature@natureug<strong>and</strong>a.org<br />
Website: www.natureug<strong>and</strong>a.org<br />
DISCLAIMER<br />
This status report has been produced with financial assistance of the European<br />
Union (EuropeAid/ENV/2007/132-278. The contents of this document are the<br />
sole responsibility of Birdlife International <strong>and</strong> can under no normal circumstances<br />
be regarded as reflecting the position of the European Union.<br />
ii
Contents<br />
Acknowledgements ................................................................................................ iv<br />
Executive Summary ................................................................................................. v<br />
List of Acronyms ........................................................................................................ vi<br />
CHAPTER ONE<br />
Introduction ................................................................................................................ 2<br />
CHAPTER TWO<br />
Methods ....................................................................................................................... 3<br />
CHAPTER THREE<br />
Results <strong>and</strong> Discussions ......................................................................................... 4<br />
CHAPTER FOUR<br />
Major Conclusions .................................................................................................... 14<br />
CHAPTER FIVE<br />
Major Recommendations ...................................................................................... 15<br />
APPENDICES<br />
List of Threats ............................................................................................................. 18<br />
IBA Monitoring form ................................................................................................ 20<br />
List of Contributors .................................................................................................. 24<br />
Further Reading ........................................................................................................ 25<br />
iii
Acknowledgments<br />
The production of this status <strong>and</strong> trend report is made possible with funding from the<br />
European Commission through the Royal Society for the Protection of Birds (RSPB)<br />
for which we are grateful. The experiences gained from other BirdLife Partners that<br />
are involved in similar programs have been of immense assistance. Technical support<br />
from both RSPB <strong>and</strong> BirdLife Africa Partnership Secretariat (BLAPS) is highly appreciated.<br />
We owe a lot to UWA especially the Research <strong>and</strong> Monitoring Unit. The staff of NFA <strong>and</strong><br />
WMD were very helpful in providing data for Forest Reserves <strong>and</strong> Wetl<strong>and</strong>s respectively. We<br />
are thankful to all the research <strong>and</strong> monitoring sections of the respective protected areas, the<br />
forest supervisors of the Forest Reserves monitored <strong>and</strong> wetl<strong>and</strong>s officers of the wetl<strong>and</strong>s/<br />
Ramsar sites whose data were submitted. This kind of collaboration will make monitoring<br />
quite cheap <strong>and</strong> effective in the long run.<br />
We recognize the contribution of all project offices <strong>and</strong> staff of <strong>Nature</strong>Ug<strong>and</strong>a: Bushenyi,<br />
Masaka, Rakai <strong>and</strong> Kabale for the provision reports <strong>and</strong> other documents that were helpful<br />
in the production of this report. The AfWC teams for the provision of data for wetl<strong>and</strong> IBAs.<br />
And lastly but not least, our sincere gratitude go to all those who submitted data <strong>and</strong> made<br />
deliberate efforts to make the data reach <strong>Nature</strong>Ug<strong>and</strong>a contact points. We very much<br />
appreciate your tremendous input.<br />
iv
Executive summary<br />
The four institutions alongside <strong>Nature</strong>Ug<strong>and</strong>a that are helping in monitoring IBAs are Ug<strong>and</strong>a Wildlife<br />
Authority (UWA), National Forest Authority (NFA), Wetl<strong>and</strong>s Management Department (WMD) <strong>and</strong><br />
National Biodiversity Data Bank (NBDB). These institutions help in management, monitoring <strong>and</strong><br />
research through various departments. The units involved in information management <strong>and</strong> community<br />
conservation are extremely vital to the processes of IBA monitoring. The community conservation programmes<br />
comprise revenue sharing projects, resource utilization, community tourism, conservation education <strong>and</strong><br />
creation of institutional linkages.<br />
These institutions have accepted to apply the global monitoring framework for IBAs which was customised for<br />
Ug<strong>and</strong>a. UWA is applying this for the second year while NFA <strong>and</strong> WMD have been just introduced to the model.<br />
However this simple data capturing format summarizes the variables as State, Pressure <strong>and</strong> Response which<br />
all contribute to the resultant trend analyses.<br />
The year 2001 is used as a baseline for which data is available. It should also be noted that although data for<br />
the 30 IBAs were available then, the 2008 analyses took care of only 22 IBAs <strong>and</strong> an additional two that were<br />
added later onto the list, making a total of 24 IBAs whose data were analyzed. Now in <strong>2009</strong>, 31 of the total 33<br />
IBAs have been included here in the analyses. The general trend has been maintained at just above moderate<br />
conditions. Interestingly the conditions showed a general slight decline from 2001 to 2008 confirmed by decline<br />
from 2.37±0.14 to 2.12±0.11 (Mean±SEM) when the analyses were done. This has however started to show<br />
an improvement of 2.19±0.12 (Mean±SEM). It should be noted that even with this improvement, the combined<br />
analyses do not reach the baseline level yet.<br />
The general trend of pressure in all IBAs have been rising steadily with a mean score of -1.2±0.15 in 2008 <strong>and</strong><br />
this has improved in <strong>2009</strong> with a mean score of -0.84±0.15 (Mean±SEM). The pressures in all IBAs if possible<br />
should be reduced to zero. It should be understood clearly that the trends are well explained over longer periods<br />
of time. This therefore means that the drop in pressures in <strong>2009</strong> should be taken with caution since a near<br />
future assessment may reflect a different scenario. However, <strong>2009</strong> assessment does reflect an improvement.<br />
The overall trend in responses is impressive however there are some IBAs that still do not have management<br />
plans (e.g. Doho Rice Scheme, Lake Opeta, Lake Nakuwa <strong>and</strong> Lutoboka Point) <strong>and</strong> some are now out of date (e.g.<br />
Lutembe Bay <strong>and</strong> Nabajjuzi Swamp). The sites are all at different levels of implementing conservation activities.<br />
In 2008, the overall conservation processes in all the IBAs registered significant progress with 2.36±0.17 <strong>and</strong> a<br />
slight decline in <strong>2009</strong> with score of 2.26 ±0.13 (Mean±SEM). This is still good since the score is above average.<br />
A lot more work is therefore still needed to reduce the threats status further such that the conditions <strong>and</strong> quality<br />
of the habitats are favourable to the biodiversity within them.<br />
The status of National Parks <strong>and</strong> Wildlife Reserves remained more or less similar up to 2008 <strong>and</strong> a slight<br />
improvement in <strong>2009</strong>. The condition of Forest Reserves has continued to have a steady decline through the<br />
years (2001, 2008 <strong>and</strong> <strong>2009</strong> have all registered declines. The conditions of the wetl<strong>and</strong> IBAs also have declined<br />
through the years except for a slight improvement in <strong>2009</strong>.<br />
Threats in National Parks/ Wildlife Reserves have for a long time been maintained at medium till 2008 <strong>and</strong><br />
this dropped in <strong>2009</strong>. Forest Reserves are below medium <strong>and</strong> with the gentlest rise of the three classes. This<br />
means that, in terms of effect, the Forest Reserves are still experiencing relatively minimal threats when spread<br />
throughout the sites. Threats in wetl<strong>and</strong> IBAs are the most important of the three in terms of conservation<br />
action. This is because the mean scores for wetl<strong>and</strong> threats rate highest <strong>and</strong> above the medium point <strong>and</strong> so<br />
efforts to improve the situation are needed.<br />
Response trends in National Parks <strong>and</strong> Wildlife Reserves are the most encouraging of the three management<br />
categories. This is because all the PAs have some level of protection <strong>and</strong> with significant levels conservation<br />
activities. Forest Reserves follow a similar scenario as PAs in <strong>2009</strong>. This means that, in terms of conservation<br />
activities, protection status <strong>and</strong> management planning, the Forest Reserves are rated second to National Parks<br />
<strong>and</strong> better than the IBAs in the wetl<strong>and</strong> habitats. Responses levels (conservation efforts) in wetl<strong>and</strong> IBAs are still<br />
low. This registered tremendous change by 2006 when many sites were designated as Ramsar sites.
List of acronyms<br />
IBA<br />
UWA<br />
NEMA<br />
NFA<br />
WMD<br />
NBDB<br />
NGO<br />
KBA<br />
EBA<br />
RSPB<br />
SSG<br />
CBD<br />
CBO<br />
CFM<br />
GEF<br />
IUCN<br />
NU<br />
WCS<br />
CARE<br />
WWF<br />
AfWC<br />
NP<br />
WR<br />
NF<br />
UF<br />
ITFC<br />
IGCP<br />
CTPH<br />
MUBFS<br />
MUIENR<br />
FACE<br />
LVCEEP<br />
FD<br />
CITES<br />
FID<br />
NWP<br />
DFS<br />
WD<br />
NEA<br />
WID<br />
FFNC<br />
WARM<br />
PSPs<br />
MIST<br />
PA<br />
Important Bird Area<br />
Ug<strong>and</strong>a Wildlife Authority<br />
National Environment Management Authority<br />
National Forest Authority<br />
Wetl<strong>and</strong>s Management Department<br />
National Biodiversity Data Bank<br />
Non Governmental Organization<br />
Key Biodiversity Area<br />
Endemic Bird Area<br />
Royal Society for the Protection of Birds<br />
Site Support Groups<br />
Convention on Biological Diversity<br />
Community Based Organization<br />
Collaborative Forest Management<br />
Global Environment Facility<br />
International Union for the Conservation of <strong>Nature</strong><br />
<strong>Nature</strong>Ug<strong>and</strong>a<br />
Wildlife Conservation Society<br />
CARE International<br />
Worldwide Fund for <strong>Nature</strong><br />
African Waterfowl Census<br />
National Park<br />
Wildlife Reserve<br />
Near Favourable<br />
Un-favourable<br />
International Tropical Forest Conservation<br />
International Gorilla Conservation Program<br />
Conservation through Public Health<br />
Makerere University Biological Field Station<br />
Makerere University Institute of Env’t <strong>and</strong> Natural Resources<br />
FACE Foundation<br />
Lake Victoria Catchments Environmental Education Program<br />
Forest Department<br />
Convention on International Trade on Endangered Species<br />
Forest Inspection Division<br />
National Wetl<strong>and</strong>s Conservation <strong>and</strong> Management Programme<br />
District Forest Services<br />
Wetl<strong>and</strong>s Department<br />
National Environment Act<br />
Wetl<strong>and</strong>s Inspection Division<br />
Faculty of Forestry <strong>and</strong> <strong>Nature</strong> Conservation<br />
Wildlife <strong>and</strong> Animal Resources Management<br />
Permanent Sample Plots<br />
Management Information SysTems<br />
Protected Area<br />
vi
Chapter one<br />
Introduction<br />
The concept of using Important Bird Areas to protect<br />
biodiversity is not new in Ug<strong>and</strong>a. It is over 15 years since<br />
the programme was initiated in the country. The programme<br />
identified 30 IBAs (now 33) <strong>and</strong> produced a directory,<br />
advocated for better policies, initiated conservation <strong>and</strong><br />
livelihood improvement programmes <strong>and</strong> raised the profile of<br />
ten wetl<strong>and</strong>s that are IBAs into Ramsar sites. These are just<br />
a few of the many things that came with the IBA concept <strong>and</strong><br />
biodiversity conservation. To realize these, <strong>Nature</strong>Ug<strong>and</strong>a<br />
involved a number of stakeholders that included government<br />
departments [(Ug<strong>and</strong>a Wildlife Authority (UWA), National<br />
Forest Authority (NFA), <strong>and</strong> Wetl<strong>and</strong>s Management<br />
Department (WMD) etc], various Non Governmental<br />
Organizations (NGOs), research institutions <strong>and</strong> local<br />
communities. In short, the IBA concept is not strange in the<br />
conservation world <strong>and</strong> it is widely accepted <strong>and</strong> supported.<br />
In Africa, there are over 1230 IBAs <strong>and</strong> over 10,000 world<br />
wide.<br />
What are Important Bird Areas (IBAs)<br />
IBAs are sites of global conservation importance identified<br />
using birds to locate key sites for conservation across the<br />
globe. They are practical tools for conservation. IBAs are<br />
identified using st<strong>and</strong>ard internationally agreed criteria, which<br />
are; objective, quantitative <strong>and</strong> scientifically defensible. They<br />
must however, be large enough to support self-sustaining<br />
populations of those species for which they are important.<br />
Why is monitoring <strong>and</strong> status <strong>and</strong> trends report IBA<br />
important<br />
Locally <strong>and</strong> nationally, this is done to detect <strong>and</strong> act on threats<br />
in good time. Assess the effectiveness of conservation efforts<br />
<strong>and</strong> provide information on biodiversity trends. The monitoring<br />
programmes have schedules but annual IBA monitoring<br />
is the target. To ensure that biodiversity <strong>and</strong> its habitats<br />
are conserved in a good way, we need to monitor these<br />
habitats <strong>and</strong> provide information that will guide management<br />
decisions.<br />
Levels of monitoring<br />
The basic level of monitoring takes the form <strong>and</strong> advantage of<br />
low-level <strong>and</strong> low-cost opportunities. This seeks to involve local<br />
communities in data collection. This simple nature allows<br />
sharing of responsibilities <strong>and</strong> encouraging data collection<br />
skills development.<br />
The detailed level of monitoring aims to deliver deeper analyses.<br />
Considering the robust nature, this may target only specific<br />
sites with serious threats <strong>and</strong> it is very much dependant on<br />
available funding. A range of variables may be monitored <strong>and</strong><br />
these need not be the same. Based on this analysis, the twotier<br />
IBA monitoring framework was developed.<br />
The SPR model<br />
Aims of the IBA Programme<br />
The function of the IBA programme is to identify <strong>and</strong> protect a<br />
network of sites, at a scale large enough to ensure long term<br />
survival of naturally occurring bird populations. It is meant to<br />
cover the range of those bird species for which a site-based<br />
approach is appropriate. The IBA process has been used to<br />
build institutional capacity <strong>and</strong> set an effective conservation<br />
agenda without much technical research exercise.<br />
Pressure<br />
Threats<br />
State<br />
Condition<br />
Response<br />
Conservation effort<br />
Introduction to IBA monitoring framework<br />
The framework introduces on top of identifying IBAs, the<br />
aspects of monitoring <strong>and</strong> protecting a network of these<br />
critical sites for the world’s birds. Monitoring here is used<br />
to mean the continual collection of information overtime, in<br />
order to detect changes in one or more variables <strong>and</strong> this is<br />
sequentially done in five questions for it to be successful.<br />
• Why monitor<br />
• What should we monitor<br />
• How should we monitor<br />
• Who should monitor<br />
• What happens next<br />
Fig. 1 Diagrammatic relationship in SPR monitoring model<br />
Mode of operation<br />
A simple global monitoring framework for IBAs has been<br />
designed. An IBA monitoring form for Ug<strong>and</strong>a has been<br />
adopted from this framework. This is a simple <strong>and</strong> easy to<br />
use form designed with an annex of instructions or guidelines.<br />
The variables have been often referred to as State, Pressure<br />
<strong>and</strong> Response making it simply be called “the SPR model”.<br />
The three variables (SPR) complement each other <strong>and</strong> all<br />
contribute to the resultant trend analyses.<br />
All these questions are important, but the first <strong>and</strong> last<br />
generally receive far less attention than the others. Overall,<br />
the reason for monitoring IBAs is clear. We need to<br />
underst<strong>and</strong> what is happening to them in order to adapt our<br />
interventions accordingly. To be effective, all information from<br />
the monitoring schemes should be integrated. There are<br />
many ways to categorize indicators, but the SPR framework<br />
has been widely adopted.<br />
<br />
State or status means the condition of the IBA. The status<br />
of the IBAs can be assessed in two ways. The first way is by<br />
obtaining the population of the trigger species <strong>and</strong> relating to<br />
the habitat. And the second way is by using habitat as proxy<br />
as long as one has sound basis for using habitat. The most<br />
important to know is the relationship between habitat area<br />
<strong>and</strong> quality <strong>and</strong> bird numbers.
Pressures on the IBAs refer to threats that the conservation<br />
area face. The IBA monitoring framework <strong>and</strong> the IBA<br />
monitoring form designed for Ug<strong>and</strong>a both emphasize scoring<br />
three attributes for pressure. For pressure variable to be fully<br />
captured, information on time, scope <strong>and</strong> severity are required.<br />
The timing simply refers to the particular instant or period a<br />
threat is occurring. The scope refers to the extent of coverage<br />
or the scale of the threat while severity refers to the extent of<br />
the resultant effect of the threat.<br />
Response refers to conservation efforts that are being taken<br />
to either reduce the threats or improve on the condition of<br />
the IBAs. These come in the form of different specific actions<br />
stipulated to address specific bottlenecks. These can range<br />
from research programmes, livelihood improvement initiatives<br />
to community support to conservation <strong>and</strong> out <strong>and</strong> out<br />
conservation projects.<br />
Parallel monitoring Programmes<br />
This SPR model does not necessarily work on its own. There<br />
are many monitoring techniques available that compliment the<br />
deliverables of the SPR model in Ug<strong>and</strong>a. For example, the data<br />
generated from the AfWC is very helpful in determining the<br />
status of an IBA, the illegal incidences generated by MIST is<br />
helpful in knowing threat scores <strong>and</strong> so is wetl<strong>and</strong>s inspection<br />
<strong>and</strong> monitoring.<br />
Ranger Based Data Collection or Monitoring<br />
This is the collection of data on wildlife <strong>and</strong> human activities by<br />
rangers on patrol. The basic tools used are patrol data sheet,<br />
GPS <strong>and</strong> a compass. There are many advantages of this method<br />
which include: cheap to collect data because staff are already<br />
on site, can cover the whole protected area relatively easily <strong>and</strong><br />
rangers know the place <strong>and</strong> have a good idea about what is<br />
happening where. It is therefore necessary to manage ranger<br />
patrols by planning patrol routes, monitoring performance<br />
<strong>and</strong> evaluating patrol effectiveness. Management<br />
Information SysTem (MIST) is a custom-made, easy to use,<br />
flexible programme developed to improve management<br />
efficiency <strong>and</strong> effectiveness. It is for provision of up-todate<br />
information needed for planning, monitoring <strong>and</strong><br />
evaluation.<br />
Permanent Sample Plots (PSPs) monitoring<br />
Much of the knowledge on forest development is gained<br />
from focused research on resources. PSPs are means of<br />
obtaining such knowledge on growth <strong>and</strong> eventual yields.<br />
The major objectives for establishment of PSPs include:<br />
providing forest growth <strong>and</strong> yield information for efficient<br />
management of the forest <strong>and</strong> estimating the potential<br />
productivity of the site. PSPs also aim to quantify the<br />
effects of silvicultural treatment on growth <strong>and</strong> yield <strong>and</strong><br />
provide data on the effect of management of st<strong>and</strong>s on<br />
physical, chemical <strong>and</strong> biological properties of the site. The<br />
functioning of this method is well described in the forestry<br />
sector inventories literature.<br />
Wetl<strong>and</strong>s ecological monitoring<br />
This occurs at both local <strong>and</strong> national levels. It attempts to<br />
map l<strong>and</strong> cover through satellite images <strong>and</strong> photographs<br />
to detect change. Digital images or photographs are<br />
interpreted <strong>and</strong> processed into l<strong>and</strong> cover maps <strong>and</strong> then<br />
compared to detect change in either size or l<strong>and</strong> use.<br />
However, this is expensive since it requires expertise <strong>and</strong><br />
time. At district level inventory reports produced are used<br />
for detecting change at systems level. It involves parameters<br />
such as flora, fauna <strong>and</strong> water quality. At local level, visits<br />
are conducted to sites following reports from informants,<br />
sub-counties or districts about encroachment<br />
White-faced Whistling Duck: A target for consumption- Lake Bisina
Methods<br />
Chapter Two<br />
Data capture<br />
A simple global monitoring framework for IBAs has been<br />
designed. From this, an IBA monitoring form for Ug<strong>and</strong>a was<br />
adopted. This is a simple <strong>and</strong> easy to use form <strong>and</strong> contains<br />
guidelines on how to collect data on the three variables: State,<br />
Pressure <strong>and</strong> Response. These data collection forms are used<br />
by different institutions in monitoring. However, this is not the<br />
only means of generating data. Other data sources include<br />
newspaper stories, agricultural <strong>and</strong> forestry statistics, visitor<br />
<strong>and</strong> tourist monitoring data, management plans <strong>and</strong> bird<br />
monitoring data amongst others.<br />
Variables considered<br />
IBA Monitoring involves assessing the <strong>Status</strong> of a few indicators<br />
of state (key species or important habitats), the pressure<br />
(threats) <strong>and</strong> responses (interventions) at an IBA (Bennun,<br />
2003). Details of scoring State, Pressure <strong>and</strong> Response differ,<br />
but the resulting scales are the same; <strong>Status</strong> scores assigned<br />
on a simple 4-point scale, from 0 to 3 (BirdLife International,<br />
2006).<br />
Calculating scores for State<br />
State can be assessed basing on the population of the IBA<br />
trigger species, i.e. those species for which the site is recognised<br />
as an IBA or the habitats they use. Each species or habitat is<br />
scored independently. Using a ‘weakest link’ approach, the IBA is<br />
assigned a status score based on the species/habitat with the<br />
‘worst’ status. The IBA condition status scores are as follows: 3<br />
= good; 2 = moderate; 1 = poor; 0 = very poor.<br />
Calculating scores for Pressures<br />
Pressures or threats are assessed by scoring information on<br />
time, scope <strong>and</strong> severity. Timing refers to the particular period<br />
a threat is occurring. Scope refers to the extent of coverage or<br />
the scale of the threat while severity refers to the severity of the<br />
resultant effect of the threat. Different threats are assessed<br />
independently, <strong>and</strong> using the weakest link, the threat that poses<br />
the highest risk is used to assign the score to the whole IBA.<br />
Timing, scope <strong>and</strong> severity scores are combined to give an<br />
impact score as follows: 3 = Good; 2 = Moderate; 1 = Poor <strong>and</strong><br />
0 = Very Poor.<br />
Black - headed Gulls: Their population in Lutembe Bay is threatened<br />
Calculating scores for Responses<br />
Response is assessed by scoring the status of designation as<br />
a Protected Area, management planning <strong>and</strong> conservation<br />
efforts at an IBA. Each of these is scored on a scale of 0–3,<br />
with the sum showing the overall site response status score:<br />
3 = High; 2 Medium = 1 = Low; <strong>and</strong> 0 = negligible.<br />
Calculating trends<br />
<strong>Trends</strong> in threats, condition <strong>and</strong> actions is calculated by<br />
comparing status scores between assessments to provide<br />
a snapshot in time. Thus, IBA status scores in the second<br />
assessment minus the status scores in the first assessment<br />
gives trend of status between these two assessments. For<br />
each of threat, condition <strong>and</strong> action, these differences map<br />
to a scale ranging from +3 to -3.<br />
Presentation of information<br />
The weakest link’ approach: worst case (most threatened<br />
species, least intact habitat) determines site score. The<br />
focus is on trigger species (those species for which the site<br />
is recognized as an IBA) - or habitats they use. Remember<br />
that the details of scoring Pressure, State <strong>and</strong> Response<br />
differ, but the resulting scales are the same. The trend<br />
scores are calculated by comparing status scores between<br />
assessments. This is analyzed using simple summary<br />
descriptive statistics <strong>and</strong> presented using charts <strong>and</strong> graphs.<br />
The differences in values are shown using their means <strong>and</strong><br />
their st<strong>and</strong>ard errors.<br />
Use of the report<br />
The UWA, NFA, WMD staff have all been involved <strong>and</strong> have<br />
a big input to the monitoring network. Each of the Protected<br />
Areas shall have data collected, analysed <strong>and</strong> used to inform<br />
management on what is happening in individual site. This will<br />
be in form of a report as feedback to all the stakeholders.<br />
The management authorities are therefore urged to take<br />
up <strong>and</strong> implement the recommendations in the report. This<br />
report is intended to be used as an advocacy tool to improve<br />
the conservation status of the IBAs <strong>and</strong> involve more<br />
stakeholders in their protection.
Results <strong>and</strong> discussions<br />
Chapter Three<br />
30<br />
22 23<br />
21<br />
29<br />
20<br />
19<br />
26 27<br />
28<br />
33<br />
10<br />
24<br />
9<br />
12<br />
5 6<br />
17 18<br />
7<br />
8<br />
31<br />
15<br />
32<br />
14<br />
11<br />
16<br />
13<br />
4<br />
1. Mgahinga Gorilla National Park<br />
2. Echuya Forest Reserve<br />
3. Nyamuriro Swamp<br />
4. Bwindi Impenetrable National Park<br />
5. Rwenzori Mountains National Park<br />
6. Kibale Forest National Park<br />
7. Queen Elizabeth National Park<br />
8. Kyambura Wildlife Reserve<br />
9. Semliki National Park<br />
10. Semliki Wildlife Reserve<br />
11. Lake Mburo National Park<br />
12. Mabira Forest Reserve<br />
13. Sango Bay Area<br />
14. Musambwa Isl<strong>and</strong>s<br />
15. Lutoboka point<br />
16 Nabugabo wetl<strong>and</strong><br />
17. Mabamba Bay<br />
18. Lutembe Bay<br />
19. Budongo Forest Reserve<br />
20. Muchison Falls National Park<br />
21. Ajai Wildlife Reserve<br />
22. Mt Kei Forest Reserve<br />
23. Mt Otzi Forest Reserve<br />
24. Doho Rice Scheme<br />
25. Lake Nakuwa<br />
26. Lake Bisina<br />
27. Lake Opeta<br />
28. Mt Elgon National Park<br />
29. Mt Moroto Forest Reserve<br />
30. Kidepo Valley National Park<br />
31. Nabajjuzi Wetl<strong>and</strong><br />
32. Kashoya-Kitomi Forest Resrve<br />
33. Bugoma Forest Reserve<br />
2<br />
1<br />
3<br />
Fig. 2 Location map of Important Bird Areas in Ug<strong>and</strong>a<br />
IBA Code Name of IBA <strong>Status</strong> IBA code Name of IBA <strong>Status</strong><br />
UG001 Mgahinga Gorilla Stable UG018 Lutembe Bay Small decline<br />
NP<br />
UG002 Echuya FR Small decline UG019 Budongo FR Small decline<br />
UG003 Nyamuriro Unchanged (UF) UG020 Murchison Falls Unchanged (NF)<br />
NP<br />
UG004 Bwindi<br />
Stable UG021 Ajai WR Unchanged (NF)<br />
Impenetrable NP<br />
UG005 Rwenzori Stable UG022 Mount Kei FR Small decline<br />
Mountains NP<br />
UG006 Kibale NP Unchanged (NF) UG023 Mount Otzi FR Small decline<br />
UG007 Queen Elizabeth Unchanged (NF) UG024 Doho Rice Unchanged (NF)<br />
NP<br />
scheme<br />
UG008 Kyambura WR Small<br />
UG025 Lake Nakuwa Not assessed<br />
improvement<br />
UG009 Semliki NP Unchanged (NF) UG026 Lake Bisina Small<br />
improvement<br />
UG010 Semliki Reserves Unchanged (UF) UG027 Lake Opeta Unchanged (NF)<br />
UG011 Lake Mburo NP Unchanged (NF) UG028 Mount Elgon NP Unchanged (NF)<br />
UG012 Mabira FR Unchanged (NF) UG029 Mount Moroto Small decline<br />
FR<br />
UG013 Sango Bay Area Stable UG030 Kidepo Valley Unchanged (NF)<br />
NP<br />
UG014 Musambwa<br />
Isl<strong>and</strong>s<br />
Stable UG031 Nabajjuzi<br />
Wetl<strong>and</strong><br />
Small<br />
improvement<br />
UG015 Lutoboka Point Not assessed UG032 Kasyoha – Unchanged (NF)<br />
Kitomi FR<br />
UG016 Nabugabo<br />
Wetl<strong>and</strong><br />
Small decline UG033 Bugoma CFR Small<br />
improvement<br />
UG017 Mabamba Bay Stable<br />
Table 1 Summary of status of individual IBAs 2008 – <strong>2009</strong> assessment
[A] <strong>Status</strong> <strong>and</strong> trends of conditions <strong>2009</strong><br />
Monitored IBAs in Ug<strong>and</strong>a <strong>and</strong> their location<br />
There are now 33 IBAs in Ug<strong>and</strong>a (Fig 2). Monitoring is<br />
being done with the help of the three main government<br />
departments in addition to <strong>Nature</strong>Ug<strong>and</strong>a’s monitoring<br />
programmes. UWA staff are monitoring 10 National Parks<br />
<strong>and</strong> 3 Wildlife Reserves, NFA staff are monitoring the 7 main<br />
Central Forest Reserves while WMD monitors wetl<strong>and</strong> IBAs/<br />
Ramsar sites. There are four Ramsar sites that are either<br />
wholly or partly in national parks. These sites are therefore<br />
jointly monitored by the two authorities.<br />
Summary of status of individual IBAs 2008 – <strong>2009</strong><br />
assessment<br />
The categories Favourable, Near Favourable, Un-favourable<br />
<strong>and</strong> Very Un-favourable describe IBA conditions signifying<br />
good, moderate fair <strong>and</strong> poor conditions respectively. When<br />
an IBA condition changes from one category to the next <strong>and</strong><br />
depending on the direction, it shows either improvement<br />
or decline <strong>and</strong> sometimes it maintains its status quo. In<br />
<strong>2009</strong>, 31 of the 33 IBAs were assessed. Table 1 shows the<br />
summaries with six IBAs in stable (good) conditions, seven<br />
had small declines, four had small improvements <strong>and</strong> two<br />
were in poor condition while 12 IBAs maintained moderate<br />
conditions when compared with 2008 assessments. Two<br />
IBAs (Lutoboka point <strong>and</strong> Lake Nakuwa) were not assessed<br />
in <strong>2009</strong>.<br />
<strong>Status</strong> categories of IBAs compared (2001 – <strong>2009</strong>)<br />
The IBAs generally seem to have been in good (Favourable)<br />
conditions than they are now. However, 2008 had 72%<br />
of the assessed IBAs in moderate conditions, while <strong>2009</strong><br />
presents 55% under this category. This is a good indication<br />
since the numbers of IBAs that are in favourable condition<br />
have gone up from 20% in 2008 to 32% in <strong>2009</strong>. This is<br />
however still less than the 55% in 2001. A ‘not so good’<br />
trend is also being seen in IBAs in poor conditions (Unfavourable)<br />
changing from 17% in 2001 to 8% in 2008 <strong>and</strong><br />
now 13% in <strong>2009</strong>. This means that a lot more pressures<br />
are coming up or appropriate interventions are not being<br />
made. Note that two IBAs, one wetl<strong>and</strong> <strong>and</strong> the other a<br />
Forest Reserve are not included in this year’s assessment. A<br />
lot more conservation interventions should target such IBAs<br />
with poor conditions for example Semliki Wildlife Reserve,<br />
Lutembe Bay <strong>and</strong> Nyamuriro Swamp while also not ignoring<br />
sites that are in moderate state because they too need<br />
some level of attention. Such IBAs include Murchison Falls<br />
NP, Kidepo Valley NP, Queen Elizabeth NP <strong>and</strong> others as<br />
shown in table 1 above. The comparisons of the categories<br />
between the years are as shown in fig 3 below.<br />
Percentage<br />
100%<br />
80%<br />
60%<br />
40%<br />
20%<br />
0%<br />
<strong>Status</strong> categories compared 2001 - <strong>2009</strong><br />
2001 2008 <strong>2009</strong><br />
Year<br />
favourable<br />
Near favourable<br />
Unfavourable<br />
Fig 3. Comparison of status categories 2001, 2008 <strong>and</strong> <strong>2009</strong><br />
<br />
Condition or state of IBAs<br />
(a) <strong>Status</strong> trends for all IBAs combined<br />
The year 2001 is being used as a baseline for which data is<br />
available. It should also be noted that although data for the 30<br />
IBAs were available, the 2008 analyses took care of only 22<br />
IBAs <strong>and</strong> an additional two that were added later onto the list,<br />
making a total of 24 IBAs whose data were analyzed. Now in<br />
<strong>2009</strong>, 31 of the total 33 IBAs have been included here in the<br />
analyses. The general trend has been maintained just above<br />
moderate conditions. Interestingly, the conditions showed<br />
general decline from 2001 to 2008 showing a drop from<br />
2.37±0.14 to 2.12±0.11 (Mean±SEM). This has however<br />
started to show an improvement of 2.19±0.12 (Mean±SEM).<br />
It should be noted that even with this improvement, the<br />
combined analyses does not reach the baseline level yet.<br />
Poor Moderate Good<br />
3<br />
2<br />
1<br />
0<br />
State trends of IBAs in <strong>2009</strong><br />
2000 2002 2004 2006 2008 2010<br />
Year<br />
Fig 4 State trends of all IBAs combined<br />
All IBAs<br />
(b) <strong>Status</strong> trends of IBAs in three management/habitat<br />
categories<br />
Sometimes it is not true that the general trend is the same<br />
across various habitat types <strong>and</strong> protected areas categories.<br />
Here attempts have been made to class the IBAs into three<br />
management categories namely National Parks <strong>and</strong> Wildlife<br />
Reserves (IUCN protection category II ), Forested IBAs<br />
(National protection status) <strong>and</strong> Wetl<strong>and</strong> IBAs (Ramsar sites/<br />
no protection). This has shown interesting results as below:<br />
(i) All the three categories (protected, forested <strong>and</strong> wetl<strong>and</strong>s)<br />
fall just above moderate conditions but with varying trends.<br />
This means that the different habitat types are being faced<br />
with varying level of threats <strong>and</strong> challenges; a trend which may<br />
reflect the level of commitments if they are to be improved.<br />
(ii) The condition of National Parks <strong>and</strong> Wildlife Reserves<br />
remained more or less similar for the 2001 to 2008 analyses<br />
with mean scores of 2.08±0.24 <strong>and</strong> 20.8±0.14 (Mean±SEM,<br />
n=13) <strong>and</strong> with a slight improvement in <strong>2009</strong> of 2.23±0.17<br />
(Mean±SEM, n=13). This therefore shows a positive trend<br />
when considered individually.<br />
(iii) The condition of forest Reserves has continued to have a<br />
steady decline through the years. Taking 2001 as the baseline,<br />
2008 <strong>and</strong> <strong>2009</strong> have all registered declines of mean scores<br />
of 2.63±0.18, 2.25±0.25 <strong>and</strong> 2.11±0.2 (Mean±SEM,<br />
n=9)respectively. This is however exhibiting a much gentler<br />
decline as compared to the wetl<strong>and</strong>s.
(iv) The conditions of the wetl<strong>and</strong> IBAs also have declined<br />
through the years except for a slight improvement in <strong>2009</strong>.<br />
The mean scores representing this are 2.6±0.22, 2.13±0.23<br />
<strong>and</strong> 2.3±0.26 (Mean±SEM, n=10) for 2001, 2008 <strong>and</strong> <strong>2009</strong><br />
respectively.<br />
The trends may reflect the different management regimes<br />
that are employed by the respective management authorities.<br />
Protected Areas have both national <strong>and</strong> international protection<br />
status probably requiring strict methods. Forest Reserves<br />
have national protection status but with limited management<br />
authority staff on ground. This is worse for wetl<strong>and</strong>s that are<br />
only recognized as important sites (Ramsar) <strong>and</strong> with even<br />
more limited staff on ground<br />
Fig 5 <strong>Status</strong> trends in National Parks, Forest Reserves <strong>and</strong><br />
Wetl<strong>and</strong> IBAs<br />
(c) Some site specific trend analyses of species of<br />
interest<br />
Bird hunting <strong>and</strong> its effect on population of target species<br />
For some time, there have been reports on certain species<br />
(e.g. ducks <strong>and</strong> storks) being trapped in Lake Bisina. The<br />
mode of hunting/capturing varies. For example, the African<br />
Open-billed Storks are poisoned by some members of the<br />
community. Although there are no real statistics on the<br />
number of birds being trapped or killed, substantial numbers<br />
have occasionally been reported by witnesses. This may<br />
eventually reflect on the status of the bird’s population. At<br />
least in the last ten years, the effect of this is not reflected on<br />
the population if the census numbers are to be considered.<br />
However, further research is needed to determine the<br />
impact on species demographic trends. Figure 6 <strong>and</strong> 7 below<br />
show population trends of the White-faced Whistling Duck in<br />
Lake Bisina <strong>and</strong> the African Open-billed Stork in Doho Rice<br />
Scheme. The species counts for Ducks show that population<br />
seems to have doubled in recent counts while the Storks<br />
population has remained stable over the last ten years. For<br />
now, the consumptive utilization seems to be having little<br />
effect on the population as shown by the two cases.<br />
Number<br />
200<br />
100<br />
0<br />
White-faced Whistling Duck in Lake Bisina<br />
1999 2004 2007 2008 <strong>2009</strong><br />
Year<br />
Fig. 6 White-faced Whistling Ducks in Lake Bisina<br />
<br />
Numbers<br />
2000<br />
1000<br />
0<br />
1991<br />
1992<br />
African Open-billed Storks in Doho Rice Scheme<br />
1193<br />
1994<br />
1995<br />
1996<br />
1997<br />
1998<br />
1999<br />
2000<br />
Year<br />
2001<br />
2002<br />
2003<br />
2004<br />
2005<br />
2006<br />
2007<br />
2008<br />
Fig. 7 African Open-billed Stork in Doho Rice Scheme<br />
Human activity (day time fishermen numbers) <strong>and</strong> the<br />
Grey-headed Gull population<br />
The Grey-headed Gulls in Musambwa Isl<strong>and</strong> are probably the<br />
largest breeding population in Lake Victoria region. This small<br />
rocky Isl<strong>and</strong> has for long been used by the fishermen as a<br />
jetty where they l<strong>and</strong> <strong>and</strong> some even residing in makeshift<br />
structures on the Isl<strong>and</strong>. The population of the fishermen has<br />
been growing from tens to hundreds. In <strong>2009</strong>, the fishermen<br />
numbers <strong>and</strong> the Grey-headed Gull population were monitored<br />
in the four quarters in the year to establish some indicative<br />
trends. This may need to be repeated for some time if clear<br />
correlations are to be established. The fishermen population<br />
fluctuated between 150 <strong>and</strong> 200 as shown in figure 8a below.<br />
This seems not to have direct effect on the population of the<br />
Grey-headed Gulls as shown in figure 8b. The most important<br />
thing to note here is that a threshold for the population of the<br />
fishermen not detrimental to the existing breeding birds. This<br />
needs to be ascertained such that some management <strong>and</strong><br />
control measures can be employed.<br />
Population<br />
200<br />
150<br />
100<br />
50<br />
0<br />
Day time poulation of Fishermen in Musambwa<br />
Q1 Q1 Q1 Q2 Q2 Q2 Q3 Q3 Q3 Q4 Q4 Q4<br />
Quarter<br />
Fig. 8a Day time population of the fishermen in Musambwa Isl<strong>and</strong><br />
Number<br />
100,000<br />
80,000<br />
60,000<br />
40,000<br />
20,000<br />
-<br />
Grey-headed Gull population <strong>2009</strong><br />
Q1 Q1 Q1 Q1 Q1 Q1 Q2 Q2 Q2 Q2 Q2 Q3 Q3 Q3 Q3 Q4 Q4 Q4<br />
Quarter<br />
Fig. 8b Quarterly population of the Grey-headed Gulls in<br />
Musambwa Isl<strong>and</strong><br />
Protected Areas/ Non Protected Areas species trends<br />
Waterbird population monitoring in Protected Areas have<br />
been conducted in Lake Mburo National Park (LMNP), Queen<br />
Elizabeth National Park (QENP), Murchison Falls National Park<br />
(MFNP) <strong>and</strong> Kyambura Wildlife Reserve (KWR). LMNP is<br />
interesting for resident species such as African Fish Eagles.<br />
QENP has interesting records of Palearctic migrants like<br />
Gull-billed Terns while KWR has interesting records of Black-<br />
<strong>2009</strong>
winged Stilts. The populations of Black-winged Stilts have shown a<br />
remarkable decrease in the last ten years (Fig 9). The comments<br />
from the monitoring teams always show continuous dry spells.<br />
The dry conditions have lowered the numbers from thous<strong>and</strong>s to<br />
a few hundreds as shown in figure 9. For the Palearctic migrants<br />
in QENP, the trends in the last 10 years have remained stable.<br />
Specifically, the Gull-billed Terns numbers have been about 2,500<br />
individuals except for the period between 1995 <strong>and</strong> 2000 when<br />
larger congregations were recorded (Fig 10). An even more<br />
consistent trend has been shown by Common S<strong>and</strong>piper as<br />
reflected in figure 11.<br />
Number of Gull-billed Terns<br />
2000<br />
1600<br />
1200<br />
800<br />
400<br />
0<br />
1998 2000 2002 2004 2006 2008 2010<br />
Time (yrs)<br />
Lutembe<br />
12b <strong>Trends</strong> of Gull-billed Terns in Lutembe Bay<br />
Numbers<br />
6000<br />
4000<br />
2000<br />
0<br />
Black-winged Stilts in Kyambura Wildlife Reserve<br />
2002 2003 2004 2005 2006 2007 2008 <strong>2009</strong><br />
The effect of habitat disturbance to species population can<br />
be shown by the Figs 12 a/b. Where habitat conditions<br />
are shown to be stable, like the case in Protected Areas,<br />
species also show stable populations. The African Skimmer<br />
numbers in Queen Elizabeth NP have continued to show<br />
marked increase while those for Murchison Falls NP have<br />
been more stable. However, degradation, habitat change<br />
<strong>and</strong> pollution negatively affect the numbers of species as<br />
shown by Gull-billed Terns at Lutembe bay.<br />
Year<br />
Fig. 9 Black-winged Stilts in Kyambura Wildlife Reserve.<br />
Number<br />
Gull-billed Terns in Queen Elizabeth National Park<br />
15000<br />
10000<br />
5000<br />
0<br />
1985 1990 1995 2000 2005 2010<br />
Year<br />
Fig. 10 Gull-billed Terns in Queen Elizabeth National Park<br />
Common S<strong>and</strong>piper in Queen Elizabeth National Park<br />
Number<br />
300<br />
200<br />
100<br />
0<br />
1988 1992 1996 2000 2004 2008<br />
Year<br />
Figure 11 Common S<strong>and</strong>pipers in Queen Elizabeth National Park<br />
[B] Pressures <strong>and</strong> their trends <strong>2009</strong><br />
Assessments of pressures in all IBAs<br />
The main focus of any conservation programme in dealing<br />
with the threats would be to either eliminate or reduce<br />
them to considerable minimal levels to the extent that<br />
they do not jeopardize the existence of flora <strong>and</strong> fauna.<br />
Sometimes an IBA may experience only one threat but<br />
the severity of its effect varies compared to the other<br />
one with many threats <strong>and</strong> yet low severity. But then<br />
seemingly insignificant threats can combine to cause<br />
serious cumulative effect. This therefore means that<br />
threats need to be understood with their impact on the<br />
quality of the site or habitat.<br />
The assessment of <strong>2009</strong> continued with the systematic<br />
approach of capturing pressures. This included the use of<br />
IBA monitoring forms, news paper reports <strong>and</strong> field visit<br />
experiences. These allowed for a comprehensive listing<br />
of the presence of threats specific to respective IBAs. On<br />
average, in terms of different threats each IBA recorded<br />
about seven incidences, the lowest had two (2) <strong>and</strong> the<br />
highest twelve (12). On a weighted scale, the year 2001<br />
<strong>and</strong> <strong>2009</strong> both registered three categories while 2008<br />
registered four <strong>and</strong> the fourth category (Very high) is the<br />
most undesirable. The general trend shows many threats<br />
classified as low compared to those classified as high.<br />
The <strong>2009</strong> assessment had 42% at low, 32% medium<br />
compared to 2008 of 16% <strong>and</strong> 52% respectively. The<br />
other categories are as seen in the figure 13 below<br />
Number of African Skimmers<br />
600<br />
400<br />
200<br />
0<br />
1998 2000 2002 2004 2006 2008 2010<br />
MFNP<br />
Time (yrs)<br />
Fig 12a <strong>Trends</strong> of African Skimmers in Queen Elizabeth <strong>and</strong><br />
Murchison Falls NP<br />
QENP<br />
<br />
Percentage<br />
Pressure categories compared 2001 - <strong>2009</strong><br />
100%<br />
80%<br />
60%<br />
40%<br />
20%<br />
0%<br />
2001 2008 <strong>2009</strong><br />
Year<br />
Fig 13 Assessment of threats in <strong>2009</strong><br />
Very high<br />
High<br />
Medium<br />
Low
(a) General trends of pressures<br />
The general trend of pressure in all IBAs have been rising<br />
steadily but just above the medium line with mean score<br />
of -1.2±0.15 in 2008 <strong>and</strong> this has improved in <strong>2009</strong><br />
with mean score of -0.84±0.15 (Mean±SEM) as in figure<br />
14 below. The pressures in all IBAs if possible should be<br />
reduced to zero. It should be understood clearly that the<br />
trends are well explained over longer periods of time. This<br />
therefore means that the drop in pressures in <strong>2009</strong> should<br />
be taken with caution since a near future assessment may<br />
reflect a different scenario. However, <strong>2009</strong> assessment<br />
reflects an improvement.<br />
file:///C:/Documents%0<strong>and</strong>%0Settings/Administrator/Desktop<br />
Low Medium High<br />
-3<br />
-2<br />
-1<br />
Pressure trends in IBAs in <strong>2009</strong><br />
0<br />
2000 2002 2004 2006 2008 2010<br />
Year<br />
Fig 14 Assessments of general trends of pressures<br />
All IBAs<br />
(b) Pressure trends of IBAs in three management/habitat<br />
categories<br />
The general trend of pressures show differences in the way<br />
they manifest themselves in the three Protected Area status<br />
categories (National Parks, Forest Reserves <strong>and</strong> Wetl<strong>and</strong>s/<br />
Ramsar Sites). Figure 15 as below provides a summary.<br />
(i) The three habitat classes all show general initial increase<br />
<strong>and</strong> a decline in pressures. However, the levels of increase<br />
<strong>and</strong> decrease vary between categories. This is an indication<br />
that habitat classes all respond differently under different<br />
pressures.<br />
(ii) Pressure trends in National Parks/ Wildlife Reserves<br />
have for a long time revolved around medium till 2008 <strong>and</strong><br />
this dropped in <strong>2009</strong>. The mean scores for the PA pressures<br />
were -1.15±0.19 <strong>and</strong> -0.85±0.22 (Mean±SEM, n=13) for<br />
the respective years showing a positive shift in pressure<br />
trends.<br />
(iii) Pressure trends in Forest Reserves fall below medium<br />
<strong>and</strong> with the gentlest rise of the three classes registering<br />
mean scores of -1±0.41 in 2008 compared to -0.89±0.26<br />
(Mean±SEM, n=9) in <strong>2009</strong>. This means that, in terms of<br />
effect, the Forest Reserves are still experiencing relatively<br />
minimal threats when spread throughout the sites.<br />
(iv) Pressure trends in wetl<strong>and</strong> IBAs are the most important<br />
of the three in terms of conservation action. This is because<br />
the mean scores for wetl<strong>and</strong> pressures rate highest <strong>and</strong><br />
above the medium point. The overall trend shows continuous<br />
increase in pressures till 2008 <strong>and</strong> only a reverse trend<br />
in <strong>2009</strong>. The mean scores of 2008 of -1.38±0.32 <strong>and</strong> -<br />
0.7±0.3 in <strong>2009</strong> (Mean±SEM, n=10) may be temporary <strong>and</strong><br />
so efforts to improve the situation are needed.<br />
of <br />
<br />
Fig 15 Pressure trends of IBAs in the three habitats categories<br />
Description of threats in <strong>2009</strong><br />
Appendix 1 shows an analysis of threats from each IBA. A total<br />
of 211 incidences of threats were reported in <strong>2009</strong>. The most<br />
threatened IBA is Lutembe Bay while the least threatened is<br />
Mgahinga National Park. The differences in the management<br />
regimes may have contributed to the level <strong>and</strong> management<br />
of the threats.<br />
Agricultural intensification<br />
Agricultural expansion or agricultural intensification is one<br />
single threat category that is wide spread <strong>and</strong> affecting most<br />
IBAs (55%) in the country (n=17). Notable examples include<br />
banana growing in Mt Elgon NP areas, cassava growing<br />
around Mt Kei Forest Reserve, potato growing in Nyamuriro<br />
Swamp, cattle grazing in LMNP, flower farming in Lutembe<br />
Bay, annual vegetable growing in Nabugabo Wetl<strong>and</strong>. Others<br />
include Nabajjuzi wetl<strong>and</strong>, Ajai WR, Otzi FR <strong>and</strong> Rwenzori<br />
National Park especially in Buhundu Parish.<br />
Use of agro-chemicals<br />
The chemicals being referred to here are agricultural<br />
chemicals. It has been reported from 10% (n=3) of the 33<br />
IBAs. The big problem here is being posed by flower farms<br />
that use chemical aerosols as pesticides <strong>and</strong> herbicides in<br />
green houses. Management <strong>and</strong> disposal of these chemicals<br />
is a major problem, which exacerbates its impact on habitats.<br />
Flower farms in Lutembe Bay have been accused of disposing<br />
chemicals into the Bay causing pollution. Other less serious<br />
use of chemicals includes field crop sprays like in Nyamuriro<br />
wetl<strong>and</strong> <strong>and</strong> use of agro-fertilizers in Doho Rice Scheme.<br />
Burning of vegetation<br />
Prolonged <strong>and</strong> consistent fires are potential trigger of<br />
ecological succession, which may be a positive thing when this<br />
succession involves natural vegetation but a negative one when<br />
such fires suppresses natural vegetation <strong>and</strong> promotes prolific<br />
growth of invasive species. In 2008, there were notable fires of<br />
considerable intensity in Kidepo Valley NP, Semliki WR, LMNP,<br />
MFNP <strong>and</strong> QENP, however, <strong>2009</strong> registered some changes<br />
in occurrences. Sites (from 84%, n=26 of IBAs) reported with<br />
fires include Mt Elgon NP, Budongo Forest, Kyambura, MFNP,<br />
LMNP, Nabugabo, Mabamba, Semliki WR, Semliki NP, Mt<br />
Moroto FR <strong>and</strong> Sango Bay. Please note that MFNP <strong>and</strong> LMNP<br />
have continued to experience extensive fires compared to any<br />
other National Parks. Kidepo Valley NP however registered low<br />
fires compared to the previously reported one of 2008.<br />
9//00
Disturbance to birds<br />
The disturbance to birds has been reported from 16%, (n=5 )<br />
of the IBAs. In Nyamuriro wetl<strong>and</strong> <strong>and</strong> Doho Rice Scheme, the<br />
people who are working in the field are the source of disturbance,<br />
in Mabamba Bay, it is the fishing communities who use the same<br />
tracts as the shoebill trekkers <strong>and</strong> who are potential sources of<br />
disturbance. This trend is similar to Semliki WR <strong>and</strong> Musambwa<br />
Isl<strong>and</strong> fishing communities who sometimes construct makeshift<br />
structures within the IBAs.<br />
Drainage<br />
Deliberate filling or conversion of wetl<strong>and</strong>s to agricultural fields<br />
is not new. This has been reported at 19% of the IBAs. The<br />
wetl<strong>and</strong>s, where they exist, are seen as soil banks <strong>and</strong> options<br />
for increasing production even in times of no rain. Draining is<br />
being done in Nyamuriro wetl<strong>and</strong>, Lutembe Bay <strong>and</strong> Doho Rice<br />
Scheme. Other areas reported include Nabugabo <strong>and</strong> Nabajjuzi<br />
wetl<strong>and</strong>s.<br />
Small holder grazing or forest grazing<br />
Pastoral communities around IBAs are sometimes forced by<br />
either adverse weather conditions or encroach of inside or at<br />
the boundaries of the IBAs to access better pastures. This is<br />
happening in 68% (n=21) of the IBAs. Sites affected by this type of<br />
threat <strong>and</strong> respective communities include Mt Elgon NP (Bukwo),<br />
Budongo (Lake Albert), MFNP (Bulisa), Nabugabo (Grassl<strong>and</strong>),<br />
Semliki WR (Ntooroko), Semliki NP (Grassl<strong>and</strong>), Mt Mororo FR<br />
(Hill slopes), Sango Bay (Grassl<strong>and</strong>). Other communities include<br />
the Toposa, Didinga <strong>and</strong> Dodoth in Kidepo Valley National Park.<br />
Deforestation<br />
This has been reported at 26% (n=8) of the IBA. The ever growing<br />
dem<strong>and</strong> for construction materials is promoting illegal logging<br />
thus affecting the quality of IBA condition. Most of the timber<br />
products <strong>and</strong> round wood products (e.g. poles) are obtained from<br />
Forest Reserves <strong>and</strong> sometimes National Parks. It is worth noting<br />
that some of the extractions are done with the knowledge of the<br />
relevant management authority under controlled use quotas or<br />
production regimes. Examples of this can be seen in Mt Elgon NP,<br />
Mt Kei FR, <strong>and</strong> the shores of Lutembe Bay, Semliki WR, Semliki<br />
NP <strong>and</strong> Sango Bay. Extensive or intensive logging has not been<br />
reported.<br />
Colonization<br />
Succession can be a natural event or induced by disturbance<br />
from human activities in or around the IBAs. The change of<br />
conditions within the habitat may favour the emergence of species<br />
which may later on alter the ecology <strong>and</strong> the eventual species<br />
composition of the site. This is evident at 13% (n=4) of the 33<br />
IBAs. The most notable is Lutembe Bay which has experienced<br />
many threats around it <strong>and</strong> all contributing to a change of habitat<br />
type with marshes dwindling <strong>and</strong> papyrus areas becoming more<br />
pronounced.<br />
Firewood collection / Charcoal burning<br />
The country’s population is one that depends on fuel wood energy<br />
resources <strong>and</strong> most of these resources are derived from nature.<br />
The wood energy if restricted to dry wood harvests. Sometimes<br />
controlled use quotas ensure sustainability. Fuel wood collection<br />
has been reported from 71% (n=22) of the IBAs. Notable<br />
amongst others are the communities of Mt Elgon NP, Budongo,<br />
Kyambura, MFNP, LMNP, Semliki NP, Semliki WR, Mt. Moroto<br />
FR <strong>and</strong> Sango Bay that are dependent on this wood fuel energy<br />
source.<br />
<br />
Human Settlement, Infrastructure <strong>and</strong> Real estate<br />
development,<br />
The population increase <strong>and</strong> the concomitant dem<strong>and</strong><br />
for l<strong>and</strong> have made the IBAs <strong>and</strong> other biodiversity rich<br />
areas targets for human settlement. There are cases of<br />
encroachment for settlement in Mt Elgon NP, Real estate<br />
development in Lutembe Bay, road construction <strong>and</strong><br />
power line construction in Semliki NP, town extension <strong>and</strong><br />
settlement in Mt. Moroto FR, Sango Bay, <strong>and</strong> Musambwa<br />
Isl<strong>and</strong>. Overall, this type of threat was reported at 19%<br />
(n=6) of the IBAs. It should be noted that some of the<br />
settlements are done on the edges of the IBAs but also<br />
inside the boundaries. There is therefore need to demarcate<br />
IBA boundaries where this has not been done so that it is<br />
easier to track encroachment within IBAs.<br />
Natural events (l<strong>and</strong>slides, floods <strong>and</strong> drought)<br />
Natural events come in the form of l<strong>and</strong>slides, floods <strong>and</strong><br />
drought. The mountainous areas of the country have been<br />
mostly affected by l<strong>and</strong>slides. The high inclines of the Mt<br />
Elgon NP <strong>and</strong> Rwenzori NP coupled with heavy rains have<br />
resulted in a series of l<strong>and</strong>slides. The North Eastern part<br />
of the country especially Mt Moroto FR has experienced<br />
enduring stress from drought <strong>and</strong> drought related events<br />
such as fires. The eastern part of the country experienced<br />
heavy rains resulting into floods especially in parts of<br />
Butaleja where Doho rice scheme was under water. Overall,<br />
this type of threat occurred in 13% (n=4) of the IBAs that<br />
were monitored.<br />
Recreation / tourism<br />
Tourism is one of the sustainable use options in conservation<br />
however, new developments need to be checked <strong>and</strong> all<br />
the precautions taken. The threat is reported from 29%<br />
(n=9) of the IBAs in Ug<strong>and</strong>a. There are new tourism<br />
developments in Mt Elgon NP, eco-lodges in Budongo FR,<br />
renovation of Lutembe beach, popularization of Nabugabo<br />
beach <strong>and</strong> camp, Mabamba shoebill watching <strong>and</strong> Semliki<br />
NP hot springs. These all risk potential sources of threats<br />
if not controlled. Controlled development of tourist facilities<br />
as well as ensuring these facilities meet the environmental<br />
st<strong>and</strong>ards through the m<strong>and</strong>atory environmental impact<br />
assessments <strong>and</strong> mitigation measures outlined.<br />
Unsustainable utilization of resource<br />
The use of biological resources is one of the main reasons<br />
why the IBA adjacent communities should be involved in the<br />
conservation process of the sites. The resources that are<br />
of notable values are bamboo shoots in Mt Elgon NP, fuel<br />
wood in Mt Kei, timber <strong>and</strong> non timber forest materials in<br />
Budongo FR, fuel wood in Kyambura, MFNP <strong>and</strong> LMNP.<br />
Wetl<strong>and</strong> resources in Lutembe, Nabugabo, Nyamuriro<br />
<strong>and</strong> Mabamba, while rattan cane harvest in Semliki NP<br />
<strong>and</strong> fodder in Semliki WR <strong>and</strong> Mt. Moroto FR respectively.<br />
The resource utilization is the most reported covering 90%<br />
(n=28) of the IBAs. Some uses are however, sustainable <strong>and</strong><br />
are controlled by the management authorities. However, a<br />
major problem is when the agreed use regulations are not<br />
adhered to or the managing authorizes lack the capacity to<br />
effectively enforce <strong>and</strong> monitor the levels of use.<br />
Extractive industry<br />
Extractive industry is reported from 26% (n=8) of the<br />
IBAs. There are different forms of extractive industries
that are being experienced in a number of IBAs. Notably mineral<br />
extraction in Nyamuriro swamp, stone quarry in Lutembe Bay,<br />
s<strong>and</strong> mining in Mabamba <strong>and</strong> Nabugabo <strong>and</strong> Limestone quarry<br />
in QENP <strong>and</strong> Kibale NP. When this is done on an extensive scale,<br />
it can be very detrimental. Oil exploration is a new development<br />
in the threat categories. This is already happening in MFNP <strong>and</strong><br />
the surrounding areas. Up to 8 new exploration areas have been<br />
fenced off in addition to already existing sites. This activity is<br />
very soon going to scale out in parts of Semliki <strong>and</strong> QENP <strong>and</strong><br />
therefore widening the potential sites whose integrity will be<br />
compromised.<br />
Plant introductions / invasive species<br />
There is a natural succession always happening but if the<br />
balance is disturbed, the ecology of plant community is also<br />
disrupted. Problematic species have been reported from 29%<br />
(n=9) of the IBAs. In Mt. Elgon, there is a very clear association<br />
between human settlements <strong>and</strong> spread of alien species, LMNP<br />
has continued to experience the problem of Acacia hockii, an<br />
invasive species, Semliki WR has problems of Opuntia vulgaris<br />
<strong>and</strong> Cassia spectabilis. Other invasive species are reported in<br />
QENP, Budongo FR, Mabira FR <strong>and</strong> Ajai WR.<br />
Selective logging / Licensed Pit Sawing<br />
The National Forest Authority as an institution manages central<br />
forest reserves for both biodiversity <strong>and</strong> productive revenue<br />
generation. In this case, the authority licenses pit sawing as one<br />
of the revenue generating activities. This is happening in Budongo<br />
FR in CFM plots. Other selective logging sites reported include<br />
Kasyoha – Kitomi, LMNP <strong>and</strong> Mt. Moroto FR. All together, the<br />
threat is reported from 19% (n=6) of the IBAs.<br />
Consumptive utilization<br />
A section of the community in Budongo Forest Reserve has<br />
been reported to collect eggs of big birds (probably Francolins<br />
<strong>and</strong> Guinea fowls) <strong>and</strong> also hunt the birds for food. This activity<br />
used to happen in Musambwa Isl<strong>and</strong>s but has since been halted.<br />
The only other notable place where birds are being hunted is<br />
Doho rice scheme. The threat is reported from these two places<br />
accounting for 6% (n=2) of the IBAs.<br />
Illegal fishing/ unsustainable fishing<br />
Illegal fishing has been noted in MFNP <strong>and</strong> LMNP. Over-fishing<br />
<strong>and</strong> sometimes using illegal fishing nets have been noted in a<br />
number of sites. In total, 35% (n=11) of the IBAs experienced<br />
this type of threat. Continuous fishing has been reported in<br />
Lutembe Bay, Nabugabo, Mabamba wetl<strong>and</strong>, Semliki WR, Sango<br />
Bay, <strong>and</strong> Musambwa Isl<strong>and</strong>.<br />
Water abstraction<br />
All the flower farms around Lutembe Bay draw their waters from<br />
the Bay. The flower farms therefore depend solely on the lake for<br />
their water. Mabamba wetl<strong>and</strong> water supply plant supplies Mpigi<br />
town with its drinking water while Nabajjuzi wetl<strong>and</strong> continue to<br />
be the main source of water for the Masaka population. Rwenzori<br />
NP has built two gravity flow schemes to supply water for the<br />
communities. Water abstraction is being reported from 13%<br />
(n=4) of the IBAs.<br />
Bird control / killing<br />
Recently, the communities near Semliki national park have taken<br />
to rice cultivation. The rice growers are now using all possible<br />
methods to control the population of birds which they view as<br />
pests. The use of poison to kill birds has persisted in Doho rice<br />
10<br />
scheme which may require immediate intervention. Two<br />
areas reported this type of threat <strong>and</strong> this accounts for 6%<br />
(n=2) of the IBAs.<br />
Flower Farming<br />
This new business has become very lucrative in recent times.<br />
In Lutembe Bay where only one flower farm existed in the<br />
early 2000’s, there are now up to six huge flower farms <strong>and</strong><br />
many out growers currently plying the trade. This trend may<br />
soon take root <strong>and</strong> move to other parts of the biodiversity<br />
rice areas that are soft targets. But so far Lutembe Bay is<br />
still the only IBA affected with this type of threat.<br />
Pollution<br />
The effect of pollution results from either the way the<br />
chemicals are applied, used or disposed. Lutembe Bay is<br />
still the only IBA with this kind of threat. More monitoring<br />
<strong>and</strong> control measures are needed to assess the impact of<br />
this to biodiversity in the Bay <strong>and</strong> the surrounding areas.<br />
[C] Responses <strong>and</strong> their <strong>Trends</strong> in <strong>2009</strong><br />
Responses <strong>and</strong> <strong>Trends</strong><br />
The Response Score is generated after assessing the levels<br />
of three different aspects. These are the level of protection<br />
within the protected area categories, the stages of the<br />
management planning process <strong>and</strong> the level of conservation<br />
initiatives being implemented. The protected area categories<br />
show the level of commitment towards the conservation of<br />
the site or habitat. The management planning indicates the<br />
short term, medium <strong>and</strong> long term laid down proposals that<br />
may be quickly implemented. And the conservation actions<br />
refer to activities implemented to improve conditions of the<br />
site.<br />
The overall resultant score would be the combination of<br />
the three indicators. The categories have been classified<br />
as negligible, low, medium <strong>and</strong> high. Interesting trends<br />
show that 2008 had many IBAs with ‘high’ response (56%)<br />
compared to <strong>2009</strong> (39%), however <strong>2009</strong> had many IBAs<br />
with ‘medium’ response (52%) unlike 28% in 2008. The two<br />
higher categories (High <strong>and</strong> Medium) show encouraging<br />
trends as opposed to the two lower categories (Negligible<br />
<strong>and</strong> Low). The variation in response trends are as shown in<br />
the figure 16 below.<br />
Percentage<br />
100%<br />
80%<br />
60%<br />
40%<br />
20%<br />
0%<br />
Responses categories compared 2001 - <strong>2009</strong><br />
2001 2008 <strong>2009</strong><br />
Year<br />
High<br />
Medium<br />
Low<br />
Neglegible<br />
Fig. 16 Response categories <strong>2009</strong><br />
(a) General trends of responses<br />
The overall trend in responses is impressive however there<br />
are some IBAs that still do not have management plans (e.g.<br />
Doho Rice Scheme, Lake Opeta, Lake Nakuwa <strong>and</strong> Lutoboka<br />
Point) <strong>and</strong> some are now outdated (e.g. Lutembe Bay <strong>and</strong><br />
Nabajjuzi Swamp). The sites are all at different levels of<br />
implementing conservation activities. In 2008, the overall<br />
conservation processes in all the IBAs registered significant
progress with 2.36±0.17 <strong>and</strong> a slight decline in <strong>2009</strong> with<br />
score of 2.26 ±0.13 (Mean±SEM). This is still good since the<br />
score is above medium as shown in the figure 17 below<br />
Low Medium High<br />
3<br />
2<br />
1<br />
Response <strong>Trends</strong> in IBAs in <strong>2009</strong><br />
0<br />
2000 2002 2004 2006 2008 2010<br />
Year<br />
Fig 17. General trends of response<br />
All IBAs<br />
(b) Response trends of IBAs in three habitat categories<br />
The general trend of responses shows a steady improvement<br />
in all the three habitat classes (Protected Areas, Forested IBAs<br />
<strong>and</strong> Wetl<strong>and</strong> IBAs). The following can be obtained from the<br />
figure 18 as below:<br />
(i) Response trends in National Parks <strong>and</strong> Wildlife Reserves are<br />
the most encouraging of the three management categories.<br />
This is because all the PAs have some level of protection <strong>and</strong><br />
with significant levels conservation activities. The mean scores<br />
for 2008 <strong>and</strong> <strong>2009</strong> of 2.77±0.12 <strong>and</strong> 2.62±0.14 (Mean±SEM,<br />
n=13) for the respective years do not show significant difference<br />
although showing a slight decline as in figure 18 below.<br />
(ii) Response trends in Forest Reserves follow a similar scenario<br />
as PAs with mean scores of 2.5±0.5 in 2008 compared to<br />
2.44±0.16 (Mean±SEM, n=9) in <strong>2009</strong>. This means that,<br />
in terms of conservation activities, protection status <strong>and</strong><br />
management planning, the Forest Reserves are rated second<br />
to National Parks <strong>and</strong> therefore better than the IBAs in the<br />
wetl<strong>and</strong> habitats in terms of conservation actions.<br />
(iii) Responses level (conservation efforts) in wetl<strong>and</strong> IBAs are<br />
still wanting. This registered tremendous change by 2006 when<br />
many sites were designated as Ramsar sites. Even then, the<br />
improvement of the conservation efforts fell short of a medium<br />
score. In 2008, the mean score registered was 1.63±0.32 <strong>and</strong><br />
almost no significant shift in <strong>2009</strong> with 1.6±0.22 (Mean±SEM,<br />
n=10). This shows that less impact is being felt in wetl<strong>and</strong> IBAs<br />
in terms of conservation actions.<br />
Some specific responses<br />
The Ug<strong>and</strong>a Wildlife Authority (UWA), the National<br />
Forest Authority (NFA) <strong>and</strong> the Wetl<strong>and</strong>s Management<br />
Department (WMD) all work to promote the integrity of the<br />
biodiversity habitat under their jurisdiction. The Protected<br />
Area management agency is promoting conservation in<br />
13 IBAs, Forest Reserve authority works in nine IBAs while<br />
Wetl<strong>and</strong>s Management authority works in 12 Ramsar sites,<br />
some of them overlapping with protected areas. There are<br />
two IBAs that do not belong to any of the international or<br />
national protected area categories: Doho Rice Scheme<br />
<strong>and</strong> Nyamuriro wetl<strong>and</strong>. The work of the management<br />
authorities in liaison with the communities help to enhance<br />
the conservation status of the sites. Although the overall<br />
impact varies from site to site, the efforts to initiate them<br />
need to be commended at all levels.<br />
Research <strong>and</strong> Conservation<br />
Budongo Conservation Field Station (BCFS), an affiliate to<br />
Makerere University is doing research in chimpanzees <strong>and</strong><br />
related flora <strong>and</strong> fauna. National Agricultural Research<br />
Organization (NARO) is working on Senna spectabilis,<br />
an invasive species in Budongo. This is exploring ways of<br />
eradication of this invasive species because of its impacts on<br />
the alteration of habitats <strong>and</strong> displacement <strong>and</strong> suppression<br />
of native species. Economic Policy Research Center<br />
(EPRC), is carrying out research on valuation of economic<br />
potential of Budongo FR. Institute of Botany University<br />
of Hohenheim, Germany, which is part of the Biodiversity<br />
Monitoring Transect Analysis (BIOTA) in East Africa project<br />
is working on the forest regeneration <strong>and</strong> increament with<br />
specific reference to rainfall <strong>and</strong> soils. Makerere University<br />
Biological Field Station (MUBFS) in Kibale hosts researches<br />
in primates <strong>and</strong> fish. QENP yearly accepts proposals in<br />
different fields of ecology <strong>and</strong> management researches.<br />
There other such research activities in KVNP, MENP <strong>and</strong><br />
MFNP.<br />
Collaborative Forest Management (CFM)<br />
There are six local community groups: Nyakase<br />
Environmental Conservation Develoment Association<br />
(NECODA), Siba Environmental Conservation Develoment<br />
Association (SEDA), Kavujubi Forest Adjacent Community<br />
Association (KAFAKA), Kapeeka Integrated Development<br />
Association (KICODA), Budongo Good Neighbour<br />
Conservation Association (BUNCA) <strong>and</strong> North Budongo<br />
Forest Community Association (NOBUFOKA) that have been<br />
registered as Community Based Organizations working<br />
towards the conservation of the forest. In Bugoma Central<br />
Forest Reserve, there are four CFM groups, namely Kaseeta<br />
Tugende Omumaiso Association, Kidoma Conservation <strong>and</strong><br />
Development Association, Kyangwali Twimukye Association<br />
<strong>and</strong> Kabwoya Enviromental Conservation Development<br />
Association. In Echuya, there are four CFM groups, Mabira<br />
Forest Reserve has one while Kasyoha – Kitomi has five.<br />
Site actions <strong>and</strong> site interventions<br />
<strong>Nature</strong>Ug<strong>and</strong>a through its projects at two IBAs (Echuya<br />
<strong>and</strong> Kasyoha-Kitomi Forest Reserve) continue to support<br />
Fig 18 Response trends of IBAs in the three habitats<br />
categories<br />
11<br />
livelihood improvement interventions to conserve the<br />
biodiversity in them. So far 9 CFM agreements, 4 in<br />
Echuya <strong>and</strong> 5 in Kasyoha-Kitomi, have been signed in the<br />
two IBAs with an additional two under negotiation. The<br />
CFM agreements increased collaboration between NFA
<strong>and</strong> Local forest adjacent communities in both Echuya <strong>and</strong><br />
Kasyoha-Kitomi. Community members now have access to<br />
forest products under agreed arrangements through CFM<br />
agreements, community attitude towards the forest is very<br />
positive <strong>and</strong> this has promoted the co-management of the<br />
forest by NFA <strong>and</strong> other stakeholders. NFA <strong>and</strong> Community<br />
relationships which had hitherto been hostile have greatly<br />
improved for the Batwa community near Echuya forest.<br />
As part of the livelihood improvement <strong>and</strong> provision of<br />
alternative sources of forest based resources, different<br />
Income Generating Activities have been introduced in these<br />
areas. These include mushroom growing, bee keeping, fruit<br />
growing, <strong>and</strong> Sustainable Organic Agriculture (SOA) activities.<br />
In Musambwa Isl<strong>and</strong>s conservation was done through<br />
sensitization meetings, by-law enforcement <strong>and</strong> facilitation<br />
of SSGs in monitoring while in Nabajjuzi wetl<strong>and</strong> system, an<br />
environmental education programme has continued to be the<br />
pillar in community sensitization. Support Ramsar Programme<br />
was used to implement conservation actions in three sites/<br />
IBAs. The programme received a boost from the COBWEB<br />
project that is looking to extend protected area network to<br />
include two wetl<strong>and</strong> systems (3 IBAs): Lake Opeta, Lake Bisina<br />
<strong>and</strong> Lake Mburo – Nakivali wetl<strong>and</strong> systems.<br />
Species Action Plans<br />
<strong>Nature</strong>Ug<strong>and</strong>a in collaboration with other national institutions<br />
produced a draft of the National Grey Crowned Cranes Species<br />
Action Plan that will be a very useful tool in its conservation as<br />
its population continues to decline. The Grey Crowned Crane<br />
species Action plan was produced as one of the outputs of<br />
the Cranes <strong>and</strong> Wetl<strong>and</strong>s Conservation project that is based<br />
in Western Ug<strong>and</strong>a. The Project was developed by NU after<br />
realising the declining population of the bird due to destruction<br />
of its habitat. <strong>Nature</strong>Ug<strong>and</strong>a remains committed to monitoring<br />
the Cranes population <strong>and</strong> implement various wetl<strong>and</strong><br />
conservation through its project <strong>and</strong> programmes.<br />
Monitoring Species Populations<br />
<strong>Nature</strong>Ug<strong>and</strong>a through its waterbird monitoring under the<br />
aegeis of African Waterfowl Census (AfWC) monitoring<br />
programme has continued to monitor species at a number of<br />
sites. This programme covers IBAs that are PAs, Ramsar Sites<br />
<strong>and</strong> Non - protected sites with 32 established sites but only 28<br />
regularly monitored bi-annually (Jan – Feb <strong>and</strong> Jul – Aug) since<br />
1990. Other monitoring programmes include the Common<br />
Birds Monitoring programme (CBM), Raptor monitoring <strong>and</strong><br />
Vulture population monitoring. The Common Birds Monitoring<br />
programme organised volunteers across the country <strong>and</strong><br />
established 63 sites. Of these 30 are in PAs <strong>and</strong> 33 outside<br />
PAs classed as agro-pastoral, forested, agricultural <strong>and</strong> periurban<br />
sites. The programme started in <strong>2009</strong> <strong>and</strong> monitoring<br />
is done twice a year (Jan-Feb <strong>and</strong> Jul-Aug) in collaboration with<br />
MUIENR.<br />
The raptor population monitoring is done both in 4 savannah PAs<br />
<strong>and</strong> outside PAs (along public roads). This has been monitored<br />
since 2008. The results are being compared with those done in<br />
1960’s, 70’s <strong>and</strong> 80’s for any changes. The attempt to get the<br />
relative abundance of vulture population in Ug<strong>and</strong>a was done in<br />
2003. This was again repeated in <strong>2009</strong> using a new suggested<br />
method of using animal carcasses in the four savannah PAs/<br />
IBAs of Ug<strong>and</strong>a. The monitoring activities of <strong>Nature</strong>Ug<strong>and</strong>a<br />
are sustained by volunteers <strong>and</strong> because of the need to build<br />
12<br />
adequate capacity, <strong>Nature</strong>Ug<strong>and</strong>a organised national training<br />
for these volunteers. The CBM <strong>and</strong> the IBA monitoring<br />
programmes organised training to build the capacity <strong>and</strong> skills<br />
of the volunteers in the monitoring protocols. The IBA training<br />
aims at producing a yearly IBA status <strong>and</strong> trends report to<br />
be used as a tool for advocacy <strong>and</strong> triggering actions to save<br />
deteriorating site.<br />
Advocacy work<br />
<strong>Nature</strong>Ug<strong>and</strong>a as a membership organization has increased<br />
its membership base <strong>and</strong> continues to be of service to its<br />
members. As a way of servicing its members NU organizes<br />
monthly public talks on topical issues aimed at disseminating<br />
information to the general public. This is one of the many<br />
ways that the institution uses to reach the public <strong>and</strong> mobilize<br />
support for site interventions. In <strong>2009</strong>, monthly public talks<br />
were taken to a much higher level, with the inaugural two day’s<br />
scientific conservation conference, which brought together<br />
scientist, practitioners <strong>and</strong> national leaders being held in<br />
Kampala, Ug<strong>and</strong>a. <strong>Nature</strong>Ug<strong>and</strong>a also organises nature walks<br />
for its members on a monthly basis <strong>and</strong> through its technical<br />
working groups, people of interest in different taxa are reached.<br />
Through the explorer’s programmes, children in schools are<br />
being reached <strong>and</strong> exposed to environmental conservation<br />
issues <strong>and</strong> how they can be involved in conservation from an<br />
early age. Is there any other advocacy work you may want to<br />
mention i.e Mabira FR advocacy, articles in the media (recent<br />
one on shoe bill <strong>and</strong> wild bird trade that appeared in the East<br />
African weekly etc<br />
Site Support Group actions<br />
The SSGs at Lutembe Bay, Mabamba Bay <strong>and</strong> Lake Katwe<br />
(3 IBAs) have been supported to continue the advocacy of<br />
better conservation measures <strong>and</strong> wise use approaches<br />
including eco-tourism at these three sites. Support to the<br />
16 SSGs in six IBAs has been maintained at various levels<br />
to retain presence even in areas where there is no active<br />
conservation funded programme. The SSGs are engaged in<br />
various advocacy, conservation <strong>and</strong> eco-tourism approaches<br />
which ensure wise use of resources. With the vigilance of the<br />
SSGs <strong>Nature</strong>Ug<strong>and</strong>a managed to save the only habitat for the<br />
Grauer’s Rush Warbler by petitioning NEMA over the road<br />
construction that was being poorly done <strong>and</strong> destroying its<br />
home. Conservation activities around Echuya have seen the<br />
population of the Grauer’s Rush Warbler increase more than<br />
double the number of pairs in 2004.<br />
Institutional collaboration<br />
<strong>Nature</strong>Ug<strong>and</strong>a has through the years established partnerships<br />
with various institutions. A number of MoUs have been signed<br />
<strong>and</strong> consolidated with MUIENR, UWA, NFA, MTTI <strong>and</strong> some<br />
District local governments. Where there are no MoUs, the<br />
institution has established good working relationships such<br />
as with NEMA <strong>and</strong> other relevant institutions. Through this<br />
synergy, better delivery of results can be ensured. Good<br />
relationship ensures effective participation in national<br />
planning processes <strong>and</strong> helps extend network development<br />
<strong>and</strong> improved communication between partners <strong>and</strong> other<br />
government sectors that require information.<br />
Civil Society Organization presence<br />
In Mt. Otzi FR, Jane Goodall Institute (JGI) is working on the<br />
conservation of Chimpanzees, Straight Talk Foundation,<br />
through the tree talk is encouraging tree planting through
schools <strong>and</strong> Environmental Alert is promoting both agriculture<br />
<strong>and</strong> environmental protection. In Mt. Kei FR, there is a vibrant<br />
CBO with a potential of being organized into a CFM group<br />
when appropriate. In Bugoma, Eco-Trust <strong>and</strong> CARE Ug<strong>and</strong>a<br />
are promoting four CFM group actions through enterprise<br />
development, JGI works on conservation of Chimpanzees,<br />
WWF is h<strong>and</strong>ling enrichment planting.<br />
In Kibale NP, quite a number of institutions are engaged in<br />
various activities: WCS provides technical <strong>and</strong> financial<br />
support in areas of monitoring <strong>and</strong> research, Kibale Fuel Wood<br />
Project works with the community through tree planting <strong>and</strong><br />
environmental education. Ug<strong>and</strong>a North Carolina International<br />
Teaching for environment (UNITE) <strong>and</strong> Wildlife Clubs of Ug<strong>and</strong>a<br />
<strong>and</strong> American Friends of Kasisi Primary Schools (AFRO-KAPS)<br />
are supporting schools through infrastructure development<br />
<strong>and</strong> environmental education. FACE the FUTURE (Forest<br />
Absorbing Carbondioxide Emissions - FACE) is collaborating<br />
with UWA in restoration programmes. Other research<br />
programmes include Kibale Fish <strong>and</strong> Monkey project.<br />
In Mt Rwenzori NP, WWF is working on l<strong>and</strong>scape restoration<br />
in areas adjacent to the park. It also has community<br />
programmes h<strong>and</strong>ing environmental conservation. A CSO<br />
called Rwenzori Mountains Cultural Values Conservation<br />
Association (RweMCCA) is working towards conservation of<br />
sacred resources. PROTOS is working in the management of<br />
Mpanga River catchment while WWF work is concentrated<br />
in Semliki River catchment. In Mgahinga NP <strong>and</strong> Bwindi<br />
Impenetrable NP, ITFC is working especially on the Albertine<br />
Rift endemics, IGCP <strong>and</strong> Mountain Gorilla Conservation Project<br />
(MGCP) working on the conservation of Gorilla, Mgahinga<br />
Bwindi Impenetrable Forest Conservation Trust is supporting<br />
programmes within the park <strong>and</strong> the community. CARE Ug<strong>and</strong>a<br />
is supporting resource use areas through development of<br />
monitoring parameters.<br />
In Echuya, <strong>Nature</strong>Ug<strong>and</strong>a, through its livelihood <strong>and</strong><br />
conservation project, is promoting conservation of the FR.<br />
Africa 2000 Network is working with CFM groups in areas of<br />
awareness, training <strong>and</strong> support towards Income generating<br />
Activities. Kulika Ug<strong>and</strong>a promotes organic agriculture<br />
bamboo domestication among others <strong>and</strong> CARE Ug<strong>and</strong>a is<br />
working with the Batwa community. The two districts of Kabale<br />
<strong>and</strong> Kisoro under the Farm Income Enhancement <strong>and</strong> Forest<br />
Conservation Project (FIEFCO) are supplying seedlings to the<br />
communities. Other sites that are not mentioned here do not<br />
necessary mean they do not have CSO presence but only that<br />
they were not compiled.<br />
The Jane Goodall Institute<br />
The Institute specializes in the conservation of Chimpanzees<br />
<strong>and</strong> chimpanzee’s habitat in Budongo. They have habituated<br />
chimpanzees for eco-tourism development. They are now<br />
giving conservation education to the communities adjacent to<br />
the forest. Their work extends to parts of Otzi Forest Reserve.<br />
The introduction of a ‘Village Enterprise Fund’ is contributing<br />
towards conservation of Budongo Forest Reserve as a<br />
chimpanzee habitat. It gives grants to organized groups as<br />
an alternative source of income than going to the forest for<br />
the produce.<br />
World Wide Fund for <strong>Nature</strong> (WWF) <strong>and</strong> Eco – Trust<br />
WWF is dealing with the conservation of biodiversity in the<br />
Albertine Rift. Activities include forest protection, restoration<br />
of degraded areas, boundary maintenance, planting <strong>and</strong> redemarcation<br />
of forest blocks especially in Budongo Forest<br />
Reserve <strong>and</strong> Mount Rwenzori National Park (MRNP). Eco-<br />
Trust is purposely engaged in the Carbon trade business. It<br />
gives out grants (carbon fund) to local adjacent communities<br />
<strong>and</strong> encourages them to plant indigenous tree species for<br />
purposes of carbon absorption.<br />
Tourism development<br />
There are two eco-tourism sites (Kaniyo Pabidi <strong>and</strong> Busingiro).<br />
Kaniyo Pabidi is situated in the north eastern part of the<br />
reserve. A group of about 30 chimpanzees has been fully<br />
habituated for eco-tourism purposes. The site is continuous<br />
with Murchison Falls National Park <strong>and</strong> Bugungu Wildlife<br />
Reserve. Busingiro eco-tourism site is situated in the south<br />
western part of the reserve with primates <strong>and</strong> many butterfly<br />
species. The Royal Mile is the epitome of Busingiro site. It is<br />
a stretch of one mile with a collection of tree species found<br />
in Budongo Forest. The site derives its name from the royal<br />
visits. It is maintained by NFA for aesthetic <strong>and</strong> recreational<br />
virtue. Restricted numbers of visitors always ensure minimal<br />
damage to the environment. Other examples of eco-tourism<br />
development include Rwenzori Mountaineering Services <strong>and</strong><br />
Rwenzori Trekkers Services in MRNP.<br />
A sharp divide between conservation <strong>and</strong> agriculture: Bwindi Impenatrable National Park<br />
13<br />
13
Major conclusions<br />
The general trend in condition has been maintained just<br />
above moderate as of 2008 <strong>and</strong> showing an improvement<br />
in <strong>2009</strong>.<br />
The status of National Parks <strong>and</strong> Wildlife Reserves remained<br />
more or less similar up to 2008 <strong>and</strong> a slight improvement in<br />
<strong>2009</strong> which is positive trend when considered individually.<br />
The condition of Forest Reserves has continued to have a<br />
steady decline through the years (2001, 2008 <strong>and</strong> <strong>2009</strong><br />
have all registered declines. This is however exhibiting a much<br />
gentler decline as compared to the wetl<strong>and</strong>s.<br />
The conditions of the wetl<strong>and</strong> IBAs also have declined through<br />
the years except for a slight improvement in <strong>2009</strong>.<br />
Chapter Four<br />
of effect, the Forest Reserves are still experiencing relatively<br />
minimal threats when spread throughout the sites.<br />
Threats in wetl<strong>and</strong> IBAs are the most important of the three<br />
in terms of conservation action. This is because the mean<br />
scores for wetl<strong>and</strong> threats rate highest <strong>and</strong> above the medium<br />
point <strong>and</strong> so efforts to improve the situation are needed.<br />
The overall conservation processes in all the IBAs registered<br />
significant progress with <strong>and</strong> a slightly declined in <strong>2009</strong>. This<br />
is still good since the score is above medium<br />
Response trends in National Parks <strong>and</strong> Wildlife Reserves are<br />
the most encouraging of the three management categories.<br />
This is because all the PAs have some level of protection <strong>and</strong><br />
with significant levels conservation activities.<br />
The general trends of threats in all IBAs have been rising<br />
steadily but just above the medium <strong>and</strong> on a positive not, this<br />
has improved in <strong>2009</strong>.<br />
Threats in National Parks/ Wildlife Reserves have for a long<br />
time been maintained at medium till 2008 <strong>and</strong> this dropped<br />
in <strong>2009</strong>.<br />
Threats in Forest Reserves are below medium <strong>and</strong> with the<br />
gentlest rise of the three classes. This means that, in terms<br />
Response trends in Forest Reserves follow a similar scenario<br />
as PAs in <strong>2009</strong>. This means that, in terms of conservation<br />
activities, protection status <strong>and</strong> management planning, the<br />
Forest Reserves are rated second to National Parks <strong>and</strong><br />
better than the IBAs in the wetl<strong>and</strong> habitats.<br />
Responses levels (conservation efforts) in wetl<strong>and</strong> IBAs are<br />
still low. This registered tremendous change by 2006 when<br />
many sites were designated as Ramsar sites. Even then, the<br />
improvement of the conservation efforts fell short of a medium<br />
score<br />
Effect of road construction blockage to Muchuya Swamp, habitat to Grauer’s Rush Warbler<br />
14<br />
14
Major Recommendations<br />
Chapter Five<br />
<strong>Nature</strong>Ug<strong>and</strong>a<br />
• Identify, assess <strong>and</strong> qualify more sites for inclusion as Important<br />
Bird Areas for example Kibimba Rice Scheme <strong>and</strong> extend the<br />
boundary of Mabamba Bay to include Makanaga, a vital new<br />
annex.<br />
• Train Site Support Groups, Parish Extension Agents <strong>and</strong> key<br />
individuals in IBA monitoring <strong>and</strong> basic steps in biodiversity<br />
assessments. This should include mainstreaming Common<br />
Birds Monitoring, L<strong>and</strong> Bird Monitoring, Raptor Censuses <strong>and</strong><br />
African Water Fowl Censuses into the IBA monitoring program.<br />
• Continue advocacy for the different Key Biodiversity Areas <strong>and</strong><br />
raise their profiles locally <strong>and</strong> internationally.<br />
• Appropriately <strong>and</strong> effectively coordinate the process of IBA<br />
monitoring aimed at ensuring long term sustainability.<br />
• Consolidate the wetl<strong>and</strong>s restoration programs in Key<br />
Biodiversity Areas where it has been started <strong>and</strong> initiate it in<br />
areas that require immediate action.<br />
• Continue the process of negotiating CFM agreements in<br />
collaboration with NFA <strong>and</strong> ensure that the agreements are<br />
abided by when signed.<br />
• Source funding <strong>and</strong> support income generating activities within<br />
communities living in or near IBAs <strong>and</strong> enhance conservation of<br />
these areas.<br />
• Where appropriate, establish SSGs <strong>and</strong> empower them to the<br />
level of protecting the site <strong>and</strong> monitoring <strong>and</strong> reporting illegal<br />
activities.<br />
• Initiate <strong>and</strong>/or participate in development of management plans<br />
for IBAs that still do not have them <strong>and</strong> advocate for proper<br />
implementation of plans when developed.<br />
• Negotiate with the local government <strong>and</strong> local communities for<br />
appropriate bye-laws <strong>and</strong> empower the communities to observe<br />
the bye-laws to protect sites.<br />
UGANDA WILDLIFE AUTHORITY<br />
• Monitor <strong>and</strong> reduce incidences of agricultural encroachment<br />
(small holder farming) especially in Ajai Wildlife Reserve.<br />
• Monitor <strong>and</strong> prevent incidences of wild fires especially in<br />
savannah national parks (MFNP, KVNP <strong>and</strong> LMNP).<br />
• Manage the resource harvesting <strong>and</strong>/or access by the<br />
communities <strong>and</strong> ensure that the agreements are adhered to.<br />
• Initiate <strong>and</strong> properly manage the alien or invasive species that<br />
threaten the ecological health of the habitats.<br />
• Monitor the oil exploration activities in the national parks <strong>and</strong><br />
ensure that there are no detrimental effects to the biodiversity.<br />
• Incorporate the IBA monitoring process into the existing<br />
Management Information System (MIST) for long term<br />
sustainability of the program.<br />
• Increase community participation in resource allocations by<br />
negotiating quotas for resource harvesting <strong>and</strong> promotion of<br />
best practices that support biodiversity.<br />
• Improve support to the habitat restoration program <strong>and</strong> where<br />
necessary, active involvement of other relevant stakeholders to<br />
be advised.<br />
• Strengthen the law enforcement program to further reduce<br />
on the illegal activities <strong>and</strong> consolidate community sensitization<br />
programs.<br />
• Develop targeted good management options that are aimed at<br />
15<br />
improving the condition of the different habitat types in<br />
protected <strong>and</strong> wildlife rich areas.<br />
• Improve on the program of eradication of alien invasive<br />
species while promoting those processes that have<br />
been proven effective <strong>and</strong> sensitive to conservation<br />
initiatives.<br />
• Reduce / limit destructive tourism activities <strong>and</strong><br />
develop <strong>and</strong> implement programs that are aimed at<br />
addressing such incidences.<br />
WETLANDS MANAGEMENT DEPARTMENT<br />
• Monitor the chemical use <strong>and</strong> disposal at Lutembe<br />
wetl<strong>and</strong> <strong>and</strong> ensure that the bay is not polluted by<br />
improper waste disposal.<br />
• Monitor <strong>and</strong> reduce incidences of agricultural<br />
encroachment (small holder farming) especially in<br />
Nyamuriro wetl<strong>and</strong> <strong>and</strong> Nabajjuzi wetl<strong>and</strong>.<br />
• Monitor the wetl<strong>and</strong> drainage at Lutembe bay <strong>and</strong><br />
ensure that the bay depleted of its 200 M buffer<br />
zone.<br />
• Quicken the process of developing management plans<br />
for the Ramsar sites / IBAs that do not have them<br />
<strong>and</strong> effectively implement the plans in sites that have<br />
them.<br />
• Work closely with the different stakeholders in<br />
preventing or reducing the exp<strong>and</strong>ing destructive<br />
commercial farming in critical wetl<strong>and</strong>s especially<br />
Ramsar sites <strong>and</strong> IBAs.<br />
• Consolidate the involvement of local communities in<br />
the protection <strong>and</strong> restoration of degraded wetl<strong>and</strong><br />
habitats.<br />
• Initiate <strong>and</strong> implement inventories on establishing<br />
boundaries of wetl<strong>and</strong>s especially those with unique<br />
habitats <strong>and</strong> species.<br />
• Encourage the institution of wetl<strong>and</strong> policing programs<br />
that are aimed at enforcing law <strong>and</strong> regulation<br />
either through the government department or the<br />
communities.<br />
• Improve on the involvement <strong>and</strong> participation of<br />
National Environment Management Authority in EIAs<br />
<strong>and</strong> decisions on developments in <strong>and</strong> near fragile<br />
wetl<strong>and</strong>s.<br />
NATIONAL FOREST AUTHORITY<br />
• Monitor <strong>and</strong> reduce incidences of agricultural<br />
encroachment (small holder farming) especially in Mt.<br />
Kei, Mt Otzi <strong>and</strong> Budongo FRs.<br />
• Check on the incidences of wild fires especially in<br />
drought prone forest reserves of Mt Kei, Mt. Moroto<br />
<strong>and</strong> Mt Otzi FRs.<br />
• Effectively <strong>and</strong> efficiently supervise logging (selective<br />
logging of invasive species) activities to ensure that the<br />
habitats are not altered.<br />
• The boundaries of the reserves need to be marked<br />
<strong>and</strong> monitored to reduce on the various forms of<br />
encroachment.<br />
• Initiate or consolidate reforestation programs in heavily<br />
degraded forest reserves <strong>and</strong> ensure regeneration<br />
where appropriate.<br />
• Promote alternative sources of fuel wood <strong>and</strong> use of
fuel saving stoves to reduce dependency on forest as sole<br />
source of energy.<br />
• Strengthen community participation in decision making <strong>and</strong><br />
management of the forests <strong>and</strong> the forest resources.<br />
• Together with the relevant stakeholders, negotiate CFM<br />
agreements with the forest adjacent communities <strong>and</strong><br />
ensure that the agreements are strictly followed.<br />
• Increase education <strong>and</strong> awareness campaigns that<br />
address direct beneficiaries <strong>and</strong> discourage destructive<br />
developments<br />
• Strengthen the use of policies <strong>and</strong> laws <strong>and</strong> promote relevant<br />
sections of the constitutions to enhance conservation of<br />
IBAs.<br />
NATIONAL BIODIVERSITY DATA BANK (NBDB)<br />
• Steer the process of incorporating the IBA monitoring data<br />
into the State of Biodiversity Report <strong>and</strong> other national<br />
reporting processes.<br />
• Give support to the process of effectively <strong>and</strong> efficiently<br />
using the IBA monitoring data <strong>and</strong> support the process of<br />
publishing articles with major conservation journals.<br />
• Continue to coordinate the process of data storage <strong>and</strong><br />
management <strong>and</strong> where possible, link the IBA data with<br />
other national data available as supportive information.<br />
MAJOR INSTITUTIONS INVOLVED IN THE IBA MONITORING<br />
PROGRAMME<br />
Ug<strong>and</strong>a Wildlife Authority (UWA)<br />
The Ug<strong>and</strong>a Wildlife Authority (UWA) was established in<br />
August 1996 by the Ug<strong>and</strong>a Wildlife Statute, which merged<br />
the Ug<strong>and</strong>a National Parks <strong>and</strong> the Game Department. UWA<br />
is in charge of management of 10 National Parks, 12 Wildlife<br />
Reserves, 14 Wildlife Sanctuaries <strong>and</strong> provides guidance for<br />
5 Community Wildlife Areas.<br />
UWA’s mission is to conserve <strong>and</strong> sustainably manage the<br />
wildlife <strong>and</strong> Protected Areas of Ug<strong>and</strong>a in partnership with<br />
neighbouring communities <strong>and</strong> stakeholders for the benefit<br />
of the people of Ug<strong>and</strong>a <strong>and</strong> the global community. UWA is<br />
committed to adhere to the international conventions <strong>and</strong><br />
protocols for which Ug<strong>and</strong>a is a party. These include but are<br />
not limited to; the Convention for Biological Diversity (CBD),<br />
the Convention for International Trade in Endangered Species<br />
(CITES) <strong>and</strong> many others that have been ratified.<br />
ecologically stable, <strong>and</strong> economically prosperous Ug<strong>and</strong>a”.<br />
The Government of Ug<strong>and</strong>a, in 1998 adopted a policy to<br />
restructure many government departments including the<br />
Forestry Department (FD). It recognized an urgent need<br />
for a change in the policy, legal framework <strong>and</strong> institutions<br />
controlling forestry in the country. It was decided that a new<br />
institutional arrangement was needed hence the Forestry<br />
Inspection Division (FID), the National Forestry Authority<br />
(NFA) <strong>and</strong> the District Forestry Services (DFS) were set up in<br />
2003. The establishment of the National Forestry Authority<br />
was preceded by the development of the new Forestry Policy<br />
(2001) <strong>and</strong> the National Forest Plan (2002). These were<br />
to provide for a framework for distribution of roles <strong>and</strong><br />
responsibilities amongst sector stakeholders <strong>and</strong> not just<br />
the Forestry Department.<br />
Wetl<strong>and</strong>s Management Department<br />
In 1989 the Ug<strong>and</strong>a government established the National<br />
Wetl<strong>and</strong>s Conservation <strong>and</strong> Management Programme<br />
(NWP) to develop policies <strong>and</strong> strategies for sustainable<br />
management of the wetl<strong>and</strong>s of Ug<strong>and</strong>a. In 1995, the<br />
government endorsed the national policy for the conservation<br />
of wetl<strong>and</strong> resources. From being called the Wetl<strong>and</strong>s<br />
Department (WD), this transformed through the years<br />
to Wetl<strong>and</strong>s Inspection Division (WID) <strong>and</strong> now Wetl<strong>and</strong>s<br />
Management Department (WMD).<br />
The Wetl<strong>and</strong>s Management Department has an overall<br />
vision of ensuring conservation, wise use <strong>and</strong> protection of<br />
wetl<strong>and</strong>s in Ug<strong>and</strong>a through increased appreciation <strong>and</strong><br />
effective management as a means to achieving sustainable<br />
development. This can only be achieved through knowledge<br />
<strong>and</strong> underst<strong>and</strong>ing of ecological processes, public <strong>and</strong><br />
stakeholder awareness, institutional framework <strong>and</strong> planning<br />
<strong>and</strong> management of wetl<strong>and</strong>s amongst others.<br />
Wetl<strong>and</strong>s in Ug<strong>and</strong>a cover approximately 13% of the total<br />
area of the country <strong>and</strong> of various types. Of the many wetl<strong>and</strong>s,<br />
12 of them have been designated as Ramsar Sites. All these<br />
sites are also IBAs. The management of eight of them is<br />
vested in the h<strong>and</strong>s of WMD <strong>and</strong> the remaining four (MFNP,<br />
LMNP, QENP <strong>and</strong> RMNP) is a joint venture between UWA<br />
<strong>and</strong> WMD as the boundaries are shared with Protected<br />
Area management. This therefore means that the general<br />
management plans of the respective PA covers partly the<br />
management of the Ramsar site in question.<br />
UWA’s strategic programmes on Protected Area management<br />
rest with the Department of Planning, Monitoring <strong>and</strong> Research.<br />
The main sections include general management planning,<br />
annual operational planning, collaborative management <strong>and</strong><br />
infrastructure development <strong>and</strong> Community Conservation <strong>and</strong><br />
Benefits. The community conservation programmes comprise<br />
revenue sharing projects, resource utilization, community<br />
tourism, conservation education <strong>and</strong> creation of institutional<br />
linkages.<br />
National Forest Authority (NFA)<br />
The Central Forest Reserves are held in trust for the people<br />
of Ug<strong>and</strong>a <strong>and</strong> managed by the National Forestry Authority.<br />
The National Forestry Authority which was launched in 2004<br />
has tremendously registered success with regard to the aims<br />
<strong>and</strong> objectives for which it was established. Together with the<br />
stakeholders, NFA strives to achieve “a sufficiently forested,<br />
16<br />
<strong>Nature</strong>Ug<strong>and</strong>a<br />
<strong>Nature</strong>Ug<strong>and</strong>a, East Africa Natural History Society (EANHS)<br />
is a Non Governmental Organization working towards the<br />
conservation of species, sites <strong>and</strong> habitats for people <strong>and</strong><br />
biodiversity. It is the BirdLife International partner in Ug<strong>and</strong>a<br />
<strong>and</strong> a member of IUCN. The conservation of species, sites<br />
<strong>and</strong> habitats are achieved through research, conservation<br />
<strong>and</strong> advocacy across the country.<br />
• Create a nature-friendly public<br />
• Enhance knowledge of Ug<strong>and</strong>a’s natural history<br />
• Advocate for policies favorable to the environment<br />
• Take action to conserve priority species sites <strong>and</strong><br />
habitats<br />
This is achieved through advocacy, research <strong>and</strong> conservation<br />
projects. <strong>Nature</strong>Ug<strong>and</strong>a, through its research pillar, identified
33 IBAs. Since the identification, several efforts have been<br />
advocated to raise the conservation status of these important<br />
areas which included Ramsar designation among others.<br />
National Environment Management Authority (NEMA)<br />
NEMA is a semi-autonomous institution that was established<br />
by an Act of parliament in May 1995 <strong>and</strong> became operational<br />
in December 1995. NEMA is therefore specifically m<strong>and</strong>ated<br />
by the National Environment Act (NEA), Cap. 153 as the<br />
principal agency in Ug<strong>and</strong>a charged with the responsibility<br />
of coordinating, monitoring, supervising <strong>and</strong> regulating all<br />
environmental management matters in the country. Its mission<br />
is to promote <strong>and</strong> ensure sound environmental management<br />
practices for sustainable socio-economic development.<br />
The functions of National Environment Management Authority<br />
(NEMA) are amongst others to coordinate the implementation<br />
of government policy <strong>and</strong> the decision of the Policy Committee<br />
on Environment; to undertake research, <strong>and</strong> disseminate<br />
information about the environment; to prepare <strong>and</strong> disseminate<br />
a state of the environment report once in every two years <strong>and</strong><br />
to mobilize, expedite <strong>and</strong> monitor resources for environmental<br />
management.<br />
National Biodiversity Data Bank (NBDB)<br />
Started with a mission “to inventory <strong>and</strong> monitor national<br />
biological resources <strong>and</strong> to provide biodiversity information<br />
to those interested in the conservation <strong>and</strong> sustainable<br />
utilization of these resources”, the National Biodiversity Data<br />
Bank (NBDB) was established in 1990. This was as a direct<br />
response to conservationists’ need to have readily available<br />
A closed canopy forest, Echuya Forest Reserve<br />
data <strong>and</strong> information regarding the country’s biodiversity, so<br />
as to aid the decision making process within the country.<br />
The unit was established in Makerere University Institute<br />
of Environment <strong>and</strong> Natural Resources (MUIENR) to act<br />
as a central repository for biodiversity information within<br />
Ug<strong>and</strong>a.<br />
The data bank is involved in a number of activities which<br />
include amongst others academic training, capacity<br />
building, NBDB Database development <strong>and</strong> research <strong>and</strong><br />
publications. The data Bank is involved in monitoring of key<br />
species, habitats <strong>and</strong> biodiversity indicators. The publications<br />
include production of Ug<strong>and</strong>a’s State of Biodiversity Report<br />
as a continuous biennial output <strong>and</strong> publishing results of<br />
various data analyses in peer-reviewed journals.<br />
NBDB collaborates with NEMA, <strong>Nature</strong>Ug<strong>and</strong>a, Wildlife<br />
Conservation Society (WCS), World Conservation Union<br />
(IUCN), the Institute of Tropical Forest Conservation (ITFC),<br />
<strong>and</strong> also with other government agencies such as Ug<strong>and</strong>a<br />
Wildlife Authority (UWA), the National Forestry Authority<br />
(NFA), the Wetl<strong>and</strong>s Management Department (WMD)<br />
<strong>and</strong> various research organizations. It also collaborates<br />
with various major institutions such as Departments of<br />
Botany <strong>and</strong> Zoology including the Botanical Herbarium <strong>and</strong><br />
Zoological Museum; the Faculty of Forestry <strong>and</strong> <strong>Nature</strong><br />
Conservation (FFNC), the Department of Wildlife <strong>and</strong> Animal<br />
Resources Management (WARM).<br />
17<br />
17
Appendices<br />
Appendix 1: List of threats <strong>2009</strong><br />
Site<br />
Code<br />
UG001 Mgahinga Gorilla<br />
National Park<br />
UG002 Echuya Forest<br />
Reserve<br />
UG003 Nyamuriro<br />
Swamp<br />
UG004 Bwindi<br />
Impenetrable<br />
National Park<br />
UG005 Rwenzori<br />
Mountains<br />
National Park<br />
UG006 Kibale National<br />
Park<br />
UG007 Queen Elizabeth<br />
National Park<br />
UG008 Kyambura<br />
Wildlife Reserve<br />
UG009 Semliki National<br />
Park<br />
Site Name Agricultural<br />
intensification/<br />
shifting<br />
agriculture<br />
Burning<br />
of<br />
vegetation<br />
Nomadic<br />
grazing<br />
/ livestock<br />
grazing<br />
Use of<br />
agrochemicals<br />
Proliferation<br />
of<br />
flower<br />
farms<br />
Construction<br />
of<br />
barrages<br />
Allien<br />
species /<br />
invasive<br />
species<br />
Extraction<br />
industry/<br />
mining/<br />
quarrying/brick<br />
making<br />
Colonization/<br />
habitat<br />
change<br />
Oil<br />
exploration<br />
Deforestation<br />
Disturbance<br />
to<br />
birds<br />
Drainage/<br />
filling of<br />
swamp/<br />
silting<br />
2<br />
8<br />
6<br />
6<br />
7<br />
7<br />
8<br />
3<br />
10<br />
Water<br />
abstraction<br />
Firewood<br />
collection/<br />
Charcoal<br />
burning<br />
Industries/<br />
urbanization/<br />
infrastructure/<br />
housing<br />
Natural<br />
events/<br />
floods/<br />
l<strong>and</strong>slides/<br />
drought<br />
Recreation/<br />
tourism<br />
expansion<br />
Selective<br />
cutting/<br />
logging<br />
Resource<br />
harvesting/<br />
exploitation/<br />
medicine/<br />
bamboo<br />
Bird<br />
persecution<br />
Over<br />
fishing<br />
Egg<br />
collection<br />
Consumptive<br />
utilization<br />
Pollution<br />
Power<br />
line/<br />
transport<br />
way<br />
Total<br />
UG010 Semliki Reserves 6<br />
UG011 Lake Mburo<br />
National Park<br />
UG012 Mabira Forest<br />
Reserves<br />
9<br />
6<br />
UG013 Sango Bay Area 6<br />
UG014 Musambwa<br />
Isl<strong>and</strong>s<br />
3<br />
UG015 Lutoboka Point,<br />
Ssese Isl<strong>and</strong>s<br />
UG016 Nabugabo<br />
Wetl<strong>and</strong><br />
8<br />
UG017 Mabamba Bay 7<br />
18
Site<br />
Code<br />
Site Name Agricultural<br />
intensification/<br />
shifting<br />
agriculture<br />
Burning<br />
of<br />
vegetation<br />
Nomadic<br />
grazing<br />
/ livestock<br />
grazing<br />
Use of<br />
agrochemicals<br />
Proliferation<br />
of<br />
flower<br />
farms<br />
Construction<br />
of<br />
barrages<br />
Allien<br />
species /<br />
invasive<br />
species<br />
Extraction<br />
industry/<br />
mining/<br />
quarrying/brick<br />
making<br />
Colonization/<br />
habitat<br />
change<br />
Oil<br />
exploration<br />
Deforestation<br />
Disturbance<br />
to<br />
birds<br />
Drainage/<br />
filling of<br />
swamp/<br />
silting<br />
Water<br />
abstraction<br />
Firewood<br />
collection/<br />
Charcoal<br />
burning<br />
Industries/<br />
urbanization/<br />
infrastructure/<br />
housing<br />
Natural<br />
events/<br />
floods/<br />
l<strong>and</strong>slides/<br />
drought<br />
Recreation/<br />
tourism<br />
expansion<br />
Selective<br />
cutting/<br />
logging<br />
Resource<br />
harvesting/<br />
exploitation/<br />
medicine/<br />
bamboo<br />
Bird<br />
persecution<br />
Over<br />
fishing<br />
Egg<br />
collection<br />
Consumptive<br />
utilization<br />
Pollution<br />
Power<br />
line/<br />
transport<br />
way<br />
Total<br />
UG018 Lutembe Bay 12<br />
UG019 Budongo Foerest<br />
Reserve<br />
UG020 Murchison Falls<br />
National Park<br />
UG021 Ajai Wildlife<br />
Reserve<br />
UG022 Mount kei Forest<br />
Reserve<br />
UG023 Mount Otzi<br />
Forest Reserve<br />
UG024 Doho Rice<br />
Scheme<br />
11<br />
6<br />
8<br />
7<br />
5<br />
7<br />
UG025 Lake Nakuwa<br />
UG026 Lake Bisina 6<br />
UG027 Lake Opeta 5<br />
UG028 Mount Elgon<br />
National Park<br />
UG029 Mount Moroto<br />
Forest Reserve<br />
UG030 Kidepo Valley<br />
National Park<br />
UG031 Nabajjuzi<br />
Wetl<strong>and</strong><br />
UG032 Kasyoha - Kitomi<br />
Forest Reserve<br />
UG033 Bugoma Central<br />
Forest Reserve<br />
9<br />
6<br />
8<br />
8<br />
6<br />
5<br />
Total 17 26 21 3 1 2 9 8 4 1 8 5 6 4 22 6 4 9 6 28 2 11 2 2 1 3 211<br />
% 55 84 68 10 3 6 29 26 13 3 26 16 19 13 71 19 13 29 19 90 6 35 6 6 3 10<br />
19
Appendix 2: IBA monitoring Form<br />
<strong>Nature</strong>Ug<strong>and</strong>a<br />
The East Africa Natural History Society<br />
P.O Box 27034, Kampala<br />
Telepone: +256 414 540719<br />
E-mail nature@natureug<strong>and</strong>a.org<br />
Important Bird Area Monitoring Programme for Ug<strong>and</strong>a<br />
Help to monitor Important Bird Areas – Key sites for biodiversity conservation!<br />
<strong>Nature</strong>Ug<strong>and</strong>a<br />
The East Africa Natural History Society<br />
Please answer the questions below <strong>and</strong> attach any additional information as indicated in the<br />
circulated guidelines herewith. Please give details <strong>and</strong> quantify changes wherever possible. All<br />
information is helpful, at any time. However, if you are resident at site or regular visitor, please try to<br />
return a completed form once every year.<br />
Please return the completed form to <strong>Nature</strong>Ug<strong>and</strong>a or Ug<strong>and</strong>a Wildlife Authority or NBDB<br />
(MUIENR) at the address below (pg 5) or by e-mail. An e-mail version of this form is available – if you<br />
would like to use this, please request one from <strong>Nature</strong>Ug<strong>and</strong>a.<br />
Fundamental <strong>and</strong>/or vital information: (Please use a different form for each site)<br />
(1). Name of the IBA ________________________________________________________________<br />
(2).Today’s date___________________________________________________<br />
(3). Your name:_________________________________ (4). Your Contacts: Postal address:<br />
__________________________________________________________________________________<br />
Telephone/fax:_________________<br />
E-mail address_____________________________________<br />
(5). What IBA area coverage does this form address (Tick one box)<br />
(a) the whole IBA<br />
(b) just part of the IBA<br />
If (b), which part / how much of the whole area<br />
__________________________________________________________________________<br />
(6) Are you resident at the IBA (a) Yes (b) No<br />
If (b), what was the date <strong>and</strong> duration of<br />
the visit (s) you are reporting on<br />
What was the reason for your visit (s)<br />
__________________________________________________________________________________<br />
(7) Please summarize the current status of the natural habitat in the IBA, based on your<br />
observations <strong>and</strong> information by circling a score from 1 to 4 below:<br />
1. Largely intact <strong>and</strong> undisturbed<br />
2. Slight decline in habitat area <strong>and</strong> quality<br />
3. Substantial decline in habitat area <strong>and</strong> quality<br />
4. Severe decline in habitat area <strong>and</strong> quality.<br />
__________________________________________________________________________________<br />
(8) Please summarize the level of immediate future threats to the IBA, based on your observations<br />
<strong>and</strong> information by circling a score from 1 to 4 below:<br />
1. No obvious immediate threats<br />
2. Slight<br />
3. Substantial<br />
4. Severe<br />
20
(9) Please give any further information <strong>and</strong> details that you think may be helpful. Please attach or<br />
send more sheets or other documents, reports if necessary. There is no need to answer all the<br />
questions or fill in all the tables – please just put down the information that you have available. If<br />
possible, please attach a map (a copy of the topographical map, or a simple sketch map) showing<br />
the location/extent of the threats/actions that you identify <strong>and</strong> the location of any records.<br />
(a) CURRENT STATUS<br />
(i) General comments<br />
(ii) Please if you have, summarize the information on estimates of bird populations, area of natural<br />
habitats <strong>and</strong> the quality of natural habitats important for bird populations at the IBA.<br />
Bird species or<br />
groups<br />
Population estimate (Individuals<br />
or pairs)<br />
Details/ other comments<br />
Habitat<br />
Area<br />
Quality<br />
Habitat area <strong>and</strong> quality rating:<br />
Good (overall >90% optimum) 4<br />
Moderate (70 – 90%), 3<br />
Poor (40 – 70%) 2<br />
Very poor (< 40%): 1<br />
Note: The percentages are given just as guidelines only: Use your best estimates <strong>and</strong> please justify<br />
your selection in the ‘Detail’ column.<br />
(b) THREATS OR CONSERVATION ISSUES<br />
(i) General comments<br />
(ii) Specific threats: Please assess the timing, scope <strong>and</strong> severity of the threat while using the<br />
scores as given below this table. Please give details or comments to explain your assessment <strong>and</strong><br />
where possible, quantitative information are encouraged. The threats of major concern are those<br />
that may affect the bird species for which the IBA was listed. If you feel necessary, please attach<br />
the details on a separate sheet of paper.<br />
21
Threat class Timing Scope Severity Details<br />
Ab<strong>and</strong>onment/reduction of l<strong>and</strong><br />
management<br />
Agricultural intensification<br />
Aquaculture or fisheries<br />
Burning of vegetation<br />
Nomadic grazing/livestock grazing<br />
Intensive use of agro-chemicals<br />
Proliferation of flower farms<br />
Consequences of animal/plant introductions<br />
Construction/impact of dyke/dam/barrage<br />
Deforestation<br />
Disturbance to birds<br />
Drainage<br />
Dredging/colonization<br />
Extraction industry<br />
Filling in of wetl<strong>and</strong>s<br />
Firewood collection<br />
Forest grazing<br />
Ground water abstraction<br />
Industrial/urbanization/infrastructure<br />
Natural events<br />
Recreation/tourism expansion<br />
Selective logging/cutting<br />
Shifting agriculture<br />
Unsustainable exploitation/Resource<br />
harvesting<br />
Bird persecution<br />
Over fishing<br />
Bird egg collection<br />
Consumptive utilization<br />
Others<br />
Codes:<br />
Timing Scope Severity<br />
Happening now 3 Whole area/population (>90%) 3 Rapid deterioration 3<br />
Likely in short term (4yrs) 2 Most area/population (50-90%) 2 Moderate deterioration 2<br />
Likely in long term (>4yrs) 1 Some of population (10-50%) 1 Slow deterioration 1<br />
Past/no longer limiting 0 Small area/few individuals (
(iii) Specific actions or responses: Please assess each action or response <strong>and</strong> give the major<br />
implementers of the action. Please attach separate sheets if details or comments to explain your<br />
assessment are necessary. Please give quantitative information as far as possible<br />
Action/responses Actions done by: Explanation/details<br />
LCG NU Gov’t Other<br />
(specify)<br />
Site/area protection<br />
Resource/habitat protection<br />
Establishment of local conservation groups<br />
Development of site action plan<br />
General management <strong>and</strong> policing<br />
Policies <strong>and</strong> regulations<br />
Invasive or problematic species control<br />
Education <strong>and</strong> awareness<br />
Capacity building<br />
Resource use controls / quotas<br />
Eco-tourism initiatives<br />
Provision of alternative products<br />
Promotion of non monetary values<br />
Partnership development<br />
Surveys <strong>and</strong> research<br />
Conservation projects/actions implemented<br />
Advocacy/interventions for site<br />
Publicity generated for site<br />
Environmental impact assessment<br />
Mitigation measures implemented<br />
Other (Specify)<br />
(d) INTERESTING RECORDS<br />
(i) Staffs, visitors <strong>and</strong> revenues from particular area or site<br />
Particulars Number or amount Comments<br />
Staffs <strong>and</strong> volunteers<br />
Visitors<br />
Revenues generated<br />
(ii) Interesting bird records, population estimates, lists or other details<br />
Bird Species or group<br />
Population<br />
estimate<br />
Details<br />
(iii) Records, population estimates, lists or details for other fauna <strong>and</strong> flora<br />
Species or group<br />
Population<br />
estimate<br />
Details<br />
(iv) Useful contacts (for research projects, site conservation groups, tourism initiatives etc.).<br />
Name Postal Telephone Email<br />
(e) OTHER NOTES<br />
23
APPENDIX 3 LIST OF CONTRIBUTORS<br />
Richard Muhabwe - Kibale NP<br />
Kaphu George - Murchison Falls<br />
Taban Bruhan - Murchison Falls<br />
Ahimbisibwe Milka - Semliki WR<br />
Matsiko Moses - Lake Mburo NP<br />
Opeto Andrew - Lake Mburo NP<br />
Dhiwerara Samson - Semliki NP<br />
Adaraku Robert – Queen Elizabeth NP<br />
Tinyebwa Ronald - Kibale NP<br />
Rwamuh<strong>and</strong>a Levi - Mghahinga NP<br />
Okiring David - Kidepo NP<br />
Kato R Raymond - Kidepo NP<br />
Seguya Henry Kizito - Musambwa Isl<strong>and</strong>s<br />
Polycarp M Mwima - ECOTRUST<br />
Julius Obwona - Ajai Wildlife Reserve<br />
Niwamanya Rogers - Kasyoha – Kitomi<br />
Jimmy Muhebwa M - Nyamuriro<br />
Zeneb Musiimire - Echuya FR<br />
Robson Kato - Kyambura WR<br />
Achoroi JP - Queen Elizabeth NP<br />
Ada Nshemereirwe - Nabajjuzi Wetl<strong>and</strong><br />
Guma Gard - Bugoma FR<br />
Avako Norah - Mt. Kei FR<br />
Mwesiga Patrick - Mt. Kei FR<br />
Jennifer Atuhairwe - Bwindi Imp NP<br />
Amadra Sabino - Mt. Otzi FR<br />
Kirasi Simon - Echuya FR<br />
Achuu Simon - Lake Bisina<br />
Masereka Alfred - MRNP<br />
Biira Sadress - MRNP<br />
Makatu Patrick - MENP<br />
Jolly -<br />
Mabira FR<br />
Frank Walsh - Mt. Kei FR<br />
Gafabusa Vincent - Budongo FR<br />
Bihanikire Shem - Semliki NP<br />
Benjamín Kennedy - Semliki WR<br />
Odongkara JB - Mt. Moroto FR<br />
Professer Derek E Pomeroy - MUIENR<br />
24
FURTHER READING<br />
Bennun L (2002)<br />
Monitoring Important Bird Areas in Africa: A regional Framework,<br />
BirdLife International Cambridge.<br />
Birdlife International (2004). The conservation Program of BirdLife International Africa<br />
Partnership 2004 – 2008. BirdLife International, Cambridge, UK.<br />
Birdlife International (2005) Strategy for Conservation <strong>and</strong> Sustainable Management<br />
of Important Bird Areas in Africa 2005 – 2015. BirdLife<br />
International, Cambridge, UK.<br />
BirdLife International (2006) Monitoring Important Bird Areas: A global framework.<br />
Cambridge, UK BirdLife International. (Compiled by Leon Bennun,<br />
Ian Burfield, Lincoln Fishpool, Szabolcs Nagy <strong>and</strong> Alison<br />
Stattersfield).<br />
BirdLife International (2007): Conserving Biodiversity in Africa: Guidelines for Applying<br />
the Site Support Group Approach. ICIPE Science Press, Nairobi,<br />
Kenya.<br />
BirdLife International (2008) Toolkit for Important Bird Area Conservation in Africa,<br />
Nairobi, Kenya: BirdLife International 84pp.<br />
Byaruhanga A. Pomeroy D. E. Kasoma P M (2001) Important Bird Areas of Ug<strong>and</strong>a,<br />
<strong>Nature</strong>Ug<strong>and</strong>a, The East Africa Natural History Society<br />
Fishpool L. D. C <strong>and</strong> Evans I. Michael (2001) Important Bird Areas in Africa <strong>and</strong><br />
Associated Isl<strong>and</strong>s- Priority Areas for Conservation<br />
<strong>Nature</strong>Ug<strong>and</strong>a (<strong>2009</strong>). Important Bird Areas in Ug<strong>and</strong>a, <strong>Status</strong> <strong>and</strong> <strong>Trends</strong> Report of<br />
2008 assessment.<br />
WMD/NU (2008)<br />
Implementing the Ramsar Convention in Ug<strong>and</strong>a – A guide to the<br />
management of Ramsar Sites in Ug<strong>and</strong>a. WMD, Kampala<br />
Ug<strong>and</strong>a <strong>and</strong> <strong>Nature</strong>Ug<strong>and</strong>a.<br />
25
Published by<br />
<strong>Nature</strong>Ug<strong>and</strong>a<br />
P.O.Box 27034,<br />
Kampala Ug<strong>and</strong>a<br />
Plot 83 Tufnel Drive<br />
Kamwokya.<br />
Email nature@natureug<strong>and</strong>a.org<br />
Website: www.natureug<strong>and</strong>a.org