Self Study - Maharishi University of Management
Self Study - Maharishi University of Management
Self Study - Maharishi University of Management

You also want an ePaper? Increase the reach of your titles
YUMPU automatically turns print PDFs into web optimized ePapers that Google loves.
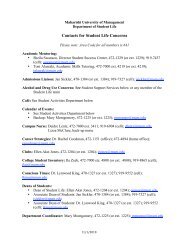
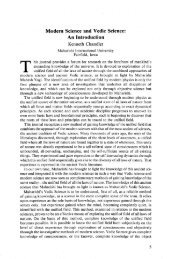
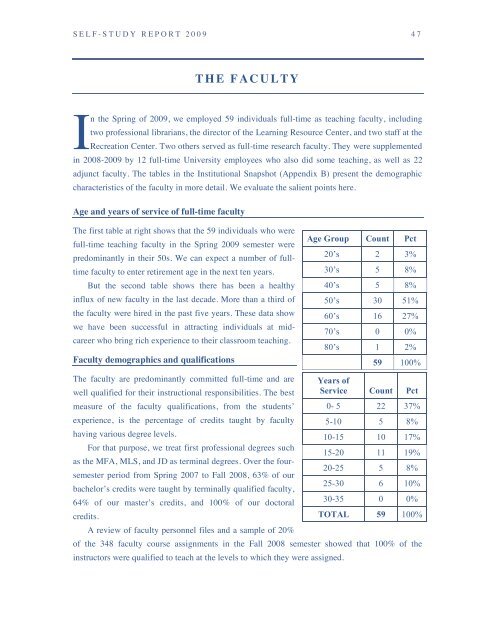
S E L F - S T U D Y R E P O R T 2 0 0 9 47<br />
T H E F A C U L TY<br />
I<br />
n the Spring <strong>of</strong> 2009, we employed 59 individuals full-time as teaching faculty, including<br />
two pr<strong>of</strong>essional librarians, the director <strong>of</strong> the Learning Resource Center, and two staff at the<br />
Recreation Center. Two others served as full-time research faculty. They were supplemented<br />
in 2008-2009 by 12 full-time <strong>University</strong> employees who also did some teaching, as well as 22<br />
adjunct faculty. The tables in the Institutional Snapshot (Appendix B) present the demographic<br />
characteristics <strong>of</strong> the faculty in more detail. We evaluate the salient points here.<br />
Age and years <strong>of</strong> service <strong>of</strong> full-time faculty<br />
The first table at right shows that the 59 individuals who were<br />
full-time teaching faculty in the Spring 2009 semester were<br />
predominantly in their 50s. We can expect a number <strong>of</strong> fulltime<br />
faculty to enter retirement age in the next ten years.<br />
But the second table shows there has been a healthy<br />
influx <strong>of</strong> new faculty in the last decade. More than a third <strong>of</strong><br />
the faculty were hired in the past five years. These data show<br />
we have been successful in attracting individuals at midcareer<br />
who bring rich experience to their classroom teaching.<br />
Faculty demographics and qualifications<br />
The faculty are predominantly committed full-time and are<br />
well qualified for their instructional responsibilities. The best<br />
measure <strong>of</strong> the faculty qualifications, from the students’<br />
experience, is the percentage <strong>of</strong> credits taught by faculty<br />
having various degree levels.<br />
For that purpose, we treat first pr<strong>of</strong>essional degrees such<br />
as the MFA, MLS, and JD as terminal degrees. Over the foursemester<br />
period from Spring 2007 to Fall 2008, 63% <strong>of</strong> our<br />
bachelor’s credits were taught by terminally qualified faculty,<br />
64% <strong>of</strong> our master’s credits, and 100% <strong>of</strong> our doctoral<br />
credits.<br />
A review <strong>of</strong> faculty personnel files and a sample <strong>of</strong> 20%<br />
<strong>of</strong> the 348 faculty course assignments in the Fall 2008 semester showed that 100% <strong>of</strong> the<br />
instructors were qualified to teach at the levels to which they were assigned.<br />
Age Group Count Pct<br />
20’s 2 3%<br />
30’s 5 8%<br />
40’s 5 8%<br />
50’s 30 51%<br />
60’s 16 27%<br />
70’s 0 0%<br />
80’s 1 2%<br />
59 100%<br />
Years <strong>of</strong><br />
Service Count Pct<br />
0- 5 22 37%<br />
5-10 5 8%<br />
10-15 10 17%<br />
15-20 11 19%<br />
20-25 5 8%<br />
25-30 6 10%<br />
30-35 0 0%<br />
TOTAL 59 100%