Continued strong performance - Comrod
Continued strong performance - Comrod
Continued strong performance - Comrod

You also want an ePaper? Increase the reach of your titles
YUMPU automatically turns print PDFs into web optimized ePapers that Google loves.
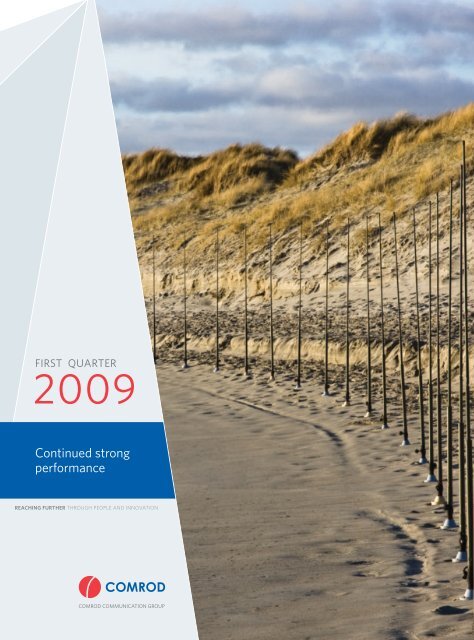
FIRST QUARTER<br />
2009<br />
<<strong>strong</strong>>Continued</<strong>strong</strong>> <strong>strong</strong><br />
<strong>performance</strong><br />
REACHING FURTHER THROUGH PEOPLE AND INNOVATION<br />
COMROD COMMUNICATION GROUP
Highlights since Q4 reporting:<br />
• Improved quarterly EBIT%<br />
• Strong development from business areas antennas and power.<br />
• <strong>Comrod</strong> UK secures order for UK Defence forces.<br />
• First USA order for antenna control systems.<br />
• HF Loop antenna order to US Army.<br />
THE GROUP<br />
<strong>Comrod</strong> Communication Group continues in Q1 the positive<br />
development from previous quarters.<br />
Business Area Antennas shows a <strong>strong</strong> development. During Q1<br />
Business Area Masts has focused on the start up manufacturing for<br />
deliveries to the MIDS/Terre contract.<br />
First HF Loop antenna order to the US Army program HIMARS.<br />
There are high future expectations to this product. This is another<br />
international technology breakthrough.<br />
Revenues for Q1 of 2009 were MNOK 98.8 (MNOK 100). (Figures<br />
for corresponding period of 2008 will hereafter be shown in<br />
brackets).<br />
Operating profit (EBIT) for Q1 was MNOK 11.5 (MNOK 11.0).<br />
Financial results indicate that the Group has achieved the planned<br />
operational efficiency at the new and higher turnover level, thus<br />
generating sound financial results overall.<br />
BUSINESS AREAS<br />
ANTENNAS<br />
Sales and market<br />
Revenues for Q1 of 2009 were MNOK 74.6 (MNOK 72.5) which is at<br />
a higher level than the record Q1 of 2008.<br />
The recent order from <strong>Comrod</strong> UK to the UK defence forces shows<br />
the strength of having a close presence to the strategic markets.<br />
Production and results<br />
Operating Profit (EBIT) for Q1 was MNOK 13.8 (MNOK 11.9), while<br />
EBIT margin was 18.5% an increase from last years Q1 (16.4%).<br />
<strong>Comrod</strong> in Hungary has in Q1 had a high level of manufacturing. This<br />
has improved the overall margins for the labour intensive antenna<br />
products.<br />
MASTS<br />
Sales and market<br />
Revenues for Q1 of 2009 were MNOK 8.4 (MNOK 14.4).<br />
This is according to expectations and the business area has had full<br />
focus on the ramp-up on deliveries to the MIDS /Terre contract. The<br />
deliveries are scheduled to begin in Q2 and will continue to the year<br />
end.<br />
Production and results<br />
Operating profit (EBIT) for Q1 was minus MNOK 0.6 (MNOK 0.5).<br />
INDUSTRIAL PRODUCTS<br />
Sales and market<br />
Revenues for Q1 of 2009 were MNOK 8.8 (MNOK 8.2).<br />
Production and results<br />
Operating profit (EBIT) for Q1 was MNOK 0.2 (MNOK 0.3).<br />
The Company is currently working with the phase out activities for<br />
the insulator products.<br />
The product range within offshore related applications will<br />
continue, and have the full attention from the organization.<br />
POWER SUPPLY<br />
Sales and market<br />
Revenues for Q1 of 2009 were MNOK 7.0 (MNOK 5.2).<br />
The Business Area is currently in the last stage of developing the<br />
new ComPact. It is expected that the product will be finalised and<br />
ready for deliveries by the end of Q3/beginning of Q4.<br />
Production and results<br />
Operating profit EBIT for Q1 was MNOK 0.9 (MNOK 1.0), a<br />
positive development from previous quarters.<br />
PARENT COMPANY<br />
The operating costs of the parent company amounted to MNOK<br />
2.5 (MNOK 2.1).<br />
GROUP<br />
Total balance sheet at the end of March was MNOK 339.8 (MNOK<br />
358.5 as per 31.12.08), and the equity ratio was 33.4 % (32.4 %).<br />
Group liquidity remains satisfactory.<br />
The Group fulfils financial covenants related to external financing.<br />
OUTLOOK<br />
The Board is satisfied with the revenues in Q1 and the positive EBIT<br />
development of the two Business Areas, Antennas and Power. The<br />
Board expects that the Business Area Masts will improve.<br />
Revenue and EBIT-level variations between quarters can be<br />
expected also in 2009. The Board expects higher revenues and<br />
EBIT for the year 2009 compared to 2008.
OPERATING REVENUE GROUP<br />
NOK Mill.<br />
120,0<br />
OPERATING PROFIT (EBIT) GROUP<br />
NOK Mill.<br />
16,0<br />
OPERATING REVENUES ANTENNAS<br />
NOK Mill.<br />
80,0<br />
72,5 74,6 58,9 58,6<br />
100,0<br />
100,3 98,8<br />
103,6 107,5<br />
14,0<br />
13,6<br />
70,0<br />
69,3 69,9<br />
80,0<br />
81,8<br />
66,3 65,9<br />
79,0<br />
12,0<br />
10,0<br />
11,1 11,5 11,0<br />
60,0<br />
50,0<br />
60,0<br />
54,3<br />
8,0<br />
40,0<br />
38,4<br />
40,0<br />
20,0<br />
2009<br />
2008<br />
2007<br />
6,0<br />
4,0<br />
2,0<br />
5,5<br />
4,6<br />
2,4<br />
5,9<br />
6,3<br />
2009<br />
2008<br />
2007<br />
30,0<br />
20,0<br />
10,0<br />
31,7 31,6<br />
2009<br />
2008<br />
2007<br />
Q1 Q2 Q3 Q4<br />
OPERATING REVENUES MASTS<br />
Q1 Q2 Q3 Q4<br />
OPERATING REVENUES INDUSTRIAL PRODUCTS<br />
Q1 Q2 Q3 Q4<br />
OPERATING REVENUES POWER SUPPLY<br />
NOK Mill.<br />
NOK Mill.<br />
NOK Mill.<br />
20,0<br />
18,0<br />
16,0<br />
14,0<br />
14,4<br />
16,4<br />
15,0<br />
13,8<br />
16,1<br />
19,1<br />
17,2<br />
12,0<br />
10,0<br />
8,0<br />
8,2 8,8<br />
9,3<br />
10,1 10,3<br />
10,0<br />
9,0<br />
8,0<br />
7,0<br />
8,7<br />
7,0<br />
9,0<br />
7,2<br />
8,5 8,8<br />
12,0<br />
10,0<br />
8,0<br />
6,9<br />
8,4<br />
6,0<br />
4,0<br />
7,0<br />
6,7<br />
6,6<br />
4,1<br />
6,0<br />
5,0<br />
4,0<br />
5,2<br />
6,0<br />
2009<br />
2009<br />
3,0<br />
2,7<br />
2009<br />
4,0<br />
2,0<br />
2008<br />
2007<br />
2,0<br />
2008<br />
2007<br />
2,0<br />
1,0<br />
1,4<br />
2008<br />
2007<br />
Q1 Q2 Q3 Q4<br />
Q1 Q2 Q3 Q4<br />
Q1 Q2 Q3 Q4<br />
(NOK 1000) Q1 2009 Q1 2008 31.12.2008<br />
Unaudited Unautited Audited<br />
CONSOLIDATED INCOME STATEMENT<br />
Operating revenues 98 766 100 329 368 631<br />
Cost of materials 35 279 37 939 143 700<br />
Payroll expenses 32 478 33 201 128 161<br />
Other operating expenses 15 302 14 741 52 417<br />
Operating profit before depreciation (EBITDA) 15 707 14 449 44 353<br />
EBITDA-margin 16% 14% 12%<br />
Depreciation 4 161 3 394 13 610<br />
Operating profit (EBIT) 11 546 11 055 30 743<br />
EBIT-margin 12% 11% 8%<br />
Net financial items 2 264 (1 739) (15 682)<br />
Profit/loss before tax 13 810 9 316 15 061<br />
Tax (3 953) (2 943) (4 604)<br />
Profit/(loss) 9 858 6 373 10 457<br />
Attributable to:<br />
Equity holders of the parent 9 876 6 483 10 812<br />
Minority interests (18) (111) (355)<br />
CONSOLIDATED BALANCE SHEET<br />
Intangible assets 85 632 72 859 90 362<br />
Tangible fixed assets 85 609 62 880 85 652<br />
Financial fixed assets 67 61 74<br />
Inventories 76 248 67 808 71 040<br />
Receivables 90 728 105 873 102 382<br />
Bank deposits and cash 1 528 10 455 8 981<br />
Total assets 339 813 319 935 358 492<br />
Paid-in capital 70 254 69 507 70 216<br />
Other equity 43 495 34 209 39 691<br />
Minority interests (199) 63 (181)<br />
Provisions 20 358 18 784 16 914<br />
Interest-bearing long-term liabilities 84 302 75 575 94 124<br />
Interest-bearing current liabilities 38 060 33 702 56 568<br />
Other current liabilities 83 543 88 095 81 161<br />
Total liabilities and equity 339 813 319 935 358 492<br />
CONSOLIDATED CASH FLOW STATEMENT<br />
Profit before tax 13 810 9 316 15 061<br />
Depreciation and write-downs 4 161 3 394 13 610<br />
Other Non cash elements (2 694) 2 006 16 451<br />
Change in net working capital 3 093 263 3 346<br />
Net cash flow from operating activities 18 371 14 979 48 468<br />
Net cash flow from investment activities (8 124) (5 982) (27 846)<br />
Net cash flow from financing activities (17 700) (7 856) (20 954)<br />
Net change in cash and cash equivalents (7 453) 1 141 (333)<br />
Cash and cash equivalents at start of period 8 981 9 314 9 314<br />
Cash and cash equivalents at end of period 1 528 10 455 8 981
(NOK 1000) Q1 2009 Q1 2008 31.12.2008<br />
CONSOLIDATED EQUITY RECONCILIATION<br />
Equity at start of period 109 725 95 045 95 045<br />
Profit/loss in period 9 858 6 373 10 457<br />
Share based payment/Actuarial gain and losses 38 121 1 930<br />
Forward exchange contracts 0 1 102 (190)<br />
Translation effects (6 071) 1 138 12 483<br />
Dividends paid (10 000)<br />
Equity at end of period 113 550 103 779 109 725<br />
KEY FIGURES<br />
Equity ratio 33.4% 32.4% 30.6%<br />
Liquidity ratio I 1.4 1.5 1.3<br />
Return on equity (annualised) 35.3% 25.6% 10.2%<br />
Total return (annualised) 12.9% 5.9% 5.8%<br />
Earnings per share 0.58 0.38 0.62<br />
Diluted earnings per share 0.58 0.38 0.62<br />
Cash flow from operations per share 1.08 0.88 2.86<br />
Equity per share 6.70 6.13 6.48<br />
Net interest-bearing liabilities 120 834 98 822 141 711<br />
INFORMATION ON OPERATING SEGMENTS 1,2)<br />
Antennas<br />
Operating revenues 74 613 72 528 259 601<br />
Operating profit before depreciation (EBITDA) 15 871 13 453 41 687<br />
EBITDA-margin 21% 19% 16%<br />
Operating profit (EBIT) 13 816 11 887 35 389<br />
EBIT-margin 19% 16% 14%<br />
Mast<br />
Operating revenues 8 448 14 439 64 650<br />
Operating profit before depreciation (EBITDA) 94 1 220 12 319<br />
EBITDA-margin 1% 8% 19%<br />
Operating profit (EBIT) (619) 515 9 531<br />
EBIT-margin (7%) 4% 15%<br />
Industrial Products<br />
Operating revenues 8 787 8 183 29 277<br />
Operating profit before depreciation (EBITDA) 1 018 961 1 320<br />
EBITDA-margin 12% 12% 5%<br />
Operating profit (EBIT) 165 266 (1 173)<br />
EBIT-margin 2% 3% (4%)<br />
Power Supply<br />
Operating revenues 6 952 5 179 18 062<br />
Operating profit before depreciation (EBITDA) 1 427 1 452 1 067<br />
EBITDA-margin 21% 28% 6%<br />
Operating profit (EBIT) 892 1 034 (693)<br />
EBIT-margin 13% 20% (4%)<br />
Design by Bouvet. Photo by Per Olav Lundbye and Roy Børkja.<br />
1)<br />
Figures for the business areas do not include elimination of internal sales.<br />
2)<br />
Administration costs incurred in parent company and development costs not related to the operating segments are un-allocated.<br />
NOTES<br />
NOTE 1 REPORTING ENTITY<br />
<strong>Comrod</strong> Communication ASA is a company domiciled in Norway.<br />
The interim financial statements ending on 31 March 2009 comprise<br />
<strong>Comrod</strong> Communication ASA and its subsidiaries (collectively<br />
referred to as the Group).<br />
NOTE 2 SIGNIFICANT ACCOUNTING PRINCIPLES AND<br />
STATEMENT OF COMPLIANCE<br />
The accounting policies applied by the Group in these financial<br />
statements are the same COMROD as those COMMUNICATION applied by the Group for ASA the<br />
year ended 31 December 2008. These interim financial statements<br />
have been prepared in accordance with the International Financial<br />
Reporting Standards (IFRS), IAS 34 Interim Financial Reporting.<br />
These statements do not include all the information required for<br />
full annual financial statements, and should be read in conjunction<br />
with the financial statements of the <strong>Comrod</strong> Communication Group<br />
for the year ended 31 December 2008 and the above mentioned<br />
accounting principles.<br />
NOTE 3 ESTIMATES<br />
The preparation of interim financial statements requires<br />
management to make judgments, estimates and assumptions<br />
which affect the application of accounting policies and the reported<br />
amounts of assets and liabilities, income and expense. Actual results<br />
may differ from these estimates. The significant judgments made<br />
by Fiskåvegen management 1, N-4120 in preparing TAU, these Norway interim financial statements<br />
when Phone applying +47 51 the 74 Group’s 05 00 accounting | Fax +47 policies 51 74 05 and 01 the key sources<br />
of E-mail estimate post@comrod.com<br />
uncertainty are the same as those applied to the<br />
consolidated www.comrod.com financial statements of the Group for the year ended 31<br />
December 2008.<br />
COMROD COMMUNICATION ASA ASA<br />
Fiskåvegen 1, 1, N-4120 TAU, TAU, Norway<br />
Phone Phone +47 +47 51 51 74 74 05 05 00 00 | Fax | Fax +47 +47 51 51 74 74 05 05 01 01<br />
E-mail E-mail post@comrod.com | | www.comrod.com