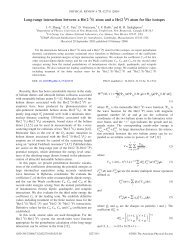
Faculty Satisfaction Graphics Survey Report 2002-2004
Faculty Satisfaction Graphics Survey Report 2002-2004
Faculty Satisfaction Graphics Survey Report 2002-2004

Create successful ePaper yourself
Turn your PDF publications into a flip-book with our unique Google optimized e-Paper software.
TEXAS SOUTHERN UNIVERSITY<br />
<strong>Faculty</strong> <strong>Survey</strong> <strong>Graphics</strong> <strong>Report</strong><br />
Prepared by IE (The Office of Institutional Effectiveness)<br />
3/4/04<br />
This report provides graphical information for demographic items for Texas Southern<br />
University. For all Likert scale items (e.g. 5 point <strong>Satisfaction</strong> scale), data are displayed<br />
with a mean satisfaction score.<br />
For more information about the Registration <strong>Survey</strong> and other Institutional data, contact<br />
the Office of Institutional Effectiveness staff listed below.<br />
Clara Bowman<br />
Research Analyst<br />
bowman_cm@tsu.edu<br />
(713-313-4244)<br />
Raijanel S. Crockem<br />
Records Management Coordinator/ Data Analyst<br />
crockem_rs@tsu.edu<br />
(713-313-1066)<br />
Veon McReynolds, Ph.D.<br />
Interim Director<br />
mcreynolds_vx@tsu.edu<br />
(713-313-7412)<br />
LaShunda Walker<br />
Administrative Assistant<br />
walker_lr@tsu.edu<br />
(713-313-7467)<br />
David Mallett<br />
Research Assistant<br />
mallett_dc@tsu.edu<br />
(713-313-4313)<br />
Gayla B. Thomas, Ph.D.<br />
Senior Vice President, Enrollment Management & Planning
Table of Contents<br />
Figures 1 & 2: Rank 1<br />
Figures 3 & 4:Gender 2<br />
Figures 5 & 6: Tenure Status 2<br />
Figures 7:Teaching Experience 3<br />
Figures 8:Years of Teaching Experience at TSU 3<br />
Figures 9:School or College 4<br />
Figure 10:<strong>Faculty</strong>Use of Technology, Age of PC 5<br />
Figure 11:<strong>Faculty</strong> Use of Technology, Use a PC as an Aid 5<br />
Figure 12: Perceptions of General University Process 6<br />
Figure 13: <strong>Satisfaction</strong> Rating of Services Provided 7<br />
Figure 14: Largest Positive & Largest Negative Differences<br />
of Registration Services and Registration Service Areas<br />
8
Spring <strong>2004</strong> Sample Spring <strong>2004</strong> TSU Population<br />
Other<br />
21%<br />
Prof.<br />
30%<br />
Other<br />
47%<br />
Prof.<br />
22%<br />
Assist.<br />
Prof.<br />
22%<br />
Assoc.<br />
Prof.<br />
27%<br />
Assist.<br />
Prof.<br />
14%<br />
Assoc.<br />
Prof.<br />
17%<br />
Figure 1& 2-Background Information, Current Rank<br />
Rank <strong>2002</strong> 2003 <strong>2004</strong> TSU Total<br />
Population<br />
Percentages<br />
Prof.<br />
25.9 27.4 29.9 21.6<br />
Assoc. Prof. 28.8 26.0 27.1 17.1<br />
Asst. Prof. 20.9 20.5 22.4 13.9<br />
Other 24.4 6.2 20.6 47.4<br />
Total N 152 155 107 490<br />
1
Spring <strong>2004</strong> Sample<br />
Spring <strong>2004</strong> TSU Population<br />
Male<br />
53%<br />
Female<br />
47%<br />
Male<br />
54%<br />
Female<br />
46%<br />
Figure 3 & 4-Background Information, Gender<br />
Gender <strong>2002</strong> 2003 <strong>2004</strong> TSU Total<br />
Population<br />
Percentages<br />
Male 57.7 57.4 52.8 54.5<br />
Female 42.3 42.6 47.2 45.5<br />
Spring <strong>2004</strong> Sample<br />
Spring <strong>2004</strong> TSU Population<br />
Non-ten.<br />
Track<br />
28%<br />
Tenured<br />
53%<br />
Non-ten.<br />
Track<br />
49%<br />
Tenured<br />
40%<br />
Tenure-<br />
Track<br />
19%<br />
Tenure-<br />
Track<br />
11%<br />
Figure 5 & 6-Background Information, Tenure Status<br />
Enrollment Status <strong>2002</strong> 2003 <strong>2004</strong> TSU Total<br />
Population<br />
Percentages<br />
Tenured 60.6 56.1 53.3 40.2<br />
Tenure-Track 18.9 20.3 18.5 10.8<br />
Non-tenured Track 20.5 23.6 28.3 49.0<br />
2
Spring <strong>2004</strong> Sample<br />
20 yrs.<br />
43%<br />
6 to 10<br />
yrs.<br />
15%<br />
11 to 20<br />
yrs.<br />
23%<br />
Figure 7 -Background Information, Teaching Experience<br />
School or College <strong>2002</strong> 2003 <strong>2004</strong><br />
Percentages<br />
Greater than 20 years 40.8 41.3 43.0<br />
11 to 20 years 27.0 17.4 22.8<br />
6 to 10 years 17.8 20.6 14.9<br />
5 or Less years 14.4 20.6 19.3<br />
Spring <strong>2004</strong> Sample<br />
20 yrs.<br />
38%<br />
6 to 10<br />
yrs.<br />
18%<br />
11 to 20<br />
yrs.<br />
18%<br />
Figure 8 -Background Information, Years of Service at TSU<br />
School or College <strong>2002</strong> 2003 <strong>2004</strong><br />
Percentages<br />
Greater than 20 years 34.4 31.6 37.7<br />
11 to 20 years 27.8 18.1 18.3<br />
6 to 10 years 15.9 17.4 17.5<br />
5 or Less years 21.9 32.9 26.3<br />
3
Spring <strong>2004</strong> Sample<br />
F<br />
G<br />
A<br />
E<br />
D<br />
C<br />
B<br />
Figure 9-Background Information, School or College<br />
School or College <strong>2002</strong> 2003 <strong>2004</strong><br />
Percentages<br />
A. Liberal Arts & Behavioral Sciences 31.3 36.1 36.5<br />
B. Education 19.3 11.6 23.1<br />
C. Pharmacy & Health Science 12.7 10.9 5.8<br />
D. Business 6.7 12.9 7.7<br />
E. Law 7.3 8.2 1.9<br />
F. Science & Technology 22.7 20.4 24.0<br />
G. Public Affairs 1.0<br />
4
Spring <strong>2004</strong> Sample<br />
D<br />
A<br />
C<br />
B<br />
Figure 10-<strong>Faculty</strong> Use of Technology, Age of PC<br />
Age of PC <strong>2002</strong> 2003 <strong>2004</strong><br />
Percentages<br />
A. >1 year 46.7 34.7 38.0<br />
B. More than one but less than 3 24.4 23.7 17.4<br />
C. More than 3 but less than 5 13.3 17.8 18.5<br />
D. More than 5 46.7 34.7 38.0<br />
Figure 11-<strong>Faculty</strong> Use of Technology, Use of PC as a Teaching Aid<br />
100%<br />
88%<br />
80%<br />
78% 78%<br />
60%<br />
40%<br />
20%<br />
<strong>2002</strong> 2003 <strong>2004</strong><br />
5
100.00<br />
80.00<br />
60.00<br />
<strong>2002</strong><br />
2003<br />
<strong>2004</strong><br />
40.00<br />
20.00<br />
43 67 42b 42a 41 18 38 14 20 12<br />
Figure 12-Perceptions of General University Processes, <strong>Faculty</strong> Indicating<br />
Agreement With Statement<br />
Item <strong>2002</strong> 2003 <strong>2004</strong><br />
Top 5 Mean Ratings<br />
Percentages<br />
43 <strong>Faculty</strong> Input Important at Departmental Level 87.5 93.9 89.8<br />
67 Familiarity with President’s 5 Vision Points 1 60.7 77.7 89.7<br />
42b <strong>Faculty</strong> Input Important at Dean Level 85.4 93.9 83.6<br />
42a <strong>Faculty</strong> Input Important at Provost 69.8 85.4 71.8<br />
41 <strong>Faculty</strong> Input Important at Executive Level 64.6 82.3 71.3<br />
Bottom 5 Mean Ratings<br />
18 Planning Process Encourages Participation 59.4 60.4 66.1<br />
38 <strong>Faculty</strong> Assembly Influential In Institutional Policy 39.8 57.9 63.1<br />
14 <strong>Faculty</strong> Informed About Major Issues 47.6 62.5 57.3<br />
20 Consistently Informed About Institutional Policy 46.2 58.3 51.9<br />
12 Budget Allocations Adequate 19.5 23.8 22.4<br />
∂<br />
The response categories were: very familiar, familiar, and unfamiliar. Percents reported here represent the<br />
combined responses to “very familiar” and “familiar”.<br />
6
5.00<br />
4.00<br />
3.00<br />
<strong>2002</strong><br />
2003<br />
<strong>2004</strong><br />
2.00<br />
1.00<br />
27 26 25 24 32c 32d 23 30 29 31<br />
Figure 13-<strong>Satisfaction</strong> Ratings of Services Provided by TSU<br />
Item <strong>2002</strong> 2003 <strong>2004</strong><br />
Top 5 Mean Ratings<br />
Mean Rating<br />
27 School or College Administration <strong>Satisfaction</strong> 3.67 3.58 3.67<br />
26 Departmental Administration <strong>Satisfaction</strong> 3.73 3.84 3.59<br />
25 Departmental Curriculum Planning <strong>Satisfaction</strong> 3.62 3.61 3.50<br />
24 Library Services <strong>Satisfaction</strong>: Hours of Operation-Staff-etc. 3.54 3.55 3.50<br />
32c Services Provided During: Registration 3.10 3.31 3.42<br />
Bottom 5 Mean Ratings<br />
32d Services Provided By: Records Maintenance Functions 3.13 3.26 3.21<br />
23 Library Resources <strong>Satisfaction</strong>: ERIC-Journals-etc. 3.03 3.16 3.16<br />
30 Overall Maintenance of Buildings & Grounds <strong>Satisfaction</strong> 2.79 3.01 2.75<br />
29 Maintenance of Classrooms & Labs <strong>Satisfaction</strong> 2.81 2.88 2.69<br />
31 Availability of State of The Art Technology <strong>Satisfaction</strong> 2.43 2.57 2.59<br />
7
1.00<br />
0.50<br />
0.00<br />
26 25 29 24 30 23 28 31 32a 32c<br />
-0.50<br />
-1.00<br />
Figure 14- Largest Positive & Largest Negative Differences of<br />
Registration Services and Registration Service Areas<br />
Item <strong>2002</strong> 2003 <strong>2004</strong><br />
Largest Positive (or Smallest Negative) Differences<br />
Mean Rating<br />
26 Departmental Administration <strong>Satisfaction</strong> 3.73 3.84 3.59<br />
25 Departmental Curriculum Planning <strong>Satisfaction</strong> 3.62 3.61 3.5<br />
29 Maintenance of Classrooms & Labs <strong>Satisfaction</strong> 2.81 2.88 2.69<br />
24 Library Services <strong>Satisfaction</strong>: Hours of Operation-Staff-etc. 3.54 3.55 3.5<br />
30 Overall Maintenance of Buildings & Grounds <strong>Satisfaction</strong> 2.79 3.01 2.75<br />
Largest Negative (or Smallest Positive) Differences<br />
23 Library Resources <strong>Satisfaction</strong>: ERIC-Journals-etc. 3.03 3.16 3.16<br />
28 Central Administration <strong>Satisfaction</strong> 3.10 3.34 3.24<br />
31 Availability of State of The Art Technology <strong>Satisfaction</strong> 2.43 2.57 2.59<br />
32a Services Provided By: Recruitment 3.14 3.26 3.41<br />
32c Services Provided During: Registration 3.10 3.31 3.42<br />
8