Lab Report Format
Lab Report Format
Lab Report Format

You also want an ePaper? Increase the reach of your titles
YUMPU automatically turns print PDFs into web optimized ePapers that Google loves.
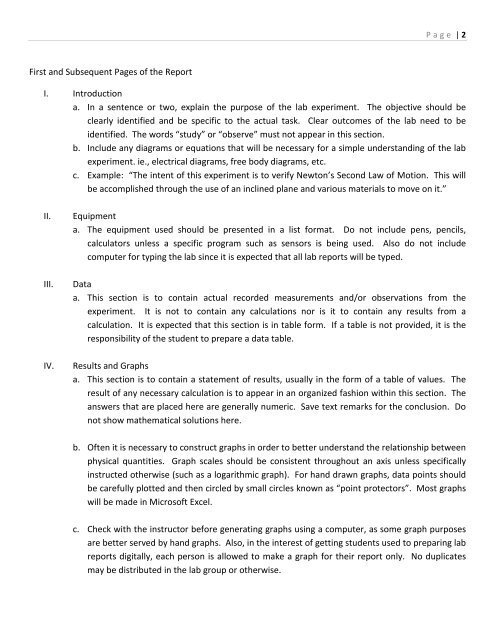
Page | 2<br />
First and Subsequent Pages of the <strong>Report</strong><br />
I. Introduction<br />
a. In a sentence or two, explain the purpose of the lab experiment. The objective should be<br />
clearly identified and be specific to the actual task. Clear outcomes of the lab need to be<br />
identified. The words “study” or “observe” must not appear in this section.<br />
b. Include any diagrams or equations that will be necessary for a simple understanding of the lab<br />
experiment. ie., electrical diagrams, free body diagrams, etc.<br />
c. Example: “The intent of this experiment is to verify Newton’s Second Law of Motion. This will<br />
be accomplished through the use of an inclined plane and various materials to move on it.”<br />
II.<br />
III.<br />
IV.<br />
Equipment<br />
a. The equipment used should be presented in a list format. Do not include pens, pencils,<br />
calculators unless a specific program such as sensors is being used. Also do not include<br />
computer for typing the lab since it is expected that all lab reports will be typed.<br />
Data<br />
a. This section is to contain actual recorded measurements and/or observations from the<br />
experiment. It is not to contain any calculations nor is it to contain any results from a<br />
calculation. It is expected that this section is in table form. If a table is not provided, it is the<br />
responsibility of the student to prepare a data table.<br />
Results and Graphs<br />
a. This section is to contain a statement of results, usually in the form of a table of values. The<br />
result of any necessary calculation is to appear in an organized fashion within this section. The<br />
answers that are placed here are generally numeric. Save text remarks for the conclusion. Do<br />
not show mathematical solutions here.<br />
b. Often it is necessary to construct graphs in order to better understand the relationship between<br />
physical quantities. Graph scales should be consistent throughout an axis unless specifically<br />
instructed otherwise (such as a logarithmic graph). For hand drawn graphs, data points should<br />
be carefully plotted and then circled by small circles known as “point protectors”. Most graphs<br />
will be made in Microsoft Excel.<br />
c. Check with the instructor before generating graphs using a computer, as some graph purposes<br />
are better served by hand graphs. Also, in the interest of getting students used to preparing lab<br />
reports digitally, each person is allowed to make a graph for their report only. No duplicates<br />
may be distributed in the lab group or otherwise.