The Role and Scope of Private Medical Practice in China
The Role and Scope of Private Medical Practice in China
The Role and Scope of Private Medical Practice in China

Create successful ePaper yourself
Turn your PDF publications into a flip-book with our unique Google optimized e-Paper software.
Chapter 2. Methodology<br />
Guangdong, situated <strong>in</strong> the southern-most coastal region <strong>of</strong> Ch<strong>in</strong>a, has the<br />
dist<strong>in</strong>ction <strong>of</strong> be<strong>in</strong>g one <strong>of</strong> two prov<strong>in</strong>ces that were first opened to foreign direct<br />
<strong>in</strong>vestments <strong>in</strong> 1980, <strong>and</strong> host<strong>in</strong>g three <strong>of</strong> Ch<strong>in</strong>a’s four special economic zones. Its<br />
high degree <strong>of</strong> autonomy to h<strong>and</strong>le its own economic affairs has enabled it to surge<br />
ahead <strong>of</strong> others economically.<br />
Shanxi is a l<strong>and</strong>locked prov<strong>in</strong>ce noted for its coal <strong>and</strong> electric power <strong>in</strong>dustry,<br />
situated along the middle reaches <strong>of</strong> the Yellow River <strong>in</strong> the western part <strong>of</strong> north<br />
Ch<strong>in</strong>a, while Sichuan is a largely agricultural prov<strong>in</strong>ce located <strong>in</strong> the Upper Yangtze<br />
Valley <strong>in</strong> the southwestern part <strong>of</strong> the country.<br />
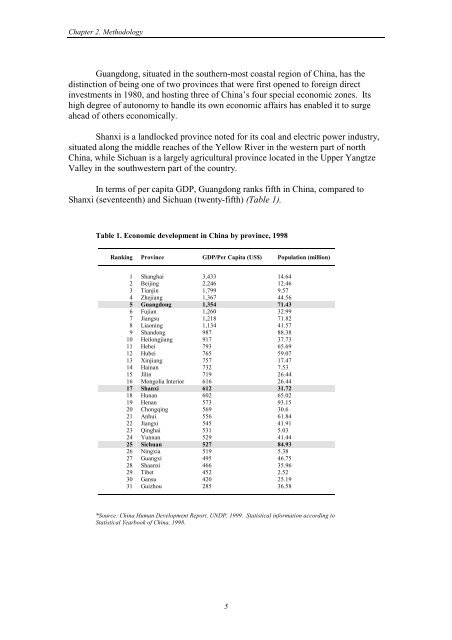
In terms <strong>of</strong> per capita GDP, Guangdong ranks fifth <strong>in</strong> Ch<strong>in</strong>a, compared to<br />
Shanxi (seventeenth) <strong>and</strong> Sichuan (twenty-fifth) (Table 1).<br />
Table 1. Economic development <strong>in</strong> Ch<strong>in</strong>a by prov<strong>in</strong>ce, 1998<br />
Rank<strong>in</strong>g Prov<strong>in</strong>ce GDP/Per Capita (US$) Population (million)<br />
1 Shanghai 3,433 14.64<br />
2 Beij<strong>in</strong>g 2,246 12.46<br />
3 Tianj<strong>in</strong> 1,799 9.57<br />
4 Zhejiang 1,367 44.56<br />
5 Guangdong 1,354 71.43<br />
6 Fujian 1,260 32.99<br />
7 Jiangsu 1,218 71.82<br />
8 Liaon<strong>in</strong>g 1,134 41.57<br />
9 Sh<strong>and</strong>ong 987 88.38<br />
10 Heilongjiang 917 37.73<br />
11 Hebei 793 65.69<br />
12 Hubei 765 59.07<br />
13 X<strong>in</strong>jiang 757 17.47<br />
14 Ha<strong>in</strong>an 732 7.53<br />
15 Jil<strong>in</strong> 719 26.44<br />
16 Mongolia Interior 616 26.44<br />
17 Shanxi 612 31.72<br />
18 Hunan 602 65.02<br />
19 Henan 573 93.15<br />
20 Chongq<strong>in</strong>g 569 30.6<br />
21 Anhui 556 61.84<br />
22 Jiangxi 545 41.91<br />
23 Q<strong>in</strong>ghai 531 5.03<br />
24 Yunnan 529 41.44<br />
25 Sichuan 527 84.93<br />
26 N<strong>in</strong>gxia 519 5.38<br />
27 Guangxi 495 46.75<br />
28 Shaanxi 466 35.96<br />
29 Tibet 452 2.52<br />
30 Gansu 420 25.19<br />
31 Guizhou 285 36.58<br />
*Source: Ch<strong>in</strong>a Human Development Report, UNDP, 1999. Statistical <strong>in</strong>formation accord<strong>in</strong>g to<br />
Statistical Yearbook <strong>of</strong> Ch<strong>in</strong>a, 1998.<br />
5