Nuveen Fact Sheets - COUNTRY Financial
Nuveen Fact Sheets - COUNTRY Financial
Nuveen Fact Sheets - COUNTRY Financial

Create successful ePaper yourself
Turn your PDF publications into a flip-book with our unique Google optimized e-Paper software.
Mutual Funds<br />
NUVEEN DIVIDEND VALUE FUND +<br />
Formerly the <strong>Nuveen</strong> Equity Income Fund<br />
Class A : FFEIX . 670678887 |ClassC:FFECX . 670678317 |ClassR3:FEISX . 670678531 |ClassI:FAQIX . 670678879<br />
MARCH 31, 2012<br />
NUVEEN ASSET MANAGEMENT<br />
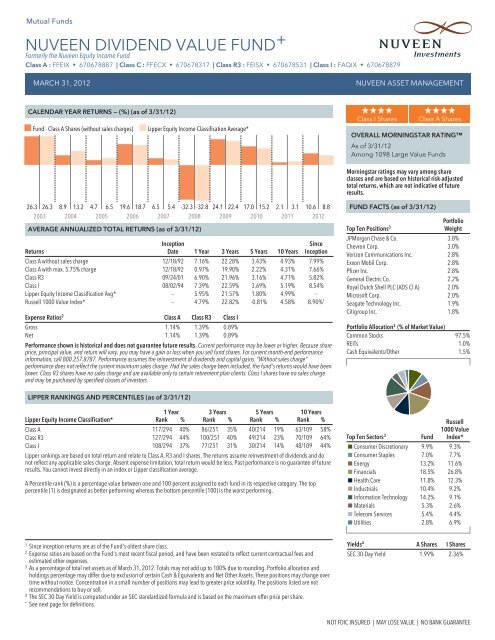
CALENDAR YEAR RETURNS —(%) (as of 3/31/12)<br />
n Fund - Class A Shares (without sales charges)<br />
n Lipper Equity Income Classification Average*<br />
HHHH<br />
Class I Shares<br />
HHHH<br />
Class A Shares<br />
OVERALL MORNINGSTAR RATING<br />
As of 3/31/12<br />
Among 1098 Large Value Funds<br />
Morningstar ratings may vary among share<br />
classes and are based on historical risk-adjusted<br />
total returns, which are not indicative of future<br />
results.<br />
26.3 26.3 8.9 13.2 4.7 6.5 19.6 18.7 6.5 5.4 -32.3 -32.8 24.1 22.4 17.0 15.2 2.1 3.1 10.6 8.8<br />
2003 2004 2005 2006 2007 2008 2009 2010 2011 2012<br />
AVERAGE ANNUALIZED TOTAL RETURNS (as of 3/31/12)<br />
Returns<br />
Inception<br />
Date 1 Year 3 Years 5 Years 10 Years<br />
Since<br />
Inception<br />
Class A without sales charge 12/18/92 7.16% 22.28% 3.43% 4.93% 7.99%<br />
Class A with max. 5.75% charge 12/18/92 0.97% 19.90% 2.22% 4.31% 7.66%<br />
Class R3 09/24/01 6.90% 21.96% 3.16% 4.71% 5.82%<br />
Class I 08/02/94 7.39% 22.59% 3.69% 5.19% 8.54%<br />
Lipper Equity Income Classification Avg* – 5.95% 21.57% 1.80% 4.99% –<br />
Russell 1000 Value Index* – 4.79% 22.82% -0.81% 4.58% 8.90% 1<br />
Expense Ratios 2 Class A Class R3 Class I<br />
Gross 1.14% 1.39% 0.89%<br />
Net 1.14% 1.39% 0.89%<br />
Performance shown is historical and does not guarantee future results. Current performance may be lower or higher. Because share<br />
price, principal value, and return will vary, you may have a gain or loss when you sell fund shares. For current month-end performance<br />
information, call 800.257.8787. Performance assumes the reinvestment of dividends and capital gains. “Without sales charge”<br />
performance does not reflect the current maximum sales charge. Had the sales charge been included, the fund's returns would have been<br />
lower. Class R3 shares have no sales charge and are available only to certain retirement plan clients. Class I shares have no sales charge<br />
and may be purchased by specified classes of investors.<br />
FUND FACTS (as of 3/31/12)<br />
Portfolio<br />
Top Ten Positions 3<br />
Weight<br />
JPMorgan Chase & Co. 3.8%<br />
Chevron Corp. 3.0%<br />
Verizon Communications Inc. 2.8%<br />
Exxon Mobil Corp. 2.8%<br />
Pfizer Inc. 2.8%<br />
General Electric Co. 2.2%<br />
RoyalDutchShellPLC(ADSClA) 2.0%<br />
Microsoft Corp. 2.0%<br />
Seagate Technology Inc. 1.9%<br />
Citigroup Inc. 1.8%<br />
Portfolio Allocation 3 (% of Market Value)<br />
Common Stocks 97.5%<br />
REITs 1.0%<br />
Cash Equivalents/Other 1.5%<br />
LIPPER RANKINGS AND PERCENTILES (as of 3/31/12)<br />
Lipper Equity Income Classification*<br />
1Year<br />
Rank %<br />
3Years<br />
Rank %<br />
5Years<br />
Rank %<br />
10 Years<br />
Rank %<br />
Class A 117/294 40% 86/251 35% 40/214 19% 63/109 58%<br />
Class R3 127/294 44% 100/251 40% 49/214 23% 70/109 64%<br />
Class I 108/294 37% 77/251 31% 30/214 14% 48/109 44%<br />
Lipper rankings are based on total return and relate to Class A, R3 and I shares. The returns assume reinvestment of dividends and do<br />
not reflect any applicable sales charge. Absent expense limitation, total return would be less. Past performance is no guarantee of future<br />
results. You cannot invest directly in an indexor Lipper classification average.<br />
A Percentile rank (%) is a percentage value between one and 100 percent assigned to each fund in its respective category. The top<br />
percentile (1) is designated as better performing whereas the bottom percentile (100) is the worst performing.<br />
Top Ten Sectors 3<br />
Fund<br />
Russell<br />
1000 Value<br />
Index*<br />
NUVEEN DIVIDEND VALUE FUND FIRST QUARTER | 3/31/12<br />
FUND DESCRIPTION<br />
A diversified portfolio of high quality, dividend-paying stocks that employs a long-term approach with a typical investment horizon of at<br />
least two to three years.<br />
INVESTMENT PROCESS<br />
We seek to achieve consistent, long-term outperformance with lower volatility by buying dividend payers with a value bias.<br />
Strategy:<br />
> Focus on attractively valued companies with above average current income or dividend growth.<br />
> Build and manage a portfolio diversified between core and opportunistic holdings<br />
> Conduct rigorous, multi-perspective fundamental research<br />
> Adhere to portfolio guardrails to manage volatility and maintain diversification<br />
Integrated Multi-Perspective Research and Analysis:<br />
> Portfolio Managers — Assess fundamental research and quantitative inputs — Define market themes, investment thesis, and<br />
valuation with fundamental analysts<br />
> Fundamental Research Analysts — Sector specialists with deep expertise — Investigate business strength and growth potential —<br />
Evaluate management skill and strategy execution — Survey sector trends and competitive landscape<br />
> Quantitative Analysts — Crosscheck fundamental factors and challenge analytical assumptions — Inform portfolio managers of<br />
portfolio risk and exposures<br />
PORTFOLIO STATISTICS (as of 3/31/12)<br />
Russell 1000<br />
Fund Value Index<br />
Beta (3 years) 0.93 1.00<br />
Average Weighted Market Cap ($mil.) $46,038 $37,706<br />
P/E Ratio (Forward 12-months) 12.3 12.2<br />
Standard Deviation (3 years) 16.24 17.17<br />
Number of Positions 81 654<br />
This data relates to the portfolio and the underlying securities held in the<br />
portfolio. It should not be construed as a measure of performance for the<br />
fund itself.<br />
PORTFOLIO CHARACTERISTICS<br />
Fund<br />
Total Net Assets (all classes) $1,231.6 million<br />
Turnover Ratio (Trailing 4 quarters) 27%<br />
CONTACT US . NUVEEN.COM<br />
INVESTORS —800.257.8787<br />
ADVISORS —800.752.8700<br />
PORTFOLIO MANAGEMENT<br />
The Fund features portfolio management by<br />
<strong>Nuveen</strong> Asset Management, LLC, an affiliate<br />
of <strong>Nuveen</strong> Securities, LLC.<br />
Effective February 29, 2012, Derek Sadowsky<br />
was added as co-portfolio manager to the<br />
<strong>Nuveen</strong> Dividend Value Fund.<br />
Cori Johnson, CFA<br />
31 years investment experience<br />
Gerald Bren, CFA<br />
40 years investment experience<br />
Derek Sadowsky<br />
14 years investment experience<br />
+ Effective February 29, 2012, the <strong>Nuveen</strong> Equity Income Fund's name changed to the <strong>Nuveen</strong> Dividend Value Fund. There have been no changes in the Fund's investment<br />
objectives or policies. Effective February 29, 2012, the <strong>Nuveen</strong> Dividend Value Fund's primary benchmark, the S&P 500, was changed to the Russell 1000 Value Index to better<br />
reflect the Fund's value-oriented approach and focus on dividend paying companies. There have been no changes in the way the Fund is managed.<br />
RISK CONSIDERATIONS<br />
Mutual fund investing involves risk; principal loss is possible. Equity investments such as those held by the Fund, are subject to market risk and derivatives risk; dividends are not<br />
guaranteed. Foreign investments involve additional risks, including currency fluctuation, political and economic instability, lack of liquidity and differing legal and accounting standards.<br />
These risks are magnified in emerging markets. In addition, the fund invests in debt or fixed income securities that are subject to credit risk and interest rate risk. Below investment grade or<br />
high yield debt securities are subject to heightened credit risk, liquidity risk and potential for default.<br />
An investor should carefully consider the Fund's objectives, risks, charges and expenses before investing. For a prospectus containing this and other information about the<br />
Fund, please contact your financial advisor or <strong>Nuveen</strong> Investments at 800.257.8787. Read the prospectus carefully before you invest or send money.<br />
For the period ended March 31, 2012, Morningstar rated this Fund's I and A shares, for the overall, three-, five-, and 10-year periods. The Class I sharesreceived4,4,5,and4starsandthe<br />
Class A shares received 4, 3, 4, and 4 stars among 1098, 1098, 973, and 570 Large Value Funds, respectively (derived from a weighted average of the fund's three-, five-, and 10-year [if<br />
applicable] risk-adjusted return measures and Morningstar Ratings metrics). These ratings are for Class I and A shares only; other classes may have different performance characteristics.<br />
Investment performance reflects applicable fee waivers. Without such waivers, total returns would be reduced and ratings could be lower. For funds with at least a three-year history, a<br />
Morningstar Rating is based on a risk-adjusted return measure (including the effects of sales charges, loads, and redemption fees) with emphasis on downward variations and consistent<br />
performance. The top 10% of funds in each category receive 5 stars, the next 22.5% 4 stars, the next 35% 3 stars, the next 22.5% 2 stars, and the bottom 10% 1 star. Each share class is<br />
counted as a fraction of one fund within this scale and rated separately. ©2012 Morningstar, Inc. All Rights Reserved. The information contained herein: (1) is proprietary to Morningstar<br />
and/or its content providers; (2) may not be copied or distributed; and (3) is not warranted to be accurate, complete, or timely. Neither Morningstar nor its content providers are<br />
responsible for any damages or losses arising from any use of this information.<br />
Past performance does not guarantee future results.<br />
GLOSSARY<br />
Average Weighted Market Capitalization is the portfolio-weighted geometric average capitalizations of all equity securities. Beta is a measure of the volatility of a portfolio relative to<br />
the overall market. A beta less than 1.0 indicates lower risk than the market; a beta greater than 1.0 indicates higher risk than the market. Lipper Equity Income Classification Average<br />
represents the average annualized total return for all reporting funds in the Classification. Russell 1000 Value Index measures the performance of those Russell 1000 companies with<br />
lower price-to-book ratios and lower forecasted growth values. P/E Ratio of a stock is calculated by dividing the current price of the stock by its forecasted 12 months' earnings per share.<br />
The average of the price/earnings ratio of a fund is a weighted harmonic average of all the current P/E ratios (excluding negatives) of the stocks in the fund's portfolio. This should not be<br />
construed as a forecast of the Fund's performance. Standard Deviation is a statistical measure of the historical volatility of a mutual fund or portfolio; the higher the number the greater<br />
the risk. Turnover Ratio is a measure of the Fund’s trading activity computed by taking the lesser of purchases or sales (excluding all securities with maturities of less than one year) and<br />
dividing by average monthly assets.<br />
MUNICIPAL FIXED INCOME TAXABLE FIXED INCOME GLOBAL/INTERNATIONAL VALUE GROWTH CORE REAL ASSETS ASSET ALLOCATION QUANTITATIVE INDEX<br />
Funds distributed by <strong>Nuveen</strong> Securities, LLC | 333 West Wacker Drive | Chicago, IL 60606<br />
MFS-DV-0312D