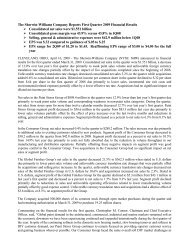
2000 Annual Report - Investor Relations - Sherwin-Williams
2000 Annual Report - Investor Relations - Sherwin-Williams
2000 Annual Report - Investor Relations - Sherwin-Williams

Create successful ePaper yourself
Turn your PDF publications into a flip-book with our unique Google optimized e-Paper software.
ask<br />
T H E S H E R W I N - W I L L I A M S C O M P A N Y | 2 0 0 0 A N N U A L R E P O R T
I N T R O D U C T I O N<br />
ask<br />
How are we structured to maximize<br />
market opportunity<br />
<strong>Sherwin</strong>-<strong>Williams</strong> is a manufacturer, distributor and retailer of coatings and other related<br />
products, with annual sales in excess of $5.2 billion. More than half of our worldwide revenue is<br />
generated by our network of North American company-operated paint stores and automotive<br />
branches. We also market branded, private label and licensed brand products through a variety<br />
of other channels. These include mass merchandisers, home centers, hardware stores,<br />
independent paint dealers, industrial and marine distributors, automotive distributors and<br />
body shops, joint ventures, and licensees of technology, trademarks and trade names.<br />
Our Company is organized into four operating segments. These segments allow us to closely<br />
tailor our technology, distribution and service to the needs of a particular marketplace.<br />
T A B L E O F C O N T E N T S<br />
The <strong>Sherwin</strong>-<strong>Williams</strong> Company recruits, selects and<br />
hires the best qualified people available – without<br />
discrimination based on race, religion, color, creed,<br />
sex, national origin, age, disability, status as a special<br />
disabled veteran, veteran of the Vietnam era or any<br />
other unlawful consideration.<br />
Highlights - - - - - - - - - - - - - - - - - - - - - - - - - - - - - - - - - - - - - - - - - - 2<br />
Letter to Shareholders - - - - - - - - - - - - - - - - - - - - - - - - - - - - - - - - - 3-5<br />
Company Overview - - - - - - - - - - - - - - - - - - - - - - - - - - - - - - - - - - - 6-11<br />
Financial Summary - - - - - - - - - - - - - - - - - - - - - - - - - - - - - - - - - - - 12<br />
Management’s Discussion and Analysis<br />
of Financial Condition and Results of Operations - - - - - - - - - - - - -13-20<br />
<strong>Report</strong> of Management and Cautionary Statement Regarding<br />
Forward-Looking Information - - - - - - - - - - - - - - - - - - - - - - - - - - - - 21<br />
<strong>Report</strong> of Independent Auditors - - - - - - - - - - - - - - - - - - - - - - - - - - 22<br />
color on this page<br />
ColorAnswers SW1672 Sunspot<br />
Consolidated Financial Statements and Notes - - - - - - - - - - - - - - -23-37<br />
Directors, Officers, Managers - - - - - - - - - - - - - - - - - - - - - - - - - - - - 38<br />
Shareholder Information - - - - - - - - - - - - - - - - - - - - - - - - - - - - - - - 39<br />
Subsidiaries - - - - - - - - - - - - - - - - - - - - - - - - - - - - - - - - - - - - - - - - 40
O u r F o u r O p e r a t i n g S e g m e n t s<br />
Paint Stores Segment<br />
Products Sold: Paints, stains, caulks, applicators, wallcoverings,<br />
floorcoverings, spray equipment and related products<br />
Markets Served: Do-It-Yourselfers, professional painting<br />
contractors, home builders, property managers, architects,<br />
interior designers, industrial, marine, aviation, flooring and<br />
OEM product finishes<br />
Major Brands Sold: <strong>Sherwin</strong>-<strong>Williams</strong> ® , Con-Lux ® , Old<br />
Quaker , Mercury , Brod Dugan , Pro-Line ® , SeaGuard ® ,<br />
ArmorSeal ® , Kem ® Hi-Temp, Cook , Sher-Wood ® , Powdura ® ,<br />
Polane ® and Kem Aqua ®<br />
Outlets: 2,488 <strong>Sherwin</strong>-<strong>Williams</strong> stores in North America<br />
Consumer Segment<br />
Products Sold: Branded, private label and licensed brand<br />
paints, stains, varnishes, industrial products, wood finishing<br />
products, applicators, corrosion inhibitors, aerosols and<br />
related products<br />
Markets Served: Do-It-Yourselfers, professional painting contractors<br />
and industrial maintenance<br />
Major Brands Sold: Dutch Boy ® , Krylon ® , Minwax ® , Cuprinol ® ,<br />
Thompson’s ® , Formby’s ® , Red Devil ® , Pratt & Lambert ® , Martin<br />
Senour ® , H&C , White Lightning ® , Dupli-Color ® and Rubberset ®<br />
Outlets: Leading mass merchandisers, home centers,<br />
independent paint dealers, hardware stores and industrial<br />
distributors<br />
Automotive Finishes Segment<br />
Products Sold: High performance interior and exterior coatings<br />
for the automotive and fleet industries, and automotive<br />
and heavy truck original equipment manufacturer (OEM)<br />
markets; as well as thousands of associated products<br />
Markets Served: Automotive jobbers, wholesale distributors,<br />
collision repair facilities, dealerships, fleet owners and refinishers,<br />
production shops, body builders and original equipment<br />
manufacturers (OEM)<br />
Major Brands Sold: <strong>Sherwin</strong>-<strong>Williams</strong> ® , Martin Senour ® ,<br />
Western ® , Lazzuril , Excelo , Marson and ScottWarren <br />
Outlets: 175 company-operated branches in the United<br />
States, Canada, Jamaica and Chile, and other operations in the<br />
United States, Canada, Mexico, Brazil, Jamaica, Chile and Italy<br />
International Coatings Segment<br />
Products Sold: Architectural paints, stains, varnishes,<br />
industrial maintenance products, aerosols, product finishes,<br />
wood finishing products and related products<br />
Markets Served: Do-It-Yourselfers, professional painting<br />
contractors, independent dealers, industrial maintenance and<br />
OEM product finishes<br />
Major Brands Sold: <strong>Sherwin</strong>-<strong>Williams</strong> ® , Dutch Boy ® , Krylon ® ,<br />
Kem-Tone ® , Pratt & Lambert ® , Minwax ® , Sumare , Ronseal ,<br />
Globo , Pulverlack ® , Colorgin , Andina and Marson <br />
Outlets: Distribution in more than 20 foreign countries through<br />
wholly-owned subsidiaries, joint ventures and licensees of<br />
technology, trademarks and tradenames, including 45 companyoperated<br />
architectural and industrial stores in Chile and Brazil<br />
The <strong>Sherwin</strong>-<strong>Williams</strong> Company <strong>2000</strong> <strong>Annual</strong> <strong>Report</strong> | 1
H I G H L I G H T S<br />
(Thousands of Dollars Except Per Share Data)<br />
<strong>2000</strong> 1999 1998<br />
Net sales . . . . . . . . . . . . . . . . . . . . . . . . . . . . . . . . . . . . . . . . . . . . . . . . . . . . . . . $ 5,211,624 $ 5,003,837 $ 4,934,430<br />
Net income before impairment (1) . . . . . . . . . . . . . . . . . . . . . . . . . . . . . . . . . . . 309,654 303,860 272,864<br />
Less: Impairment of long-lived assets, net of tax . . . . . . . . . . . . . . . . . . . . . . . 293,628<br />
Net income . . . . . . . . . . . . . . . . . . . . . . . . . . . . . . . . . . . . . . . . . . . . . . . . . . . . . 16,026 303,860 272,864<br />
Per share:<br />
Net income before impairment - diluted (1) . . . . . . . . . . . . . . . . . . . . . . . . . . 1.90 1.80 1.57<br />
Less: Impairment of long-lived assets, net of tax . . . . . . . . . . . . . . . . . . . . . 1.80<br />
Net income - diluted . . . . . . . . . . . . . . . . . . . . . . . . . . . . . . . . . . . . . . . . . . . . .10 1.80 1.57<br />
Net income - basic . . . . . . . . . . . . . . . . . . . . . . . . . . . . . . . . . . . . . . . . . . . . . .10 1.81 1.58<br />
Cash dividends . . . . . . . . . . . . . . . . . . . . . . . . . . . . . . . . . . . . . . . . . . . . . . . . .54 .48 .45<br />
Book value . . . . . . . . . . . . . . . . . . . . . . . . . . . . . . . . . . . . . . . . . . . . . . . . . . . 9.22 10.25 10.03<br />
Average shares outstanding (thousands) . . . . . . . . . . . . . . . . . . . . . . . . . . . . . 161,912 167,925 172,162<br />
Return on sales (1) . . . . . . . . . . . . . . . . . . . . . . . . . . . . . . . . . . . . . . . . . . . . . . . 5.9% 6.1% 5.5%<br />
Return on beginning shareholders’ equity (1) . . . . . . . . . . . . . . . . . . . . . . . . . . 18.2% 17.7% 17.1%<br />
Total debt to capitalization . . . . . . . . . . . . . . . . . . . . . . . . . . . . . . . . . . . . . . . . 33.7% 30.5% 33.1%<br />
Times interest earned (1) . . . . . . . . . . . . . . . . . . . . . . . . . . . . . . . . . . . . . . . . . . 9.0x 9.0x 7.1x<br />
Current ratio . . . . . . . . . . . . . . . . . . . . . . . . . . . . . . . . . . . . . . . . . . . . . . . . . . . . 1.4 1.4 1.4<br />
Total technical expenditures (2) . . . . . . . . . . . . . . . . . . . . . . . . . . . . . . . . . . . . . $ 83,627 $ 78,189 $ 73,417<br />
Advertising expenditures . . . . . . . . . . . . . . . . . . . . . . . . . . . . . . . . . . . . . . . . . . 276,078 265,411 282,817<br />
Number of employees . . . . . . . . . . . . . . . . . . . . . . . . . . . . . . . . . . . . . . . . . . . . 26,095 25,697 24,822<br />
5200<br />
4800<br />
4400<br />
4000<br />
3600<br />
3200<br />
2800<br />
2400<br />
<strong>2000</strong><br />
1600<br />
1200<br />
800<br />
400<br />
Sales (millions) Net Income Per Share - Diluted (1)<br />
1.90<br />
1.80<br />
1.70<br />
1.60<br />
1.50<br />
1.40<br />
1.30<br />
1.20<br />
1.10<br />
1.00<br />
.90<br />
.80<br />
.70<br />
1994 1995 1996 1997 1998 1999 <strong>2000</strong><br />
1994 1995 1996 1997 1998 1999 <strong>2000</strong><br />
(1) Based on net income before the impairment of long-lived assets charge in <strong>2000</strong>, net of tax. See Note 2, page 28.<br />
(2) See Note 1, page 28, for a description of technical expenditures.<br />
2 | The <strong>Sherwin</strong>-<strong>Williams</strong> Company <strong>2000</strong> <strong>Annual</strong> <strong>Report</strong>
to<br />
In <strong>2000</strong>, The <strong>Sherwin</strong>-<strong>Williams</strong> Company<br />
posted record sales of $5.2 billion representing<br />
a 4.2 percent improvement over<br />
last year, our strongest sales performance<br />
in the past several years. Our net income,<br />
excluding a one-time charge for the<br />
impairment of long-lived assets, also set<br />
a new high at $309.7 million, a 1.9 percent<br />
increase over 1999’s performance.<br />
Earnings per share from operations, prior<br />
to the asset impairment charge, improved<br />
5.6 percent from $1.80 in 1999 to $1.90 in<br />
<strong>2000</strong>. This represents our 23rd consecutive<br />
year of improvement in earnings from<br />
operations. This past year we also increased<br />
the dividend for our 22nd consecutive<br />
year. As a sign of the Company’s confidence<br />
in our future and in the value of our<br />
stock, we purchased 6.8 million shares of<br />
our stock on the open market for treasury.<br />
The price of our stock at year-end compared<br />
to last year was up over 25 pecent.<br />
our shareholders<br />
Despite these positive results, we were<br />
disappointed with our performance in<br />
<strong>2000</strong>. We expected to do better and fell<br />
short in a number of areas. This past year<br />
we experienced significant raw material<br />
cost increases driven by a sharp run up<br />
in the price of oil. Management reacted<br />
quickly by implementing selective midyear<br />
price increases in some of our operating<br />
segments and making tough cuts in<br />
spending in all of our segments. However,<br />
we were not able, in the short term, to<br />
overcome the severity of these increases<br />
and margins suffered. We also experienced<br />
a slow down in the demand for our<br />
products over the second half of the year.<br />
Even though we believe that we continued<br />
to gain market share in most product<br />
categories, our sales results lagged<br />
behind our expectations. There were a<br />
number of positive results in our operating<br />
segments that give us confidence as<br />
we begin 2001.<br />
Paint Stores Segment<br />
<strong>2000</strong> marked the twentieth consecutive<br />
year of improved sales results from our<br />
Paint Stores Segment. Net sales increased<br />
6.1 percent to $3.2 billion while comparable-store<br />
net sales improved by 3.7<br />
percent. Operating profit rose 9.2 percent<br />
to $411.5 million. Gallon gains were posted<br />
in the architectural, industrial and marine<br />
and chemical coatings categories.<br />
While servicing do-it-yourself customers<br />
remains an important part of our architectural<br />
coatings mission, we are increasingly<br />
focused on the professional painting contractor<br />
market. There has been a significant<br />
increase in the purchase of architectural<br />
gallons by painting contractors. This<br />
shift is driven by the demographic changes<br />
in our country as our population ages and<br />
has less free time to tackle major projects<br />
around the home. We are further encouraged<br />
by the fact that painting contractors<br />
continue to purchase almost all of their<br />
product requirements from the paint<br />
store channel. Our 2,488 company paint<br />
stores throughout North America give us<br />
a significant advantage over all other<br />
paint store competitors serving professional<br />
painting contractors.<br />
As a critical component of this contractor<br />
focused strategy, we remain committed to<br />
expanding our network of company paint<br />
stores. This past year, we opened 92 net<br />
new stores, providing more convenient<br />
access to every customer in these neighborhoods.<br />
Included in this number are<br />
nine stores acquired from the Norfolk<br />
Paint Company in Norfolk, Virginia that<br />
now proudly offer <strong>Sherwin</strong>-<strong>Williams</strong> ®<br />
products. In addition to new stores, this<br />
Segment added 70 new sales representatives<br />
and launched 35 new products,<br />
strengthening our commitment to be<br />
the service and technology leader in<br />
our industry.<br />
This past year, our industrial and marine<br />
business continued to be an important<br />
growing part of our Company. The acquisition<br />
of the business of General Polymers<br />
Corporation added a full line of industrial<br />
floor coatings to our existing broad line<br />
of industrial products. Our chemical<br />
coatings business also posted improved<br />
results as we accelerated our original<br />
equipment manufacturer specification<br />
approval process, launched new products<br />
and successfully grew our powder coatings<br />
business.<br />
We believe the internet will play an<br />
increasing role in helping paint customers<br />
choose a supplier. Last year,<br />
color on this page<br />
ColorAnswers SW1810 Star Sapphire<br />
The <strong>Sherwin</strong>-<strong>Williams</strong> Company <strong>2000</strong> <strong>Annual</strong> <strong>Report</strong> | 3
we made substantial progress in evolving<br />
our award-winning web site from a comprehensive<br />
information source to an e-business<br />
platform for professional customers.<br />
A select group of diverse professional<br />
customers took part in a pilot program to<br />
help us design a site that serves a broad<br />
range of their business needs. In the years<br />
ahead, we will continue to enhance this<br />
site and expand the service to a significant<br />
number of our professional customers.<br />
Consumer Segment<br />
Net sales for our Consumer Segment<br />
ended the year at $1.2 billion, essentially<br />
flat with last year’s performance. More<br />
disappointing, operating profit declined<br />
8.0 percent to $142.5 million, excluding<br />
the asset impairment charge. Our poor<br />
performance in this Segment reflects our<br />
lackluster sales and inability to pass on<br />
raw material cost increases to our customers<br />
in a timely fashion.<br />
In addition, certain parts of our Consumer<br />
Segment, specifically Pratt & Lambert,<br />
Thompson’s and Cleaning Solutions,<br />
lacked the past financial performance or<br />
management’s expectations of future<br />
cash flow to support the carrying value of<br />
certain long-lived assets, particularly<br />
goodwill, resulting in a $293.6 million<br />
after-tax write off for impaired long-lived<br />
assets ($1.80 per diluted share on an<br />
annual basis). This one-time charge had<br />
no cash effect on our Company in <strong>2000</strong>.<br />
After a year like this, it is important that<br />
management reacts, makes changes and<br />
moves in a different direction. We have<br />
done that. We have made organization and<br />
management changes to reduce the complexity<br />
of our operation, gain greater focus<br />
on individual product lines and further<br />
reduce costs. As a result, we have created<br />
three operating units within this Segment.<br />
The Wood Care Business Unit will be<br />
responsible for the sales, marketing,<br />
manufacturing and technical development<br />
of our Thompson’s ® , Minwax ® and<br />
Formby’s ® product lines. Harvey Sass,<br />
Senior Vice President - Wood Care, will<br />
head this organization.<br />
Our Diversified Brands Business Unit will<br />
be responsible for the sales, marketing,<br />
manufacturing and technical development<br />
of our Krylon ® and Red Devil ® brands of<br />
aerosol and small package paint, our<br />
industrial, automotive and custom-filled<br />
aerosol products, our White Lightning ®<br />
brand of caulks and sealants and our<br />
applicator business. This business will be<br />
managed by Tim Knight, Senior Vice<br />
President – Diversified Brands.<br />
The Consumer Division will be responsible<br />
for the sales and marketing of our<br />
branded and private label architectural<br />
coatings other than the <strong>Sherwin</strong>-<br />
<strong>Williams</strong> ® brand. These names include<br />
Dutch Boy ® , Pratt & Lambert ® and Martin<br />
Senour ® , as well as nationally recognized<br />
private label and licensed brands. This<br />
Division will continue to be responsible<br />
for the manufacturing and technical<br />
development for all architectural and<br />
industrial and marine coatings for our<br />
Company domestically. Tom Seitz,<br />
President & General Manager, Consumer<br />
Division, will lead this team.<br />
In addition to these organizational<br />
changes, two non-core business units in<br />
the Consumer Segment are currently<br />
being marketed for potential divestiture.<br />
We believe the Cleaning Solutions and<br />
Graphic Arts businesses will perform<br />
better within an organization where<br />
their focus relates more closely to the<br />
core function of a potential acquirer.<br />
The Consumer Segment has a portfolio<br />
of outstanding brand names and relationships<br />
with the top retailers in our country.<br />
We expect these changes will improve our<br />
ability to react quickly to changing market<br />
conditions and bring a heightened sense<br />
of urgency to required improvements.<br />
Automotive Finishes Segment<br />
The Automotive Finishes Segment ended<br />
the year with $493.4 million in net sales<br />
for a 4.8 percent improvement. Operating<br />
profit declined to $61.3 million from<br />
$66.5 million in 1999. Operating profit<br />
was negatively impacted in <strong>2000</strong> by a<br />
$6.8 million provision for the disposition<br />
of the Chicago and Troy technical facilities<br />
as the Segment moved to its new<br />
state-of-the-art automotive technology<br />
center in Warrensville Heights, Ohio. This<br />
new facility will improve the efficiency<br />
and productivity of our automotive finishes<br />
product development effort.<br />
In <strong>2000</strong>, the Automotive Finishes<br />
Segment expanded its distribution network<br />
through both company branches and<br />
independent distributors. Three net new<br />
<strong>Sherwin</strong>-<strong>Williams</strong> branches were opened<br />
or acquired bringing our total to 175 facilities.<br />
The acquisition of ScottWarren S.p.A.<br />
in Italy, a manufacturer of automotive<br />
coatings for the collision repair market,<br />
provides a solid base upon which to grow<br />
our presence in Europe and enhances our<br />
color match capability for all European<br />
automobile makes.<br />
The Automotive Finishes Segment begins<br />
2001 under new leadership. Ron Nandor<br />
has been promoted back into this<br />
Segment to the position of President &<br />
General Manager, Automotive Division,<br />
after a successful assignment as<br />
Executive Vice President - Marketing<br />
of our Paint Stores Group.<br />
International Coatings<br />
Segment<br />
<strong>2000</strong> proved to be another difficult year<br />
for our International Coatings Segment.<br />
Net sales improved 2.6 percent to $307.0<br />
million, but operating profit declined by<br />
47.9 percent to finish at $17.7 million. A<br />
harsh economic climate in South America<br />
negatively impacted our performance in<br />
the entire region, most notably in<br />
Argentina. In the United Kingdom, an<br />
extended truck strike, poor weather and<br />
rising oil prices took their toll on our<br />
Ronseal operations.<br />
Despite our results in this Segment, we<br />
remain optimistic about our growth<br />
prospects in these markets over time. Last<br />
year, <strong>Sherwin</strong>-<strong>Williams</strong> and our subsidiaries<br />
introduced 60 products to meet<br />
specific coatings needs in these countries,<br />
with much of the technology transferred<br />
from our domestic operations. In Brazil,<br />
the acquisition of Pulverlack Tintas Ltda.,<br />
4 | The <strong>Sherwin</strong>-<strong>Williams</strong> Company <strong>2000</strong> <strong>Annual</strong> <strong>Report</strong>
a powder coatings manufacturer, strengthens<br />
our industrial position in this region.<br />
A key management change was made in<br />
our International Coatings Segment as<br />
well. Mike Galasso was named President,<br />
International Division after his successful<br />
assignment as President & General<br />
Manager of our Automotive Division.<br />
Outlook for 2001<br />
While the economic climate does not<br />
look promising at the beginning of this<br />
new year, we look forward with optimism<br />
and confidence. This optimism and confidence<br />
comes from sound strategic plans<br />
in support of each of our Segments, a<br />
track record of past success and 26,000<br />
employees committed to making this year<br />
better. We are focused on the significant<br />
opportunities we have to gain market<br />
share in every business segment regardless<br />
of the economic environment.<br />
Management Changes<br />
This past year, we said goodbye to two<br />
long-time leaders of our Company. Don<br />
Fields retired after 46 years of service,<br />
most recently as President of our<br />
International Division. Don’s steady hand<br />
touched many different divisions at<br />
<strong>Sherwin</strong>-<strong>Williams</strong> over his impressive<br />
career and he has made numerous significant<br />
contributions. We wish Don and his<br />
wife Joyce many years of continued good<br />
health and happiness.<br />
Our long-time Chairman, Jack Breen, completed<br />
the last phase of the Company’s<br />
orderly management succession plan as<br />
he stepped down from his position as<br />
Chairman of our Board of Directors. The<br />
legacy Jack leaves behind is impressive,<br />
beginning with the consecutive years of<br />
earnings growth and strong stock performance<br />
throughout his tenure. But<br />
more lasting for those of us who had the<br />
pleasure of knowing and working for him,<br />
will be the manner in which Jack conducted<br />
his personal and business affairs.<br />
Words like integrity, honesty and morality<br />
Christopher M. Connor<br />
Chairman and Chief Executive Officer<br />
are ingrained in this Company as a result<br />
of Jack’s leadership. While he is missed<br />
on a daily basis, Jack continues to play<br />
an important role as an active member of<br />
our Board of Directors. We wish Jack and<br />
Mary Jane an active life, full of adventure,<br />
good health and happiness.<br />
Every day our hard working team arrives<br />
at <strong>Sherwin</strong>-<strong>Williams</strong> commited to improving<br />
your Company. We are blessed with<br />
the most dedicated and talented employees<br />
in our industry. We are thankful for<br />
the loyalty of our customers and the support<br />
of our suppliers. We are excited<br />
about our future, proud of our past and<br />
most appreciative of your continuing<br />
trust.<br />
Joseph M. Scaminace<br />
President and Chief Operating Officer<br />
The <strong>Sherwin</strong>-<strong>Williams</strong> Company <strong>2000</strong> <strong>Annual</strong> <strong>Report</strong> | 5
T E C H N O L O G Y<br />
What is our commitment to<br />
ask<br />
technology and new product<br />
development<br />
<br />
skTechnology has been a cornerstone of<br />
<strong>Sherwin</strong>-<strong>Williams</strong> throughout our history.<br />
Being first to market with new and innovative<br />
products makes our customers<br />
more successful and strengthens the<br />
image of our brands and our Company.<br />
Over the past five years, this commitment<br />
to R&D has helped us bring more than<br />
330 new products to market.<br />
The John G. Breen Technology<br />
Center is the hub of <strong>Sherwin</strong>-<br />
<strong>Williams</strong>’ worldwide architectural<br />
products research and development<br />
efforts. This includes<br />
new product development – lab<br />
technicians can scale up new<br />
product prototypes from small<br />
bench samples to fifty-gallon<br />
production batches on site – to<br />
ongoing quality assurance and<br />
competitive product testing.<br />
In recent years, we have made a number<br />
of strategic investments to further<br />
enhance our research and development<br />
capability. Last summer we dedicated the<br />
John G. Breen Technology Center in downtown<br />
Cleveland. Nearly twice the size of<br />
the original Cleveland Technical Center,<br />
this new facility is the hub of our worldwide<br />
architectural product research and<br />
development effort. In <strong>2000</strong>, we also<br />
opened The World Automotive Center in<br />
Warrensville Heights, Ohio, a research<br />
and development facility for automotive<br />
coatings that consolidates labs previously<br />
located in Chicago and Troy, Michigan.<br />
These two state-of-the-art facilities<br />
strengthen our research and development<br />
capabilities and further enhance<br />
our ability to attract the most talented<br />
technical people within the industry.<br />
These new facilities complement our<br />
major industrial lab in Chicago.<br />
We also recognize the need to support<br />
research and development enterprises<br />
outside the United States. These facilities<br />
enable us to tailor products to the<br />
performance requirements and cultural<br />
preferences of our local customers. Our<br />
international product development<br />
efforts are facilitated by the transfer of<br />
technology across borders and by strong<br />
relationships with global raw materials<br />
suppliers.<br />
Our mission is to develop products that are<br />
both market-responsive and environmentally<br />
responsible. That means meeting or<br />
exceeding our customers’ performance<br />
expectations with products that also meet<br />
or exceed current environmental regulations.<br />
We believe the ongoing development<br />
of technology to produce environmentally<br />
responsible, high-performance coatings<br />
will help to ensure our continued success<br />
in the years ahead.<br />
color on this page<br />
Dutch Boy 14D•6 Strawberry Festival<br />
6 | The <strong>Sherwin</strong>-<strong>Williams</strong> Company <strong>2000</strong> <strong>Annual</strong> <strong>Report</strong>
Advanced Permalast<br />
Technology gives our<br />
Duration ® coating a thicker,<br />
more flexible film and unparalleled<br />
protective properties.<br />
Which is why our Duration ®<br />
coating has become a favorite<br />
among homeowners and professional<br />
painting contractors<br />
alike – including the contractor<br />
painting this 129 year-old<br />
Yaquinta Bay lighthouse (the<br />
oldest existing wooden framed<br />
lighthouse) on the Pacific<br />
Coast of Oregon.<br />
In <strong>2000</strong>, we introduced POWDURA ® Low-<br />
Cure Epoxy, Low-Cure Polyurethane and<br />
Low-Cure TGIC Polyester powder coatings.<br />
All three offer appearance, application<br />
and performance characteristics<br />
comparable to standard cure powder,<br />
but require less energy and less time to<br />
cure – big advantages for manufacturers<br />
of heavy equipment, machine tools<br />
and heavy automotive components.<br />
<br />
In <strong>2000</strong>, <strong>Sherwin</strong>-<strong>Williams</strong> introduced<br />
Painting Images , a sophisticated software<br />
tool for painting contractors.<br />
Painting Images enables contractors<br />
to quickly and easily “paint” a digitized<br />
photograph of their customer’s home<br />
or building to facilitate color selection<br />
prior to starting work. This powerful<br />
tool gives customers confidence in<br />
their choice of color, and in their<br />
choice of contractor.<br />
<br />
Low-odor paints minimize the disruption<br />
of painting in occupied<br />
areas, giving homeowners greater<br />
peace of mind and commercial painting<br />
contractors more productive<br />
hours during the day. For these reasons,<br />
<strong>Sherwin</strong>-<strong>Williams</strong> has developed<br />
a broad range of high-performance,<br />
low-odor paints to serve<br />
a variety of customer applications.<br />
The World Automotive Center, opened in September of <strong>2000</strong>, is both a<br />
research and development facility and a training center. It houses a<br />
state-of-the-art applications center that can replicate nearly any refinishing<br />
environment – from climate variations to airflow conditions to<br />
robotic applications. Our Automotive Learning Centers trained more<br />
than 5,000 customers and employees last year on curricula ranging<br />
from product specifications to color to business management.<br />
The <strong>Sherwin</strong>-<strong>Williams</strong> Company <strong>2000</strong> <strong>Annual</strong> <strong>Report</strong> | 7
D I S T R I B U T I O N<br />
ask<br />
How does our distribution<br />
infrastructure help us satisfy<br />
more customers<br />
Having the right products in the right place<br />
at the right time is a prerequisite of good<br />
customer service. To ensure our products<br />
reach customers wherever and whenever<br />
they choose to buy, we have developed an<br />
extensive network of independent and<br />
company-operated distribution channels.<br />
Our Paint Stores Segment, comprised of<br />
2,488 company-operated stores throughout<br />
North America, provides a strong distribution<br />
platform for <strong>Sherwin</strong>-<strong>Williams</strong> ® branded<br />
products. These specialty paint stores offer<br />
a broad product assortment that can be tailored<br />
to the specific needs and preferences<br />
of customers in a specific locale.<br />
<strong>Sherwin</strong>-<strong>Williams</strong>’ Automotive Finishes<br />
Segment distributes products through a<br />
combination of 175 company-operated<br />
branches, including outlets in the US,<br />
Canada, Jamaica and Chile, and a variety<br />
of independent channels. This Segment<br />
also conducts business through nine<br />
wholly-owned subsidiaries in five foreign<br />
countries and twelve foreign licensing<br />
agreements spanning 29 countries.<br />
Our Consumer Segment sells products<br />
under well known brands such as Dutch<br />
Boy ® , Thompson’s ® and Minwax ®<br />
through some of the top retailers in our<br />
country. Successful licensed brand programs<br />
and private label manufacturing<br />
agreements have further extended our<br />
presence in independent paint stores,<br />
hardware stores, home centers and mass<br />
merchandisers throughout North America.<br />
Our International Coatings Segment manufactures<br />
and distributes products<br />
through wholly-owned subsidiaries, joint<br />
ventures and licensing agreements, in<br />
addition to company-operated stores in<br />
Chile and Brazil.<br />
Ensuring the timely and efficient delivery<br />
of so many products to so many outlets<br />
requires a very sophisticated distribution<br />
infrastructure. The hub of our distribution<br />
system in North America is a network of<br />
seven Distribution Service Centers (DSC),<br />
comprising nearly 4.4 million square feet.<br />
An advanced Automated Warehouse<br />
Control System (AWCS) uses radio frequency<br />
and barcode technology to track<br />
inventory movement through the DSCs.<br />
The system records the production, storage,<br />
order receipt, fulfillment and transportation<br />
of DSC inventory to internal and<br />
external customers throughout North<br />
America. <strong>Sherwin</strong>-<strong>Williams</strong>’ dedicated<br />
fleet of tractor-trailers moves product<br />
from DSCs to retail outlets. This complex<br />
system helps efficiently manage our<br />
working capital, while ensuring our<br />
customers a ready supply of the<br />
products they need.<br />
In South America, we are aggressively<br />
expanding our industrial<br />
maintenance and chemical coatings<br />
base with Sumare , a chain of<br />
chemical coatings outlets. Sumare <br />
has helped us establish controlled<br />
distribution, even in dealer-dominated<br />
markets such as Brazil.<br />
color on this page<br />
Automotive Forest Green Pearl<br />
8 | The <strong>Sherwin</strong>-<strong>Williams</strong> Company <strong>2000</strong> <strong>Annual</strong> <strong>Report</strong>
Our Automated Warehouse Control System (AWCS)<br />
uses barcode technology and radio frequency to<br />
track the movement of inventory through our seven<br />
North American Distribution Service Centers. The system<br />
helps us manage working capital more efficiently<br />
by monitoring inventory movement and maximizing<br />
warehouse productivity and storage space utilization.<br />
<br />
Today more than 90% of the US<br />
population lives within a 50-mile<br />
radius of one of our <strong>Sherwin</strong>-<br />
<strong>Williams</strong> paint stores. We are<br />
committed to expanding this<br />
network of company-operated<br />
stores to provide do-it-yourself<br />
customers and professional<br />
painting contractors throughout<br />
North America with convenient<br />
access to <strong>Sherwin</strong>-<strong>Williams</strong> ®<br />
branded products.<br />
<br />
<strong>Sherwin</strong>-<strong>Williams</strong>’ extensive distribution<br />
network of “brick and mortar” outlets is<br />
now complemented by virtual outlets.<br />
Last year, our Automotive Division opened<br />
E-Store, an on-line outlet for a broad<br />
assortment of Automotive products. Also<br />
in <strong>2000</strong>, our Paint Stores Group launched<br />
Sher-Link , a secure site that offers online<br />
access to select users to browse,<br />
learn about and purchase <strong>Sherwin</strong>-<br />
<strong>Williams</strong> ® products.<br />
More than 600 quality-certified collision repair<br />
shops across North America have been enrolled in<br />
our Automotive Division’s A-Plus Program. This<br />
program offers members valuable services such as<br />
employee training, facility design services, product<br />
guarantee plans and preferred customer discounts<br />
at <strong>Sherwin</strong>-<strong>Williams</strong> Paint Stores.<br />
The <strong>Sherwin</strong>-<strong>Williams</strong> Company <strong>2000</strong> <strong>Annual</strong> <strong>Report</strong> | 9
ask<br />
C U S T O M E R S<br />
Which markets represent<br />
growth opportunities for us<br />
One of <strong>Sherwin</strong>-<strong>Williams</strong>’ foremost<br />
strengths is the diversity of our customer<br />
base. We supply coatings products to<br />
nearly every sector of the economy, from<br />
manufacturing, industrial, transportation<br />
and utilities, to healthcare, hospitality,<br />
commercial and residential construction,<br />
property management, institutional and<br />
government facilities and do-it-yourself<br />
consumers. In North America, South<br />
America and Europe, our products are<br />
sold under various brand names to<br />
commercial and do-it-yourself customers<br />
through company-operated outlets, independent<br />
distributors and dealers, home<br />
centers and mass merchandisers. We<br />
believe each of these markets represents<br />
a substantial growth opportunity for us.<br />
Growing our business within each of these<br />
markets means focusing on the things<br />
that make each customer more successful.<br />
Highly differentiated products, like<br />
low-odor paints that allow a commercial<br />
contractor to work in an occupied office<br />
building with minimal disruption, or UV<br />
curable stains and topcoats that increase<br />
a cabinetmaker’s throughput, help our<br />
customers improve their productivity.<br />
Licensed products, like our new Disney<br />
line, build demand for our products<br />
among current and future generations of<br />
homeowners.<br />
Providing high-value products is only one<br />
way we’re helping our customers to succeed.<br />
Focusing our organization to be<br />
more customer-responsive is another.<br />
Through programs like our Automotive<br />
Division’s A-Plus Club, we’re growing<br />
customer loyalty by providing technical<br />
training and valuable marketing and<br />
business management services. We<br />
restructured our Consumer Group into<br />
three smaller, more manageable business<br />
units to sharpen our customer focus and<br />
improve our account service across major<br />
product categories. And we will continue<br />
to expand our network of companyoperated<br />
stores in North America to provide<br />
more customers with convenient<br />
access to our products and more responsive<br />
service.<br />
<strong>Sherwin</strong>-<strong>Williams</strong>’ Automotive Division trained more than<br />
5,000 customers and employees over the past year. Six<br />
Automotive Learning Centers in the US, one in Brazil and<br />
one in Mexico offer curriculum ranging from color matching<br />
and applying paint, to hiring and training the right<br />
people, to salesmanship and estimating.<br />
To help OEM product finishers<br />
deal with ever tightening environmental<br />
and safety regulations,<br />
<strong>Sherwin</strong>-<strong>Williams</strong> developed Kem<br />
Aqua ® Hydralon coatings. This<br />
environmentally compliant, waterbased<br />
finish for metal and plastic<br />
outperforms many urethane coatings<br />
in durability and appearance.<br />
color on this page<br />
Krylon 1913 Purple<br />
10 | The <strong>Sherwin</strong>-<strong>Williams</strong> Company <strong>2000</strong> <strong>Annual</strong> <strong>Report</strong>
In South America, mass merchandisers<br />
rely on paint manufacturers to hire and<br />
train “Promoters” to sell the advantages<br />
of their products in stores. Our<br />
strong commitment to growth in these<br />
markets is reflected in our<br />
International Division’s workforce of<br />
more than 2,100 employees, with an<br />
annual voluntary turnover rate of less<br />
than one percent.<br />
<br />
Although changing demographics<br />
in North America are shifting a<br />
greater share of residential<br />
painting and decorating to contractors,<br />
many homeowners still<br />
take pride and satisfaction in<br />
doing it themselves. We have built<br />
our reputation on providing the<br />
quality, name brand paints, stains<br />
and decorative products, and the<br />
expert advice they need to achieve<br />
beautiful results.<br />
A challenging work environment – structural steel spanning 420 feet above the canyon floor –<br />
combined with the nation's strictest environmental regulations, made coating the Cold Springs<br />
Canyon bridge in California difficult for even the most seasoned industrial painting contractor.<br />
<strong>Sherwin</strong>-<strong>Williams</strong> ® Zinc Clad XI water-based, lead-free coating was specified for its ease of application,<br />
durability and environmental compliance.<br />
<br />
When property and facility<br />
managers need to<br />
turn vacant rental property<br />
fast, our broad<br />
range of coatings,<br />
equipment, sundries and<br />
expertise, combined with<br />
a network of dedicated<br />
<strong>Sherwin</strong>-<strong>Williams</strong> floorcovering<br />
centers, make<br />
us the ideal singlesource<br />
solution. People<br />
know us for high quality<br />
paint products, but we<br />
are also one of the<br />
largest carpet wholesalers<br />
in North America.<br />
<br />
In <strong>2000</strong>, the US Navy<br />
approved <strong>Sherwin</strong>-<br />
<strong>Williams</strong> ® Nova-Plate UHS,<br />
an ultra-high solids epoxy<br />
primer and topcoat system<br />
specifically formulated for<br />
immersion service. The<br />
most recent of many such<br />
specifications, this<br />
approval further solidifies<br />
our position as a leading<br />
supplier of marine coatings<br />
to the US Navy.<br />
The <strong>Sherwin</strong>-<strong>Williams</strong> Company <strong>2000</strong> <strong>Annual</strong> <strong>Report</strong> | 11
FINANCIAL SUMMARY<br />
(Millions of Dollars Except Per Share Data)<br />
<strong>2000</strong> 1999 1998 1997 1996<br />
Operations<br />
Net sales . . . . . . . . . . . . . . . . . . . . . . . . . . . . . . . . . $ 5,212 $ 5,004 $ 4,934 $ 4,881 $ 4,133<br />
Cost of goods sold . . . . . . . . . . . . . . . . . . . . . . . . . . 2,904 2,755 2,804 2,784 2,405<br />
Selling and administrative expenses . . . . . . . . . . . 1,740 1,673 1,598 1,574 1,309<br />
Impairment of long-lived assets . . . . . . . . . . . . . . . 352<br />
Interest expense . . . . . . . . . . . . . . . . . . . . . . . . . . . 62 61 72 81 25<br />
Income before income taxes . . . . . . . . . . . . . . . . . . 143 490 440 427 375<br />
Net income . . . . . . . . . . . . . . . . . . . . . . . . . . . . . . . . 16 304 273 261 229<br />
Net income before impairment (A) . . . . . . . . . . . . . 310 304 273 261 229<br />
Financial Position<br />
Inventories . . . . . . . . . . . . . . . . . . . . . . . . . . . . . . . . $ 704 $ 703 $ 683 $ 722 $ 643<br />
Accounts receivable - net . . . . . . . . . . . . . . . . . . . . . 594 606 605 546 452<br />
Working capital . . . . . . . . . . . . . . . . . . . . . . . . . . . . 436 437 458 417 365<br />
Property, plant and equipment - net . . . . . . . . . . . . 722 712 719 692 549<br />
Total assets . . . . . . . . . . . . . . . . . . . . . . . . . . . . . . . 3,751 4,033 4,051 4,036 2,995<br />
Long-term debt . . . . . . . . . . . . . . . . . . . . . . . . . . . . 624 624 730 844 143<br />
Total debt . . . . . . . . . . . . . . . . . . . . . . . . . . . . . . . . . 750 747 848 1,005 313<br />
Shareholders’ equity . . . . . . . . . . . . . . . . . . . . . . . . 1,472 1,699 1,716 1,592 1,401<br />
Per Share Data<br />
Average shares outstanding (000’s) (B) . . . . . . . . . 161,912 167,925 172,162 172,107 171,117<br />
Book value . . . . . . . . . . . . . . . . . . . . . . . . . . . . . . . . $ 9.22 $ 10.25 $ 10.03 $ 9.21 $ 8.15<br />
Net income before impairment - diluted (A)(B) . . . . 1.90 1.80 1.57 1.50 1.33<br />
Net income - diluted (B) . . . . . . . . . . . . . . . . . . . . . . .10 1.80 1.57 1.50 1.33<br />
Net income - basic (B) . . . . . . . . . . . . . . . . . . . . . . . .10 1.81 1.58 1.51 1.34<br />
Cash dividends . . . . . . . . . . . . . . . . . . . . . . . . . . . . .54 .48 .45 .40 .35<br />
Financial Ratios<br />
Return on sales (A) . . . . . . . . . . . . . . . . . . . . . . . . . 5.9% 6.1% 5.5% 5.3% 5.5%<br />
Asset turnover (A) . . . . . . . . . . . . . . . . . . . . . . . . . . 1.3x 1.2x 1.2x 1.2x 1.4x<br />
Return on assets (A) . . . . . . . . . . . . . . . . . . . . . . . . 7.5% 7.5% 6.7% 6.5% 7.7%<br />
Return on equity (A)(C) . . . . . . . . . . . . . . . . . . . . . . 18.2% 17.7% 17.1% 18.6% 18.9%<br />
Dividend payout ratio (A) . . . . . . . . . . . . . . . . . . . . . 28.5% 26.6% 28.5% 26.5% 26.2%<br />
Total debt to capitalization . . . . . . . . . . . . . . . . . . . 33.7% 30.5% 33.1% 38.7% 18.3%<br />
Current ratio . . . . . . . . . . . . . . . . . . . . . . . . . . . . . . . 1.4 1.4 1.4 1.4 1.3<br />
Times interest earned (D) . . . . . . . . . . . . . . . . . . . . 9.0x 9.0x 7.1x 6.3x 16.3x<br />
Working capital to sales . . . . . . . . . . . . . . . . . . . . . 8.4% 8.7% 9.3% 8.5% 8.8%<br />
Effective income tax rate (A) . . . . . . . . . . . . . . . . . . 37.5% 38.0% 38.0% 39.0% 39.0%<br />
General<br />
Capital expenditures . . . . . . . . . . . . . . . . . . . . . . . . $ 133 $ 134 $ 146 $ 164 $ 123<br />
Total technical expenditures (E) . . . . . . . . . . . . . . . 84 78 73 63 53<br />
Advertising expenditures . . . . . . . . . . . . . . . . . . . . 276 265 283 296 212<br />
Repairs and maintenance . . . . . . . . . . . . . . . . . . . . 48 46 45 45 38<br />
Depreciation . . . . . . . . . . . . . . . . . . . . . . . . . . . . . . . 109 105 98 90 76<br />
Amortization of intangible assets . . . . . . . . . . . . . . 51 50 50 49 27<br />
Shareholders of record . . . . . . . . . . . . . . . . . . . . . . 10,813 11,475 11,929 11,964 11,933<br />
Number of employees . . . . . . . . . . . . . . . . . . . . . . . 26,095 25,697 24,822 24,964 20,768<br />
Sales per employee (000’s) . . . . . . . . . . . . . . . . . . . $ 200 $ 195 $ 199 $ 196 $ 199<br />
Sales per dollar of assets . . . . . . . . . . . . . . . . . . . . 1.39 1.24 1.22 1.21 1.38<br />
(A) Based on net income before the impairment of long-lived assets charge in <strong>2000</strong>, net of tax. See Note 2, page 28.<br />
(B) Amounts reflect adoption of Statement of Financial Accounting Standards (SFAS) No. 128 effective December 31, 1997.<br />
All average share and per share amounts shown for 1996 have been restated.<br />
(C) Based on shareholders’ equity at beginning of year and net income before impairment.<br />
(D) Ratio of income before income taxes excluding the charge for impairment in <strong>2000</strong> and interest expense to interest expense.<br />
(E) See Note 1, page 28, for a description of technical expenditures.<br />
12| The <strong>Sherwin</strong>-<strong>Williams</strong> Company <strong>2000</strong> <strong>Annual</strong> <strong>Report</strong>
MANAGEMENT'S DISCUSSION AND ANALYSIS OF FINANCIAL CONDITION AND RESULTS OF OPERATIONS<br />
FINANCIAL CONDITION - <strong>2000</strong><br />
Net operating cash flow generated by the Company<br />
during <strong>2000</strong> was $461.1 million, while net proceeds<br />
from short-term borrowings were $106.9 million. This<br />
cash flow provided the funds to invest in property, plant<br />
and equipment, reduce long-term debt, acquire treasury<br />
stock, increase the annual dividend, complete several<br />
acquisitions and make other long-term investments. The<br />
Company’s current ratio increased to 1.39 at December<br />
31, <strong>2000</strong> from 1.38 at the end of 1999. The Company’s<br />
Consolidated Balance Sheets and Statements of<br />
Consolidated Cash Flows, on pages 24 and 25 of this<br />
report, provide more detailed information on the<br />
Company’s financial position and cash flows.<br />
Borrowings outstanding under the Company’s<br />
commercial paper program are included in Short-term<br />
borrowings on the balance sheet. Such borrowings had<br />
a weighted-average interest rate of 6.6 percent.<br />
Borrowings under the commercial paper program are<br />
fully backed by and limited to the borrowing availability<br />
under the Company’s revolving credit agreements which<br />
aggregated $768.0 million effective January 3, 2001. The<br />
current portion of long-term debt decreased $102.9<br />
million due primarily to the payment of 6.5% notes<br />
totaling $100.0 million during the first quarter of <strong>2000</strong>.<br />
The $19.4 million balance in Current portion of longterm<br />
debt at December 31, <strong>2000</strong> related to various<br />
promissory notes and other obligations. Increases and<br />
decreases in components of net working capital were<br />
primarily due to timing during <strong>2000</strong>.<br />
Deferred pension assets of $364.4 million at December<br />
31, <strong>2000</strong> represent the excess of the fair market value of<br />
the assets in the Company’s defined benefit pension<br />
plans over the actuarially- determined projected benefit<br />
obligations. The <strong>2000</strong> increase in deferred pension<br />
assets of $30.3 million represents primarily the<br />
recognition of the current year net pension credit,<br />
described in Note 6 on pages 29 to 31 of this report. The<br />
assumed discount rate used to compute the actuarial<br />
present value of projected benefit obligations was<br />
decreased from 7.25 percent to 7.00 percent at<br />
December 31, <strong>2000</strong> due to decreased rates of highquality,<br />
long-term investments. The decrease in the<br />
actual return on plan assets during <strong>2000</strong> was primarily<br />
the result of returns on equity investments that were<br />
below the assumed return of 8.5 percent.<br />
Goodwill, which represents the excess of cost over the<br />
fair value of net assets acquired in purchase business<br />
combinations, decreased $334.0 million in <strong>2000</strong>.<br />
Intangible assets, which represent items such as<br />
trademarks and patents, decreased $15.8 million in<br />
<strong>2000</strong>. These decreases were due primarily to a total<br />
charge for the impairment of long-lived assets of $352.0<br />
million, of which $342.5 million related to goodwill, as<br />
described in Note 2 on page 28 of this report. In<br />
addition, amortization expense of $47.3 million and<br />
foreign currency translation adjustments decreased<br />
goodwill and intangible assets, offset by increases<br />
resulting from acquisitions completed in <strong>2000</strong>. An<br />
increase in Other assets of $53.3 million was primarily<br />
due to the capitalization of costs incurred, net of<br />
amortization, related to designing, developing,<br />
obtaining and implementing internal use software in<br />
accordance with Statement of Position 98-1,<br />
“Accounting for the Cost of Computer Software<br />
Developed or Obtained for Internal Use.” Other longterm<br />
investments, related to certain marketing programs<br />
of the Company, also increased Other assets.<br />
Net property, plant and equipment increased $10.7<br />
million to $722.4 million at December 31, <strong>2000</strong>. The<br />
increase results primarily from capital expenditures of<br />
$132.8 million, partially offset by depreciation expense<br />
of $108.9 million and a portion of the total charge for<br />
the impairment of long-lived assets. Provisions for<br />
disposition or retirement of certain assets and foreign<br />
currency translation adjustments further offset capital<br />
expenditures. Capital expenditures in <strong>2000</strong> represented<br />
primarily the costs of purchasing and remodeling the<br />
automotive technology center in Warrensville Heights,<br />
Ohio, upgrading information systems equipment, the<br />
capacity expansion or upgrade of manufacturing and<br />
distribution centers and costs related to opening new<br />
paint stores. Capital expenditures during <strong>2000</strong> in the<br />
Paint Stores Segment were primarily attributable to<br />
opening new paint stores and store relocations along<br />
with normal replacement and upgrading store<br />
equipment. Capital expenditures in the Consumer and<br />
The <strong>Sherwin</strong>-<strong>Williams</strong> Company <strong>2000</strong> <strong>Annual</strong> <strong>Report</strong> | 13
International Coatings Segments during <strong>2000</strong> were<br />
primarily related to capacity expansions, efficiency<br />
improvements in production facilities and information<br />
systems hardware. Capital expenditures during <strong>2000</strong> in<br />
the Automotive Finishes Segment primarily related to<br />
the purchase and remodeling of the automotive<br />
technology center, capacity expansions and equipment<br />
upgrades. In 2001, the Company expects that its most<br />
significant capital expenditures will relate to various<br />
capacity and productivity improvement projects at<br />
manufacturing facilities, continued new store openings,<br />
and new or upgraded information systems equipment.<br />
The Company does not anticipate the need for any<br />
specific long-term external financing to support these<br />
capital programs.<br />
Long-term debt decreased during the year to $623.6<br />
million at December 31, <strong>2000</strong>, resulting primarily from<br />
current debt maturities of $19.4 million that were<br />
partially offset by increased debt associated with<br />
acquired companies. The Company expects to remain in<br />
a borrowing position throughout 2001.<br />
The increase in the Company’s long-term postretirement<br />
benefit liability occurred due to the excess of the net<br />
postretirement benefit expense over the costs for<br />
benefit claims incurred. The current portion of the<br />
accrued postretirement liability, amounting to $13.2<br />
million at December 31, <strong>2000</strong>, is included in Other<br />
accruals. The assumed discount rate used to calculate<br />
the actuarial present value of the postretirement benefit<br />
obligations was decreased from 7.25 percent to 7.00<br />
percent at December 31, <strong>2000</strong> due to the reduced rates<br />
of high-quality, long-term investments. The assumed<br />
health care cost trend rates, first established in 1992<br />
during the adoption of SFAS No. 106, were revised<br />
during <strong>2000</strong> for years 2001 through 2009. The revised<br />
rates reflect escalating health care costs that continue<br />
to exceed the assumed cost trend rates. The trend rate<br />
for 2001 was revised from the previous 5.5 percent<br />
annual increase to a more representative 9.5 percent<br />
annual increase. The trend rate will decrease gradually<br />
to 5.5 percent in 2010 – the same trend rate as<br />
previously estimated for 2010. The net effect of these<br />
changes is expected to increase the net postretirement<br />
benefit expense approximately 15 percent for 2001 as<br />
the cumulative unrecognized net loss is above the<br />
threshold for required amortization. See Note 6, on<br />
pages 29 to 31 of this report, for further information on<br />
the Company’s postretirement benefit obligations.<br />
Other long-term liabilities include accruals for<br />
environmental-related liabilities and other non-current<br />
items. The decrease of $31.1 million in other long-term<br />
liabilities during <strong>2000</strong> primarily related to a reduction in<br />
certain tax liabilities resulting from timing items and to<br />
a decrease in the accrual for environmental-related<br />
liabilities. See Note 9, on page 32 of this report, for<br />
additional information concerning the Company’s other<br />
long-term liabilities.<br />
The Company’s past operations included the<br />
manufacture and sale of lead pigments and lead-based<br />
paints. The Company, along with other companies, is a<br />
defendant in a number of legal proceedings, including<br />
purported class actions, separate actions brought by<br />
the State of Rhode Island, and actions brought by other<br />
governmental entities, arising from the manufacture and<br />
sale of lead pigments and lead-based paints. The<br />
plaintiffs are seeking recovery based upon various legal<br />
theories, including negligence, strict liability, breach of<br />
warranty, negligent misrepresentations and omissions,<br />
fraudulent misrepresentations and omissions, concert<br />
of action, civil conspiracy, violations of unfair trade<br />
practices and consumer protection laws, enterprise<br />
liability, market share liability, nuisance, unjust<br />
enrichment and other theories. The plaintiffs seek<br />
various damages and relief, including personal injury<br />
and property damage, costs relating to the detection<br />
and abatement of lead-based paint from buildings,<br />
costs associated with a public education campaign,<br />
medical monitoring costs and others. The Company<br />
believes that the litigation is without merit and is<br />
vigorously defending such litigation. Considering the<br />
Company’s past operations relating to lead pigments<br />
and lead-based paints, it is possible that additional<br />
lead pigment and lead-based paint litigation may be<br />
filed against the Company based upon similar or<br />
different legal theories and seeking similar or different<br />
types of damages and relief.<br />
Litigation is inherently subject to many uncertainties.<br />
Adverse court rulings or determinations of liability could<br />
affect the lead pigment and lead-based paint litigation<br />
against the Company and encourage an increase in the<br />
number and nature of future claims and proceedings. In<br />
14| The <strong>Sherwin</strong>-<strong>Williams</strong> Company <strong>2000</strong> <strong>Annual</strong> <strong>Report</strong>
addition, from time to time, various legislation and<br />
administrative regulations have been enacted or<br />
proposed to impose obligations on present and former<br />
manufacturers of lead pigments and lead-based paints<br />
respecting asserted health concerns associated with<br />
such products and to overturn court decisions in which<br />
the Company and other manufacturers have been<br />
successful. Due to the uncertainties involved,<br />
management is unable to predict the outcome of such<br />
litigation or the number or nature of possible future<br />
claims and proceedings, or the affect of any such<br />
legislation and administrative regulations. In addition,<br />
management cannot reasonably determine the scope or<br />
amount of the potential costs and liabilities related to<br />
such litigation, or such legislation and regulations. The<br />
Company has not accrued any amounts for such<br />
litigation. Any potential liability that may result from<br />
such litigation or such legislation and regulations<br />
cannot reasonably be estimated. However, based upon,<br />
among other things, the outcome of such litigation to<br />
date, management does not currently believe that the<br />
costs or potential liability ultimately determined to be<br />
attributable to the Company arising out of such<br />
litigation will have a material adverse effect on the<br />
Company's results of operations, liquidity or financial<br />
condition.<br />
The operations of the Company, like those of other<br />
companies in our industry, are subject to various<br />
federal, state and local environmental laws and<br />
regulations. These laws and regulations not only govern<br />
our current operations and products, but also impose<br />
potential liability on the Company for past operations<br />
which were conducted utilizing practices and<br />
procedures that were considered acceptable under the<br />
laws and regulations existing at that time. The Company<br />
expects environmental laws and regulations to impose<br />
increasingly stringent requirements upon the Company<br />
and our industry in the future. The Company believes<br />
that it conducts its operations in compliance with<br />
applicable environmental laws and regulations and has<br />
implemented various programs designed to protect the<br />
environment and promote continued compliance.<br />
Depreciation of capital expenditures and other<br />
expenses related to ongoing environmental compliance<br />
measures are included in the normal operating<br />
expenses of conducting business. The Company’s<br />
capital expenditures, depreciation and other expenses<br />
related to ongoing environmental compliance measures<br />
were not material to the Company’s financial condition,<br />
results of operations or liquidity during <strong>2000</strong>, and the<br />
Company does not expect that such capital<br />
expenditures and other expenses will be material to the<br />
Company’s financial condition, results of operations or<br />
liquidity in 2001.<br />
The Company is involved with environmental<br />
compliance, investigation and remediation activities at<br />
some of its current and former sites (including former<br />
sites which were previously owned and/or operated by<br />
businesses acquired by the Company). The Company,<br />
together with other parties, has also been designated a<br />
potentially responsible party under federal and state<br />
environmental protection laws for the investigation and<br />
remediation of environmental contamination and<br />
hazardous waste at a number of third-party sites,<br />
primarily Superfund sites. The Company may be<br />
similarly designated with respect to additional thirdparty<br />
sites in the future.<br />
The Company accrues for environmental-related<br />
activities relating to its past operations and third-party<br />
sites, including Superfund sites, for which commitments<br />
or clean-up plans have been developed and for which<br />
costs can be reasonably estimated. These estimated<br />
costs are determined based on currently available facts<br />
regarding each site. The Company continuously<br />
assesses its potential liability for investigation and<br />
remediation-related activities and adjusts its<br />
environmental-related accruals as information becomes<br />
available upon which more accurate costs can be<br />
reasonably estimated and as additional accounting<br />
guidelines are issued which require changing the<br />
estimated costs or the procedure utilized in estimating<br />
such costs. Actual costs incurred may vary from these<br />
estimates due to the inherent uncertainties involved<br />
including, among others, the number and financial<br />
condition of parties involved with respect to any given<br />
site, the volumetric contribution which may be<br />
attributed to the Company relative to that attributed to<br />
other parties, the nature and magnitude of the wastes<br />
involved, the various technologies that can be used for<br />
remediation and the determination of acceptable<br />
remediation with respect to a particular site. The<br />
Company’s environmental-related contingencies are<br />
The <strong>Sherwin</strong>-<strong>Williams</strong> Company <strong>2000</strong> <strong>Annual</strong> <strong>Report</strong> | 15
expected to be resolved over an extended period<br />
of time.<br />
Pursuant to a Consent Decree entered into with the<br />
United States of America in 1997, on behalf of the<br />
Environmental Protection Agency, filed in the United<br />
States District Court for the Northern District of Illinois,<br />
the Company has agreed, in part, to (i) conduct an<br />
investigation at its southeast Chicago, Illinois facility to<br />
determine the nature, extent and potential impact, if<br />
any, of environmental contamination at the facility and<br />
(ii) implement remedial action measures, if required, to<br />
address any environmental contamination identified<br />
pursuant to the investigation. While the Company<br />
continues to investigate this site, certain initial remedial<br />
actions have occurred at this site.<br />
In 1999, the Company entered into a settlement<br />
agreement with PMC, Inc. settling a lawsuit brought by<br />
PMC regarding the Company’s former manufacturing<br />
facility in Chicago, Illinois which was sold to PMC in<br />
1985. Pursuant to the terms of the settlement<br />
agreement, the Company agreed, in part, to investigate<br />
and remediate, as necessary, certain soil and/or<br />
groundwater contamination caused by historical<br />
disposals, discharges, releases and/or events occurring<br />
at this facility. In <strong>2000</strong>, the Company entered into a<br />
Consent Decree with the People of the State of Illinois<br />
settling an action brought by the State of Illinois against<br />
the Company regarding the PMC facility. Under the<br />
Consent Decree, the Company agreed, in part, to<br />
investigate and remediate, as necessary, certain soil<br />
and/or groundwater contamination caused by historical<br />
disposals, discharges, releases and/or events occurring<br />
at this facility. The Company is currently conducting its<br />
investigation of this facility.<br />
With respect to the Company’s southeast Chicago,<br />
Illinois facility and the PMC facility, the Company has<br />
evaluated its potential liability and, based upon its<br />
investigations to date, has accrued appropriate<br />
amounts. However, due to the uncertainties<br />
surrounding these facilities, the Company’s ultimate<br />
liability may result in costs that are significantly higher<br />
than currently accrued. In such event, the recording of<br />
the liability may result in a material impact on net<br />
income for the annual or interim period during which<br />
the additional costs are accrued. The Company expects<br />
the contingent liabilities related to these facilities to be<br />
resolved over an extended period of time.<br />
The Company does not believe that any potential<br />
liability ultimately attributed to the Company for its<br />
environmental-related matters will have a material<br />
adverse effect on the Company’s financial condition,<br />
liquidity, cash flow or, except as set forth in the<br />
preceding paragraph, net income. See Note 9, on page<br />
32 of this report, for discussion of the environmentalrelated<br />
accruals included in the Company’s<br />
Consolidated Balance Sheets.<br />
Shareholders’ equity decreased $226.7 million during<br />
<strong>2000</strong> to $1,471.9 million due primarily to the purchase<br />
of 6,800,000 shares of Company stock for treasury at a<br />
cost of $146.9 million. The Company acquires its own<br />
stock for general corporate purposes and, depending on<br />
its future cash position and market conditions, it may<br />
acquire additional shares in the future. The Company<br />
had remaining authorization at December 31, <strong>2000</strong> to<br />
purchase 13,200,000 shares of its common stock. Also<br />
contributing to the decrease in shareholders’ equity<br />
were cash dividends paid of $88.1 million and other<br />
comprehensive losses related to foreign currency<br />
translations of $18.0 million. These decreases were<br />
partially offset by current year net income of $16.0<br />
million.<br />
Comprehensive loss is comprised of net income and the<br />
components of other comprehensive income or loss<br />
including foreign currency translation adjustments. The<br />
<strong>2000</strong> increase of $18.0 million in Cumulative other<br />
comprehensive loss was attributed to weakness in<br />
several foreign operation’s functional currencies, while<br />
the 1999 increase of $100.7 million occurred primarily<br />
due to the devaluation of the Brazilian real. In January<br />
1999, the Brazilian Central Bank eliminated its<br />
governmental policy of supporting and tightly managing<br />
the trading band of the real and allowed it to trade<br />
freely in the open market against other currencies.<br />
Shortly after this announcement, the Brazilian real<br />
weakened significantly in trading with the U.S. dollar<br />
and other foreign currencies and has only partially<br />
recovered since that time. As a result of the floating<br />
exchange rate of certain foreign currencies, the<br />
Company believes it may experience continuing losses<br />
from foreign currency translation. The Company does<br />
16| The <strong>Sherwin</strong>-<strong>Williams</strong> Company <strong>2000</strong> <strong>Annual</strong> <strong>Report</strong>
not expect any devaluation or other currency translation<br />
losses to have a material adverse effect on the<br />
Company’s financial condition, results of operations or<br />
cash flows. See Note 16, on page 35 of this report.<br />
The Company is exposed to market risk through various<br />
financial instruments, including fixed rate debt<br />
instruments. The Company does not believe that any<br />
potential loss related to these financial instruments<br />
will have a material adverse effect on the Company’s<br />
financial condition, results of operations or cash flows.<br />
The <strong>2000</strong> annual dividend of $.54 per share<br />
approximated our payout ratio target of 30.0 percent of<br />
the prior year’s earnings. This annual dividend<br />
represented the twenty-first consecutive year that the<br />
dividend has increased and a compounded annual rate<br />
of increase of 24.5 percent since the dividend was<br />
reinstated in the fourth quarter of 1979. At a meeting<br />
held on February 7, 2001, the Board of Directors<br />
increased the quarterly dividend to $.145 per share.<br />
RESULTS OF OPERATIONS - <strong>2000</strong> vs 1999<br />
Consolidated net sales increased 4.2 percent to $5.2<br />
billion in <strong>2000</strong>, primarily due to increased sales in the<br />
Paint Stores, Automotive Finishes and International<br />
Coatings Segments that were partially offset by<br />
decreased sales in the Consumer Segment.<br />
Net external sales in the Paint Stores Segment during<br />
<strong>2000</strong> increased 6.1 percent to $3.2 billion as higher<br />
volume sales of paint products outpaced increases in<br />
the stores’ other product lines (wallcoverings,<br />
floorcoverings, spray equipment and associated<br />
products) with sales to professional painters and<br />
industrial users showing the greatest gains.<br />
Comparable-store sales increased 3.7 percent in <strong>2000</strong>.<br />
This Segment ended <strong>2000</strong> with 2,488 stores in<br />
operation compared to 2,396 stores in operation at the<br />
end of the prior year. It is the objective of the Paint<br />
Stores Segment to expand its store base an average of<br />
three percent each year. In <strong>2000</strong>, the Segment added<br />
92 net new stores and expects to add 65 to 70 net new<br />
stores in 2001.<br />
External sales in the Consumer Segment decreased 0.4<br />
percent during <strong>2000</strong> to $1.2 billion primarily due to a<br />
sluggish domestic do-it-yourself market. New product<br />
launches, sales to new customers and increased sales<br />
to certain existing customers could not offset the effects<br />
of the sluggish retail market. The Company expects that<br />
additional Consumer Segment sales in 2001 from new<br />
product introductions, expansion of its presence at<br />
certain retailers and new customer accounts will not be<br />
sufficient to offset the effects of lost business and<br />
customer accounts in <strong>2000</strong>. In addition, a sluggish<br />
domestic do-it-yourself market is expected to continue<br />
through at least the first half of 2001 and adversely<br />
impact year-over-year sales comparisons with <strong>2000</strong>.<br />
External sales in the Automotive Finishes Segment<br />
increased 4.8 percent during <strong>2000</strong> to $493.4 million<br />
due primarily to the sales of vehicle refinish products.<br />
The soft fourth quarter domestic economy negatively<br />
impacted this Segment’s OEM sales. The Company<br />
expects that sales from new product and color<br />
introductions, a stronger vehicle refinish market and<br />
an increase in the number of automotive branches will<br />
result in a sales increase for this Segment in 2001.<br />
External sales in the International Coatings Segment<br />
increased 2.6 percent to $307.0 million due primarily to<br />
increased gallons sold. Sales in local currencies were up<br />
6.5 percent, while U.S. dollar comparisons were affected<br />
by currency conversions. Net sales for the year<br />
continued to be impacted by a shift in sales to lower<br />
priced products and competitive pricing due to poor<br />
market conditions in South America, particularly in<br />
Argentina. The Company expects to realize sales<br />
improvements in the International Coatings Segment in<br />
2001 as economic conditions are expected to improve<br />
in most South American countries in which we operate.<br />
Consolidated gross profit as a percent of sales<br />
decreased to 44.3 percent from 44.9 percent in 1999.<br />
The Company’s gross profit margin was impacted by<br />
raw material cost increases, inflated energy costs and<br />
higher distribution costs. The Paint Stores Segment’s<br />
<strong>2000</strong> gross profit margin was slightly higher than last<br />
year primarily due to increased paint volume sales, a<br />
favorable product sales mix and selective selling price<br />
increases. Gross profit margin in the Consumer Segment<br />
was lower than last year as competitive pricing<br />
pressures prohibited selling price increases sufficient<br />
to offset increased raw material costs and higher<br />
distribution costs. In addition, costs associated with<br />
The <strong>Sherwin</strong>-<strong>Williams</strong> Company <strong>2000</strong> <strong>Annual</strong> <strong>Report</strong> | 17
new product launches and new customer start-ups<br />
could not be offset by volume related manufacturing<br />
efficiencies and certain cost reductions. Gross profit<br />
margin decreased in the Automotive Finishes Segment<br />
and was also unfavorably impacted by increased raw<br />
material costs. Gross profit margin in the International<br />
Coatings Segment decreased primarily due to price<br />
competition, increased raw material costs and an<br />
unfavorable product sales mix to lower margin products.<br />
Consolidated selling, general and administrative (SG&A)<br />
expenses remained flat as a percent of sales at 33.4<br />
percent. Increased expenses in <strong>2000</strong> related to new<br />
store openings, new products, new customers and the<br />
consolidation of two research facilities and division<br />
administrative functions into the automotive technology<br />
center. Offsetting these increased expenses was the<br />
reduction in costs in <strong>2000</strong> due to the completion in<br />
1999 of the Company’s Year <strong>2000</strong> compliance project.<br />
The Paint Stores Segment’s SG&A ratio was slightly<br />
unfavorable compared to last year primarily due to<br />
increased expenses related to 92 net new store<br />
openings. The Paint Stores Segment continued its<br />
investment in expanding its business in spite of the soft<br />
domestic economy during the latter part of the year. A<br />
slightly favorable SG&A ratio in the Consumer Segment<br />
for <strong>2000</strong> as compared to last year was primarily a result<br />
of certain administrative cost reductions partially offset<br />
by decreased sales and increased costs of new product<br />
launches and new customer start-ups. The Automotive<br />
Finishes Segment’s SG&A ratio was also slightly<br />
favorable compared to last year primarily due to higher<br />
sales volume partially offset by severance and moving<br />
costs associated with the consolidation of the<br />
Segment’s research and administrative functions into<br />
the newly purchased automotive technology center.<br />
The International Coatings Segment’s SG&A ratio was<br />
unfavorable primarily due to higher commissions in<br />
Brazil relating to increased sales, partially offset by<br />
overall sales increases.<br />
During the fourth quarter of <strong>2000</strong>, the Company<br />
recognized an asset impairment charge of $352.0<br />
million ($293.6 million after-tax or $1.80 per diluted<br />
share) in the Consumer Segment to reduce the carrying<br />
values of certain long-lived assets, primarily goodwill, to<br />
their estimated fair values. Cash flow in <strong>2000</strong> was not<br />
affected by this accounting charge which is more fully<br />
described in Note 2 on page 28 of this report.<br />
Accordingly, consolidated segment operating profit for<br />
the year was reduced to 2.8 percent of sales compared<br />
to 9.8 percent of sales in 1999. Excluding the asset<br />
impairment charge, consolidated segment operating<br />
profit increased 1.1 percent but declined as a percent of<br />
sales to 9.5 percent from 9.8 percent last year. Segment<br />
operating profit of the Paint Stores Segment increased<br />
9.2 percent to 12.9 percent of sales, as increased paint<br />
volume sales, a favorable product mix and selective<br />
selling price increases more than offset increased<br />
expenses related to new store openings. The Consumer<br />
Segment’s operating profit, excluding the effects of the<br />
asset impairment charge, declined 8.0 percent primarily<br />
due to competitive pricing pressures that did not allow<br />
recovery of all increased raw material costs and higher<br />
distribution costs. Segment operating profit of the<br />
Automotive Finishes Segment decreased $5.3 million or<br />
7.9 percent primarily due to increased raw material costs<br />
and a $6.8 million provision for the disposition of two<br />
research centers idled by the consolidation into the new<br />
automotive technology center. See Note 5, on page 29<br />
of this report, for additional disposition and termination<br />
of operations information. Segment operating profit of<br />
the International Coatings Segment decreased to $17.7<br />
million from $33.9 million last year primarily due to<br />
increased price competition, increased raw material<br />
costs and an unfavorable product sales mix to lower<br />
margin products. There are certain risks in transacting<br />
business internationally, such as changes in applicable<br />
laws and regulatory requirements, political instability,<br />
general economic and labor conditions, fluctuations in<br />
currency exchange rates and expatriation restrictions,<br />
which could adversely affect the financial condition or<br />
results of operation of the Company’s consolidated<br />
foreign subsidiaries. Corporate expenses decreased<br />
in <strong>2000</strong> primarily due to the reduction in certain<br />
information systems expenses, including the<br />
completion of the Company’s Year <strong>2000</strong> compliance<br />
project in 1999, partially offset by increased interest<br />
expense and certain unallocated employee benefit<br />
expenses. Refer to Note 17, on pages 35 through 37<br />
of this report, for additional reportable segment<br />
information.<br />
Interest expense increased slightly in <strong>2000</strong> primarily<br />
due to higher average short-term debt outstanding and<br />
18| The <strong>Sherwin</strong>-<strong>Williams</strong> Company <strong>2000</strong> <strong>Annual</strong> <strong>Report</strong>
ates, partially offset by lower average long-term debt<br />
outstanding. As a result, interest coverage, excluding<br />
the effects of the asset impairment charge, remained<br />
unchanged from 1999 at 9.0 times. Interest coverage<br />
in <strong>2000</strong>, after recording the effects of the asset<br />
impairment charge, decreased to 3.3 times. Fixed charge<br />
coverage, excluding the effects of the asset impairment<br />
charge, which is calculated using interest and rent<br />
expense, decreased to 4.5 times from 5.8 times in 1999.<br />
Fixed charge coverage in <strong>2000</strong>, after recording the<br />
effects of the asset impairment charge, was 1.2 times.<br />
Interest and net investment income decreased in <strong>2000</strong><br />
primarily due to lower average cash and short-term<br />
investment balances, partially offset by higher average<br />
yields. See Note 4, on page 29 of this report, for further<br />
detail on Other expense - net. As shown in Note 13, on<br />
page 34 of this report, the effective income tax rate was<br />
88.9 percent in <strong>2000</strong> due to the effect of a portion of<br />
the asset impairment charge that was not deductible for<br />
tax purposes. Excluding the effects of the asset<br />
impairment charge, the effective tax rate declined to<br />
37.5 percent from 38.0 percent in 1999.<br />
Net income decreased in <strong>2000</strong> to $16.0 million from<br />
$303.9 million in 1999 due primarily to the effects of the<br />
asset impairment charge. Net income per share-diluted<br />
was reduced to $.10 per share from $1.80 last year. See<br />
Note 15, on page 35 of this report, for detailed<br />
computations. Excluding the effects of the asset<br />
impairment charge, net income for <strong>2000</strong> increased 1.9<br />
percent to $309.7 million, and net income per share<br />
increased 5.6 percent to $1.90 per diluted share.<br />
RESULTS OF OPERATIONS - 1999 vs 1998<br />
Consolidated net sales increased 1.4 percent to $5.0<br />
billion in 1999, primarily due to increased sales in the<br />
Paint Stores Segment which were partially offset by<br />
decreased sales in each of the other reportable<br />
segments.<br />
Net external sales in the Paint Stores Segment during<br />
1999 increased 6.3 percent primarily due to higher<br />
volume sales of paint products, combined with sales<br />
gains in each of the remaining major product lines<br />
(wallcoverings, floorcoverings, spray equipment and<br />
associated products). Comparable-store sales increased<br />
4.0 percent in 1999. The Company launched its web<br />
site, “www.sherwin-williams.com” in 1999. A portion of<br />
the web site provides Paint Stores Segment customers,<br />
painting contractors, and others with product<br />
information and store locations along with do-it-yourself<br />
instruction.<br />
External sales in the Consumer Segment decreased 4.5<br />
percent during 1999 primarily due to the bankruptcy<br />
and subsequent liquidation of a large retail customer,<br />
the anticipated sales losses due to the closing of a<br />
Cleaning Solutions plant in the fourth quarter of 1998,<br />
and slow do-it-yourself coatings sales at certain<br />
customers.<br />
External sales in the Automotive Finishes Segment<br />
declined 0.6 percent. The sales decrease in this<br />
Segment was primarily due to the effects of foreign<br />
currency translation losses and, to a lesser extent, a<br />
soft domestic automotive refinish market.<br />
External sales in the International Coatings Segment<br />
declined 14.0 percent. Sales declines in the<br />
International Coatings Segment resulted primarily from<br />
the first quarter 1999 devaluation of the Brazilian real<br />
and continuing poor market conditions in South<br />
America. Gallons sold and sales in local currencies were<br />
up in most market areas.<br />
Consolidated gross profit as a percent of sales<br />
increased to 44.9 percent from 43.2 percent in 1998.<br />
The Paint Stores Segment’s 1999 gross profit margin<br />
was slightly higher than 1998 primarily due to a<br />
favorable product sales mix. Gross profit margin in the<br />
Consumer Segment was higher than 1998 as increased<br />
factory efficiencies and cost reductions associated with<br />
closing four manufacturing plants early in 1999 took<br />
effect. Gross profit margin in the Automotive Finishes<br />
Segment increased slightly due to product sales mix.<br />
Gross profit margin in the International Coatings<br />
Segment increased primarily due to increased factory<br />
efficiencies and cost reduction efforts.<br />
SG&A expenses as a percent of sales increased to 33.4<br />
percent in 1999 from 32.4 percent in 1998 resulting<br />
primarily from increased expenses related to new store<br />
openings, bad debts, certain employee benefits and<br />
information systems, partially offset by decreased SG&A<br />
expenses in the Consumer Segment primarily resulting<br />
from the consolidation of administrative functions of<br />
The <strong>Sherwin</strong>-<strong>Williams</strong> Company <strong>2000</strong> <strong>Annual</strong> <strong>Report</strong> | 19
four separate operating divisions into one. The Paint<br />
Stores Segment’s SG&A ratio was slightly unfavorable<br />
compared to 1998 primarily due to increased expenses<br />
related to new store openings. A slightly unfavorable<br />
SG&A ratio in the Consumer Segment for 1999 as<br />
compared to 1998 was primarily a result of decreased<br />
sales and increased bad debt expense, partially offset<br />
by the consolidation of administrative functions.<br />
Automotive Finishes Segment’s SG&A ratio was slightly<br />
unfavorable compared to 1998 primarily due to<br />
increases in bad debt expense and reduced sales<br />
volume. International Coatings Segment’s SG&A ratio<br />
was unfavorable primarily due to reduced sales.<br />
Consolidated operating profits increased 11.4 percent in<br />
1999. Operating profits of the Paint Stores Segment<br />
increased 8.6 percent, primarily due to increased sales<br />
volume and gross profit margins. The Consumer<br />
Segment’s operating profits were 23.7 percent higher<br />
than 1998 primarily due to decreased SG&A expenses<br />
and increased gross profit margins, partially offset by<br />
lower sales volume. Operating profits of the Automotive<br />
Finishes Segment increased 2.0 percent primarily due to<br />
increased gross profit margins, partially offset by<br />
slightly lower sales and increased SG&A expenses.<br />
Operating profits of the International Coatings Segment<br />
increased 40.3 percent primarily due to decreased<br />
foreign currency transaction losses associated with U.S.<br />
dollar denominated debt that was reduced and<br />
improved gross profit margins, partially offset by<br />
decreased sales and increased SG&A expenses.<br />
Corporate expenses increased in 1999 primarily due to<br />
the increase in certain unallocated employee benefit<br />
and information systems expenses, partially offset by<br />
decreased interest expense. Additionally, the 1998<br />
Corporate expenses included a net gain related to the<br />
sale of the Company’s joint venture interest in American<br />
Standox, Inc.<br />
Interest expense decreased in 1999 primarily due to<br />
lower average outstanding debt balances. As a result,<br />
interest coverage increased to 9.0 times from 7.1 times<br />
in 1998. Fixed charge coverage, which is calculated<br />
using interest and rent expense, increased to 3.7 times<br />
from 3.3 times in 1998.<br />
Interest and net investment income decreased in 1999<br />
primarily due lower average yields, partially offset by<br />
slightly higher average cash and short-term investment<br />
balances. See Note 4, on page 29 of this report, for<br />
further detail on Other expense - net. As shown in Note<br />
13, on page 34 of this report, the effective income tax<br />
rate in 1999 remained unchanged from 1998 at 38<br />
percent.<br />
Net income increased 11.4 percent in 1999 to $303.9<br />
million from $272.9 million in 1998. Net income per<br />
share-diluted increased 14.6 percent to $1.80 from<br />
$1.57. See Note 15, on page 35 of this report for detailed<br />
computations.<br />
20| The <strong>Sherwin</strong>-<strong>Williams</strong> Company <strong>2000</strong> <strong>Annual</strong> <strong>Report</strong>
REPORT OF MANAGEMENT<br />
Shareholders<br />
The <strong>Sherwin</strong>-<strong>Williams</strong> Company<br />
We have prepared the accompanying<br />
consolidated financial statements and<br />
related information included herein for<br />
the years ended December 31, <strong>2000</strong>,<br />
1999 and 1998. The primary<br />
responsibility for the integrity of the<br />
financial information rests with<br />
management. This information is<br />
prepared in accordance with accounting<br />
principles generally accepted in the<br />
United States, based upon our best<br />
estimates and judgments and giving due<br />
consideration to materiality.<br />
The Company maintains accounting and<br />
control systems which are designed to<br />
provide reasonable assurance that assets<br />
are safeguarded from loss or<br />
unauthorized use and which produce<br />
records adequate for preparation of<br />
financial information. There are limits<br />
inherent in all systems of internal control<br />
based on the recognition that the cost of<br />
such systems should not exceed the<br />
benefits to be derived. We believe our<br />
systems provide this appropriate<br />
balance.<br />
The Board of Directors pursues its<br />
responsibility for these financial<br />
statements through the Audit Committee,<br />
composed exclusively of independent<br />
directors. The Committee meets<br />
periodically with management, internal<br />
auditors and our independent auditors to<br />
discuss the adequacy of financial<br />
controls, the quality of financial reporting<br />
and the nature, extent and results of the<br />
audit effort. Both the internal auditors<br />
and independent auditors have private<br />
and confidential access to the Audit<br />
Committee at all times.<br />
C. M. Connor<br />
Chairman and Chief<br />
Executive Officer<br />
L. J. Pitorak<br />
Senior Vice President - Finance,<br />
Treasurer and Chief Financial<br />
Officer<br />
J. L. Ault<br />
Vice President -<br />
Corporate Controller<br />
CAUTIONARY STATEMENT REGARDING FORWARD-LOOKING INFORMATION<br />
Certain statements contained in<br />
“Management’s Discussion and Analysis<br />
of Financial Condition and Results of<br />
Operations,” “Letter to Shareholders,”<br />
and elsewhere in this report constitute<br />
“forward-looking statements” within the<br />
meaning of Section 27A of the Securities<br />
Act of 1933 and Section 21E of the<br />
Securities Exchange Act of 1934. These<br />
forward-looking statements are based<br />
upon management’s current<br />
expectations, estimates, assumptions<br />
and beliefs concerning future events and<br />
conditions and may discuss, among other<br />
things, anticipated future performance<br />
(including sales and earnings), expected<br />
growth and future business plans. Any<br />
statement that is not historical in nature<br />
is a forward-looking statement and may<br />
be identified by the use of words and<br />
phrases such as “expects,” “anticipates,”<br />
“believes,” “will likely result,” “will<br />
continue,” “plans to,” and similar<br />
expressions. Readers are cautioned not<br />
to place undue reliance on any forwardlooking<br />
statements. Forward-looking<br />
statements are necessarily subject to<br />
risks, uncertainties and other factors,<br />
many of which are outside the control of<br />
the Company, that could cause actual<br />
results to differ materially from such<br />
statements. These risks, uncertainties<br />
and other factors include such things as:<br />
general business conditions, strengths of<br />
retail economies and the growth in the<br />
coatings industry; competitive factors,<br />
including pricing pressures and product<br />
innovation and quality; changes in raw<br />
material availability and pricing; changes<br />
in the Company’s relationships with<br />
customers and suppliers; the ability of<br />
the Company to successfully integrate<br />
past and future acquisitions into its<br />
existing operations, as well as the<br />
performance of the businesses acquired;<br />
the ability of the Company to successfully<br />
complete planned divestitures; changes<br />
in general domestic economic conditions<br />
such as inflation rates, interest rates and<br />
tax rates; risk and uncertainties<br />
associated with the Company’s<br />
expansion into foreign markets, including<br />
inflation rates, recessions, foreign<br />
currency exchange rates, foreign<br />
investment and repatriation restrictions<br />
and other external economic and political<br />
factors; the achievement of growth in<br />
developing markets, such as Mexico and<br />
South America; increasingly stringent<br />
domestic and foreign governmental<br />
regulations including those affecting the<br />
environment; inherent uncertainties<br />
involved in assessing the Company’s<br />
potential liability for environmental<br />
remediation-related activities; the nature,<br />
cost, quantity and outcome of pending<br />
and future litigation and other claims,<br />
including the lead pigment and leadbased<br />
paint litigation and the affect of<br />
any legislation and administrative<br />
regulations relating thereto; and unusual<br />
weather conditions.<br />
Any forward-looking statement speaks<br />
only as of the date on which such<br />
statement is made, and the Company<br />
undertakes no obligation to update any<br />
forward-looking statement, whether as a<br />
result of new information, future events<br />
or otherwise.<br />
The <strong>Sherwin</strong>-<strong>Williams</strong> Company <strong>2000</strong> <strong>Annual</strong> <strong>Report</strong> | 21
Shareholders and Board of Directors<br />
The <strong>Sherwin</strong>-<strong>Williams</strong> Company<br />
Cleveland, Ohio<br />
We have audited the accompanying<br />
consolidated balance sheets of The<br />
<strong>Sherwin</strong>-<strong>Williams</strong> Company and<br />
subsidiaries as of December 31, <strong>2000</strong>,<br />
1999 and 1998, and the related<br />
statements of consolidated income,<br />
shareholders’ equity and cash flows for<br />
each of the three years in the period<br />
ended December 31, <strong>2000</strong>. These<br />
financial statements are the<br />
responsibility of the Company’s<br />
management. Our responsibility is to<br />
express an opinion on these financial<br />
statements based on our audits.<br />
REPORT OF INDEPENDENT AUDITORS<br />
We conducted our audits in accordance<br />
with auditing standards generally<br />
accepted in the United States. Those<br />
standards require that we plan and<br />
perform the audit to obtain reasonable<br />
assurance about whether the financial<br />
statements are free of material<br />
misstatement. An audit includes<br />
examining, on a test basis, evidence<br />
supporting the amounts and disclosures<br />
in the financial statements. An audit also<br />
includes assessing the accounting<br />
principles used and significant estimates<br />
made by management, as well as<br />
evaluating the overall financial statement<br />
presentation. We believe that our audits<br />
provide a reasonable basis for our<br />
opinion.<br />
In our opinion, the consolidated financial<br />
statements referred to above present<br />
fairly, in all material respects, the<br />
consolidated financial position of The<br />
<strong>Sherwin</strong>-<strong>Williams</strong> Company and<br />
subsidiaries at December 31, <strong>2000</strong>, 1999<br />
and 1998, and the consolidated results of<br />
their operations and their cash flows for<br />
each of the three years in the period<br />
ended December 31, <strong>2000</strong>, in conformity<br />
with accounting principles generally<br />
accepted in the United States.<br />
Cleveland, Ohio<br />
January 26, 2001<br />
22| The <strong>Sherwin</strong>-<strong>Williams</strong> Company <strong>2000</strong> <strong>Annual</strong> <strong>Report</strong>
STATEMENTS OF CONSOLIDATED INCOME<br />
(Thousands of Dollars Except Per Share Data)<br />
Year ended December 31,<br />
<strong>2000</strong> 1999 1998<br />
Net sales . . . . . . . . . . . . . . . . . . . . . . . . . . . . . . . . . . . . . . . . . . . . . . . . . . . . . . . $ 5,211,624 $ 5,003,837 $ 4,934,430<br />
Cost of goods sold . . . . . . . . . . . . . . . . . . . . . . . . . . . . . . . . . . . . . . . . . . . . . . . 2,904,013 2,755,323 2,804,459<br />
Gross profit . . . . . . . . . . . . . . . . . . . . . . . . . . . . . . . . . . . . . . . . . . . . . . . . . . . . . 2,307,611 2,248,514 2,129,971<br />
Percent to net sales . . . . . . . . . . . . . . . . . . . . . . . . . . . . . . . . . . . . . . . . . . . . 44.3% 44.9% 43.2%<br />
Selling, general and administrative expenses . . . . . . . . . . . . . . . . . . . . . . . . . 1,740,367 1,673,449 1,598,333<br />
Percent to net sales . . . . . . . . . . . . . . . . . . . . . . . . . . . . . . . . . . . . . . . . . . . . 33.4% 33.4% 32.4%<br />
Impairment of long-lived assets . . . . . . . . . . . . . . . . . . . . . . . . . . . . . . . . . . . . 352,040<br />
Operating income . . . . . . . . . . . . . . . . . . . . . . . . . . . . . . . . . . . . . . . . . . . . . . . . 215,204 575,065 531,638<br />
Percent to net sales . . . . . . . . . . . . . . . . . . . . . . . . . . . . . . . . . . . . . . . . . . . . 4.1% 11.5% 10.8%<br />
Interest expense . . . . . . . . . . . . . . . . . . . . . . . . . . . . . . . . . . . . . . . . . . . . . . . . . 62,026 61,168 71,971<br />
Interest and net investment income . . . . . . . . . . . . . . . . . . . . . . . . . . . . . . . . . (4,981) (5,761) (6,482)<br />
Other expense - net . . . . . . . . . . . . . . . . . . . . . . . . . . . . . . . . . . . . . . . . . . . . . . 14,753 29,540 26,046<br />
Income before income taxes . . . . . . . . . . . . . . . . . . . . . . . . . . . . . . . . . . . . . . . 143,406 490,118 440,103<br />
Income taxes . . . . . . . . . . . . . . . . . . . . . . . . . . . . . . . . . . . . . . . . . . . . . . . . . . . 127,380 186,258 167,239<br />
Net income . . . . . . . . . . . . . . . . . . . . . . . . . . . . . . . . . . . . . . . . . . . . . . . . . . . . . $ 16,026 $ 303,860 $ 272,864<br />
Net income per share:<br />
Basic . . . . . . . . . . . . . . . . . . . . . . . . . . . . . . . . . . . . . . . . . . . . . . . . . . . . . . . . $ .10 $ 1.81 $ 1.58<br />
Diluted . . . . . . . . . . . . . . . . . . . . . . . . . . . . . . . . . . . . . . . . . . . . . . . . . . . . . . $ .10 $ 1.80 $ 1.57<br />
See notes to consolidated financial statements.<br />
The <strong>Sherwin</strong>-<strong>Williams</strong> Company <strong>2000</strong> <strong>Annual</strong> <strong>Report</strong> | 23
CONSOLIDATED BALANCE SHEETS<br />
(Thousands of Dollars)<br />
Assets<br />
December 31,<br />
<strong>2000</strong> 1999 1998<br />
Current assets:<br />
Cash and cash equivalents . . . . . . . . . . . . . . . . . . . . . . . . . . . . . . . . . . . . . . $ 2,896 $ 18,623 $ 19,133<br />
Accounts receivable, less allowance . . . . . . . . . . . . . . . . . . . . . . . . . . . . . . . 594,162 606,046 604,516<br />
Inventories:<br />
Finished goods . . . . . . . . . . . . . . . . . . . . . . . . . . . . . . . . . . . . . . . . . . . . . . 597,472 591,912 568,328<br />
Work in process and raw materials . . . . . . . . . . . . . . . . . . . . . . . . . . . . . . 106,255 111,476 114,195<br />
703,727 703,388 682,523<br />
Deferred income taxes . . . . . . . . . . . . . . . . . . . . . . . . . . . . . . . . . . . . . . . . . . 104,662 108,899 102,818<br />
Other current assets . . . . . . . . . . . . . . . . . . . . . . . . . . . . . . . . . . . . . . . . . . . 146,092 141,143 123,398<br />
Total current assets . . . . . . . . . . . . . . . . . . . . . . . . . . . . . . . . . . . . . . . . . . 1,551,539 1,578,099 1,532,388<br />
Goodwill . . . . . . . . . . . . . . . . . . . . . . . . . . . . . . . . . . . . . . . . . . . . . . . . . . . . . . . 705,547 1,039,555 1,123,128<br />
Intangible assets . . . . . . . . . . . . . . . . . . . . . . . . . . . . . . . . . . . . . . . . . . . . . . . . 259,085 274,924 291,715<br />
Deferred pension assets . . . . . . . . . . . . . . . . . . . . . . . . . . . . . . . . . . . . . . . . . . 364,351 334,094 304,006<br />
Other assets . . . . . . . . . . . . . . . . . . . . . . . . . . . . . . . . . . . . . . . . . . . . . . . . . . . . 147,769 94,464 80,466<br />
Property, plant and equipment:<br />
Land . . . . . . . . . . . . . . . . . . . . . . . . . . . . . . . . . . . . . . . . . . . . . . . . . . . . . . . . 65,546 62,517 67,567<br />
Buildings . . . . . . . . . . . . . . . . . . . . . . . . . . . . . . . . . . . . . . . . . . . . . . . . . . . . 431,524 431,802 422,902<br />
Machinery and equipment . . . . . . . . . . . . . . . . . . . . . . . . . . . . . . . . . . . . . . . 980,560 913,346 906,501<br />
Construction in progress . . . . . . . . . . . . . . . . . . . . . . . . . . . . . . . . . . . . . . . . 52,779 40,262 43,274<br />
1,530,409 1,447,927 1,440,244<br />
Less allowances for depreciation . . . . . . . . . . . . . . . . . . . . . . . . . . . . . . . . . . 808,030 736,251 721,387<br />
722,379 711,676 718,857<br />
Total Assets . . . . . . . . . . . . . . . . . . . . . . . . . . . . . . . . . . . . . . . . . . . . . . . . . . . . $ 3,750,670 $ 4,032,812 $ 4,050,560<br />
Liabilities and Shareholders’ Equity<br />
Current liabilities:<br />
Short-term borrowings . . . . . . . . . . . . . . . . . . . . . . . . . . . . . . . . . . . . . . . . . . $ 106,854<br />
Accounts payable . . . . . . . . . . . . . . . . . . . . . . . . . . . . . . . . . . . . . . . . . . . . . . 448,799 $ 458,919 $ 408,144<br />
Compensation and taxes withheld . . . . . . . . . . . . . . . . . . . . . . . . . . . . . . . . 137,211 140,934 125,698<br />
Current portion of long-term debt . . . . . . . . . . . . . . . . . . . . . . . . . . . . . . . . . 19,376 122,277 118,184<br />
Other accruals . . . . . . . . . . . . . . . . . . . . . . . . . . . . . . . . . . . . . . . . . . . . . . . . 328,435 333,363 345,191<br />
Accrued taxes . . . . . . . . . . . . . . . . . . . . . . . . . . . . . . . . . . . . . . . . . . . . . . . . . 74,568 85,396 76,804<br />
Total current liabilities . . . . . . . . . . . . . . . . . . . . . . . . . . . . . . . . . . . . . . . . 1,115,243 1,140,889 1,074,021<br />
Long-term debt . . . . . . . . . . . . . . . . . . . . . . . . . . . . . . . . . . . . . . . . . . . . . . . . . . 623,587 624,365 730,283<br />
Postretirement benefits other than pensions . . . . . . . . . . . . . . . . . . . . . . . . . . 208,673 206,591 204,763<br />
Other long-term liabilities . . . . . . . . . . . . . . . . . . . . . . . . . . . . . . . . . . . . . . . . . 331,303 362,435 325,553<br />
Shareholders’ equity:<br />
Common stock - $1.00 par value: 159,558,335, 165,663,601<br />
and 171,033,231 shares outstanding at December 31, <strong>2000</strong>,<br />
1999 and 1998, respectively . . . . . . . . . . . . . . . . . . . . . . . . . . . . . . . . . . . 206,848 206,309 205,701<br />
Other capital . . . . . . . . . . . . . . . . . . . . . . . . . . . . . . . . . . . . . . . . . . . . . . . . . . 158,650 150,887 143,686<br />
Retained earnings . . . . . . . . . . . . . . . . . . . . . . . . . . . . . . . . . . . . . . . . . . . . . 1,948,753 2,020,851 1,797,945<br />
Treasury stock, at cost . . . . . . . . . . . . . . . . . . . . . . . . . . . . . . . . . . . . . . . . . . (678,778) (533,891) (386,465)<br />
Cumulative other comprehensive loss . . . . . . . . . . . . . . . . . . . . . . . . . . . . . . (163,609) (145,624) (44,927)<br />
Total shareholders’ equity . . . . . . . . . . . . . . . . . . . . . . . . . . . . . . . . . . . . . 1,471,864 1,698,532 1,715,940<br />
Total Liabilities and Shareholders’ Equity . . . . . . . . . . . . . . . . . . . . . . . . . . . . $ 3,750,670 $ 4,032,812 $ 4,050,560<br />
See notes to consolidated financial statements.<br />
24| The <strong>Sherwin</strong>-<strong>Williams</strong> Company <strong>2000</strong> <strong>Annual</strong> <strong>Report</strong>
STATEMENTS OF CONSOLIDATED CASH FLOWS<br />
(Thousands of Dollars)<br />
Year ended December 31,<br />
<strong>2000</strong> 1999 1998<br />
Operating Activities<br />
Net income . . . . . . . . . . . . . . . . . . . . . . . . . . . . . . . . . . . . . . . . . . . . . . . . . . . . . $ 16,026 $ 303,860 $ 272,864<br />
Adjustments to reconcile net income to net operating cash:<br />
Impairment of long-lived assets . . . . . . . . . . . . . . . . . . . . . . . . . . . . . . . . . . 352,040<br />
Depreciation . . . . . . . . . . . . . . . . . . . . . . . . . . . . . . . . . . . . . . . . . . . . . . . . . . 108,906 105,350 97,821<br />
Deferred income taxes . . . . . . . . . . . . . . . . . . . . . . . . . . . . . . . . . . . . . . . . . . (26,886) 21,170 30,557<br />
Provisions for disposition of operations . . . . . . . . . . . . . . . . . . . . . . . . . . . . 8,023 7,640 23,557<br />
Provisions for environmental-related matters . . . . . . . . . . . . . . . . . . . . . . . . 16,334 4,295<br />
Amortization of intangible assets . . . . . . . . . . . . . . . . . . . . . . . . . . . . . . . . . 51,124 50,394 50,067<br />
Defined benefit pension plans net credit . . . . . . . . . . . . . . . . . . . . . . . . . . . (29,629) (28,083) (30,851)<br />
Net increase in postretirement liability . . . . . . . . . . . . . . . . . . . . . . . . . . . . . 3,682 3,428 5,424<br />
Foreign currency transaction losses . . . . . . . . . . . . . . . . . . . . . . . . . . . . . . . 2,115 3,333 11,773<br />
Other . . . . . . . . . . . . . . . . . . . . . . . . . . . . . . . . . . . . . . . . . . . . . . . . . . . . . . . . 7,744 13,594 554<br />
Change in working capital accounts:<br />
Decrease (increase) in accounts receivable . . . . . . . . . . . . . . . . . . . . . . . . . . 21,264 (28,212) (65,679)<br />
Decrease (increase) in inventories . . . . . . . . . . . . . . . . . . . . . . . . . . . . . . . . . 6,188 (24,420) 35,130<br />
(Decrease) increase in accounts payable . . . . . . . . . . . . . . . . . . . . . . . . . . . . (21,790) 60,487 (12,272)<br />
(Decrease) increase in accrued taxes . . . . . . . . . . . . . . . . . . . . . . . . . . . . . . (11,744) 6,019 32,449<br />
Other . . . . . . . . . . . . . . . . . . . . . . . . . . . . . . . . . . . . . . . . . . . . . . . . . . . . . . . . (22,645) 3,650 35,175<br />
Increase in long-term accrued taxes . . . . . . . . . . . . . . . . . . . . . . . . . . . . . . . . . 10,005 15,715 8,211<br />
Costs incurred for environmental-related matters . . . . . . . . . . . . . . . . . . . . . . . (9,105) (15,808) (14,275)<br />
Costs incurred for disposition of operations . . . . . . . . . . . . . . . . . . . . . . . . . . . (6,173) (15,529) (5,322)<br />
Other . . . . . . . . . . . . . . . . . . . . . . . . . . . . . . . . . . . . . . . . . . . . . . . . . . . . . . . . . . 1,963 (13,808) (10,721)<br />
Net operating cash . . . . . . . . . . . . . . . . . . . . . . . . . . . . . . . . . . . . . . . . . . . . . 461,108 485,114 468,757<br />
Investing Activities<br />
Capital expenditures . . . . . . . . . . . . . . . . . . . . . . . . . . . . . . . . . . . . . . . . . . . . . (132,778) (134,171) (146,129)<br />
Acquisitions of businesses . . . . . . . . . . . . . . . . . . . . . . . . . . . . . . . . . . . . . . . . (60,108) (15,427)<br />
Increase in other investments . . . . . . . . . . . . . . . . . . . . . . . . . . . . . . . . . . . . . . (51,163) (23,435) (19,281)<br />
Other . . . . . . . . . . . . . . . . . . . . . . . . . . . . . . . . . . . . . . . . . . . . . . . . . . . . . . . . . . (8,989) 9,111 6,478<br />
Net investing cash . . . . . . . . . . . . . . . . . . . . . . . . . . . . . . . . . . . . . . . . . . . . . (253,038) (163,922) (158,932)<br />
Financing Activities<br />
Net increase (decrease) in short-term borrowings . . . . . . . . . . . . . . . . . . . . . . 106,854 (106,913)<br />
Increase in long-term debt . . . . . . . . . . . . . . . . . . . . . . . . . . . . . . . . . . . . . . . . . 16,931 4,559<br />
Payments of long-term debt . . . . . . . . . . . . . . . . . . . . . . . . . . . . . . . . . . . . . . . (120,316) (102,046) (54,673)<br />
Payments of cash dividends . . . . . . . . . . . . . . . . . . . . . . . . . . . . . . . . . . . . . . . (88,124) (80,954) (77,801)<br />
Proceeds from stock options exercised . . . . . . . . . . . . . . . . . . . . . . . . . . . . . . . 6,419 7,107 16,818<br />
Treasury stock purchased . . . . . . . . . . . . . . . . . . . . . . . . . . . . . . . . . . . . . . . . . . (146,857) (145,806) (83,791)<br />
Other . . . . . . . . . . . . . . . . . . . . . . . . . . . . . . . . . . . . . . . . . . . . . . . . . . . . . . . . . . 1,662 2,791 7,579<br />
Net financing cash . . . . . . . . . . . . . . . . . . . . . . . . . . . . . . . . . . . . . . . . . . . . . (223,431) (318,908) (294,222)<br />
Effect of exchange rate changes on cash . . . . . . . . . . . . . . . . . . . . . . . . . . . . . . (366) (2,794)<br />
Net (decrease) increase in cash and cash equivalents . . . . . . . . . . . . . . . . . . . (15,727) (510) 15,603<br />
Cash and cash equivalents at beginning of year . . . . . . . . . . . . . . . . . . . . . . . . 18,623 19,133 3,530<br />
Cash and cash equivalents at end of year . . . . . . . . . . . . . . . . . . . . . . . . . . . . . $ 2,896 $ 18,623 $ 19,133<br />
Taxes paid on income . . . . . . . . . . . . . . . . . . . . . . . . . . . . . . . . . . . . . . . . . . . . . $ 156,514 $ 153,890 $ 85,746<br />
Interest paid on debt . . . . . . . . . . . . . . . . . . . . . . . . . . . . . . . . . . . . . . . . . . . . . 64,400 61,868 71,970<br />
See notes to consolidated financial statements.<br />
The <strong>Sherwin</strong>-<strong>Williams</strong> Company <strong>2000</strong> <strong>Annual</strong> <strong>Report</strong> | 25
(Thousands of Dollars Except Per Share Data)<br />
STATEMENTS OF CONSOLIDATED SHAREHOLDERS’ EQUITY<br />
Cumulative<br />
Other<br />
Common Other Retained Treasury Comprehensive<br />
Stock Capital Earnings Stock Loss Total<br />
Balance at January 1, 1998 . . . . . . . . . . . . $ 204,538 $ 119,695 $1,602,882 $ (301,418) $ (33,517) $ 1,592,180<br />
Comprehensive income:<br />
Net income . . . . . . . . . . . . . . . . . . . . . . . 272,864 272,864<br />
Other comprehensive loss . . . . . . . . . . . (11,410) (11,410)<br />
Comprehensive income . . . . . . . . . . . 261,454<br />
Treasury stock purchased . . . . . . . . . . . . . (83,791) (83,791)<br />
Stock issued (tendered)<br />
for exercise of options . . . . . . . . . . . . . . 1,201 23,103 (1,256) 23,048<br />
Restricted stock grants (net activity) . . . . (38) 2,128 2,090<br />
Stock acquired for trust . . . . . . . . . . . . . . . (1,240) (1,240)<br />
Cash dividends -- $.45 per share . . . . . . . (77,801) (77,801)<br />
Balance at December 31, 1998 . . . . . . . . . 205,701 143,686 1,797,945 (386,465) (44,927) 1,715,940<br />
Comprehensive income:<br />
Net income . . . . . . . . . . . . . . . . . . . . . . . 303,860 303,860<br />
Other comprehensive loss . . . . . . . . . . . (100,697) (100,697)<br />
Comprehensive income . . . . . . . . . . . 203,163<br />
Treasury stock purchased . . . . . . . . . . . . . (145,806) (145,806)<br />
Stock issued (tendered)<br />
for exercise of options . . . . . . . . . . . . . . 463 8,597 (252) 8,808<br />
Stock tendered in connection<br />
with restricted stock grants . . . . . . . . . (1,368) (1,368)<br />
Restricted stock grants (net activity) . . . . 145 (69) 76<br />
Stock acquired for trust . . . . . . . . . . . . . . . (1,327) (1,327)<br />
Cash dividends -- $.48 per share . . . . . . . (80,954) (80,954)<br />
Balance at December 31, 1999 . . . . . . . . . 206,309 150,887 2,020,851 (533,891) (145,624) 1,698,532<br />
Comprehensive income:<br />
Net income . . . . . . . . . . . . . . . . . . . . . . . 16,026 16,026<br />
Other comprehensive loss . . . . . . . . . . . (17,985) (17,985)<br />
Comprehensive loss . . . . . . . . . . . . . (1,959)<br />
Treasury stock purchased . . . . . . . . . . . . . (146,857) (146,857)<br />
Stock issued (tendered)<br />
for exercise of options . . . . . . . . . . . . . . 534 8,121 (192) 8,463<br />
Stock tendered in connection<br />
with restricted stock grants . . . . . . . . . (173) (173)<br />
Restricted stock grants (net activity) . . . . 5 3,176 3,181<br />
Stock acquired for trust . . . . . . . . . . . . . . . (1,199) (1,199)<br />
Treasury stock transferred to trust . . . . . . (2,335) 2,335<br />
Cash dividends -- $.54 per share . . . . . . . (88,124) (88,124)<br />
Balance at December 31, <strong>2000</strong> . . . . . . . . . $ 206,848 $ 158,650 $ 1,948,753 $ (678,778) $(163,609) $ 1,471,864<br />
See notes to consolidated financial statements.<br />
26| The <strong>Sherwin</strong>-<strong>Williams</strong> Company <strong>2000</strong> <strong>Annual</strong> <strong>Report</strong>
NOTES TO CONSOLIDATED FINANCIAL STATEMENTS<br />
(Thousands of Dollars Unless Otherwise Indicated)<br />
NOTE 1–SIGNIFICANT ACCOUNTING POLICIES<br />
Consolidation. The consolidated financial statements include all<br />
controlled subsidiaries. Inter-company accounts and transactions<br />
have been eliminated.<br />
Use of estimates. The preparation of consolidated financial<br />
statements in conformity with accounting principles generally<br />
accepted in the United States requires management to make<br />
estimates and assumptions that affect the amounts reported in<br />
the consolidated financial statements and accompanying notes.<br />
Actual results could differ from those estimates.<br />
Nature of operations. The Company is engaged in the<br />
manufacture, distribution and sale of coatings and related<br />
products to professional, industrial, commercial and retail<br />
customers primarily in North and South America.<br />
<strong>Report</strong>able segments. See Note 17.<br />
Cash flows. The Company considers all highly liquid investments<br />
with a maturity of three months or less when purchased to be<br />
cash equivalents.<br />
Fair value of financial instruments. The following methods and<br />
assumptions were used by the Company in estimating its fair<br />
value disclosures for financial instruments:<br />
Cash and cash equivalents: The carrying amounts reported in<br />
the consolidated balance sheets for cash and cash equivalents<br />
approximate fair value.<br />
Short-term investments: The carrying amounts reported in the<br />
consolidated balance sheets for marketable debt and equity<br />
securities are based on quoted market prices and approximate<br />
fair value.<br />
Investments in securities: The Company maintains certain longterm<br />
investments, classified as available for sale securities, in<br />
a fund to provide for payment of health care benefits of certain<br />
qualified employees. The estimated fair values of these<br />
securities, included in Other assets, of $15,913, $21,093, and<br />
$25,523 at December 31, <strong>2000</strong>, 1999, and 1998, respectively,<br />
are based on quoted market prices.<br />
Long-term debt (including current portion): The fair values of<br />
the Company’s publicly traded debentures, shown below, are<br />
based on quoted market prices. The fair values of the<br />
Company’s non-traded debt, also shown below, are estimated<br />
using discounted cash flow analyses, based on the Company’s<br />
current incremental borrowing rates for similar types of<br />
borrowing arrangements.<br />
December 31,<br />
<strong>2000</strong> 1999 1998<br />
Carrying Fair Carrying Fair Carrying Fair<br />
Amount Value Amount Value Amount Value<br />
Publicly traded<br />
debt .............. $613,709 $592,113 $726,017 $698,031 $764,806 $825,989<br />
Non-traded<br />
debt .............. 29,179 26,203 20,536 18,969 83,559 80,929<br />
Interest rate swaps: The Company occasionally enters into<br />
interest rate swaps primarily to hedge against interest rate risks.<br />
These agreements generally involve the exchange of fixed and<br />
floating rate interest payment obligations without the exchange of<br />
the underlying principal amounts. Counterparties to these<br />
agreements are major financial institutions. Management believes<br />
the risk of incurring losses related to credit risk is remote. There<br />
were no interest rate swaps outstanding at December 31, <strong>2000</strong><br />
and 1999.<br />
Non-traded investments: It was not practicable to estimate the<br />
fair value of the Company’s investment in certain non-traded<br />
investments because of the lack of quoted market prices and the<br />
inability to estimate fair values without incurring excessive costs.<br />
The carrying amounts, included in Other assets, of $25,143,<br />
$15,860, and $20,034 at December 31, <strong>2000</strong>, 1999, and 1998,<br />
respectively, represent the Company’s best estimate of current<br />
economic values of these investments.<br />
Investment in life insurance. The Company invests in broad-based<br />
corporate owned life insurance. The cash surrender values of the<br />
policies, net of policy loans, are included in Other assets. The net<br />
expense associated with such investment is included in Other<br />
expense - net. Such expense is immaterial to Income before<br />
income taxes.<br />
Impairment of long-lived assets. The Company evaluates the<br />
recoverability of long-lived assets and the related estimated<br />
remaining lives at each balance sheet date. The Company records<br />
an impairment or change in useful life whenever events or<br />
changes in circumstances indicate that the carrying amount may<br />
not be recoverable or the useful life has changed in accordance<br />
with Statement of Financial Accounting Standards (SFAS) No. 121,<br />
“Accounting for the Impairment of Long-Lived Assets and for Long-<br />
Lived Assets to be Disposed of.” See Note 2.<br />
Goodwill. Goodwill represents the cost in excess of fair value of<br />
net assets acquired in business combinations accounted for by<br />
the purchase method and is amortized on a straight-line basis<br />
over the expected period of benefit ranging from 10 to 40 years.<br />
Accumulated amortization of goodwill was $84,827, $107,365 and<br />
$78,983 at December 31, <strong>2000</strong>, 1999, and 1998, respectively. See<br />
Note 2.<br />
Intangibles. Intangible assets include non-compete covenants,<br />
operating rights, patents, and trademarks. These assets are<br />
amortized on a straight-line basis over the expected period of<br />
benefit ranging from 2 to 40 years. Accumulated amortization of<br />
intangible assets was $129,320, $119,125, and $102,359 at<br />
December 31, <strong>2000</strong>, 1999, and 1998, respectively.<br />
Property, plant and equipment. Property, plant and equipment is<br />
stated on the basis of cost. Depreciation is provided principally by<br />
the straight-line method. The major classes of assets and ranges<br />
of depreciation rates are as follows:<br />
The <strong>Sherwin</strong>-<strong>Williams</strong> Company <strong>2000</strong> <strong>Annual</strong> <strong>Report</strong> | 27
Buildings ........................................... 2% - 6-2/3%<br />
Machinery and equipment................. 4% - 20%<br />
Furniture and fixtures......................... 5% - 33-1/3%<br />
Automobiles and trucks..................... 10% - 33-1/3%<br />
Letters of credit. The Company occasionally enters into standby<br />
letter of credit agreements to guarantee various operating<br />
activities. These agreements, which expire in 2001, provide credit<br />
availability to the various beneficiaries if certain contractual<br />
events occur. Amounts outstanding under these agreements<br />
totaled $12,230, $14,177, and $15,042 at December 31, <strong>2000</strong>,<br />
1999, and 1998, respectively.<br />
Foreign currency translation. All consolidated non-highly<br />
inflationary foreign operations use the local currency of the<br />
country of operation as the functional currency and translate the<br />
local currency asset and liability accounts at year-end exchange<br />
rates while income and expense accounts are translated at<br />
average exchange rates. The resulting translation adjustments are<br />
included in Cumulative other comprehensive loss, a component<br />
of Shareholders’ equity.<br />
Revenue recognition. Substantially all revenues are recognized<br />
when products are shipped and title has passed to unaffiliated<br />
customers.<br />
Technical expenditures. Total technical expenditures include<br />
research and development costs, quality control, product<br />
formulation expenditures and other similar items. Research and<br />
development costs included in technical expenditures were<br />
$33,927, $27,200, and $23,955 for <strong>2000</strong>, 1999, and 1998,<br />
respectively.<br />
Advertising expenses. The cost of advertising is expensed as<br />
incurred. The Company incurred $276,078, $265,411, and<br />
$282,817 in advertising costs during <strong>2000</strong>, 1999, and 1998,<br />
respectively.<br />
Environmental matters. Capital expenditures for ongoing<br />
environmental compliance measures are recorded in the<br />
consolidated balance sheets, and related expenses are included<br />
in the normal operating expenses of conducting business. The<br />
Company is involved with environmental compliance,<br />
investigation and remediation activities at some of its current and<br />
former sites and at a number of third-party sites. The Company<br />
accrues for certain environmental remediation-related activities<br />
for which commitments or clean-up plans have been developed<br />
and for which costs can be reasonably estimated. All accrued<br />
amounts are recorded on an undiscounted basis. Accrued<br />
environmental remediation-related expenses include direct costs<br />
of remediation and indirect costs related to the remediation<br />
effort, such as compensation and benefits for employees directly<br />
involved in the remediation activities and fees paid to outside<br />
engineering, consulting and law firms. See Notes 4 and 9.<br />
Stock-based compensation. The Company uses the intrinsic value<br />
method of accounting for stock-based compensation in<br />
accordance with Accounting Principles Board Opinion (APBO) No.<br />
25. See Note 12 for pro forma disclosure of net income and<br />
earnings per share under the fair value method of accounting for<br />
stock-based compensation as prescribed by SFAS No. 123,<br />
“Accounting for Stock-Based Compensation.”<br />
Earnings per share. Basic net income per share is computed<br />
based on the weighted-average number of shares outstanding<br />
during the year. Diluted net income per share is computed based<br />
on the weighted-average number of shares outstanding plus all<br />
dilutive securities potentially outstanding during the year. See<br />
Note 15. All references to earnings or losses per share throughout<br />
this report are stated on a diluted per share basis unless<br />
otherwise indicated.<br />
Impact of recently issued accounting standards. Financial<br />
Accounting Standards Board (FASB) SFAS No. 133, “Accounting for<br />
Derivative Instruments and Hedging Activities,” as amended, is<br />
effective for all fiscal years beginning after June 15, <strong>2000</strong>. SFAS<br />
No. 133 requires all derivative instruments to be recorded as<br />
either assets or liabilities at fair value. Gains or losses resulting<br />
from changes in the values of those derivative instruments may<br />
be recognized immediately or deferred depending on the use of<br />
the derivative or whether it qualifies as a hedge. The Company will<br />
comply with the requirements of SFAS No. 133 beginning January<br />
1, 2001, as required. The impact of complying with this statement<br />
is not expected to have a material effect on the Company’s<br />
financial condition, results of operations or cash flows.<br />
Reclassification. Certain amounts in the 1999 and 1998<br />
consolidated financial statements have been reclassified to<br />
conform with the <strong>2000</strong> presentation.<br />
NOTE 2–IMPAIRMENT OF LONG-LIVED ASSETS<br />
During the fourth quarter of <strong>2000</strong>, the Company recognized an<br />
impairment charge of $352,040 ($293,628 after tax or $1.80 per<br />
share) to reduce the carrying values of certain long-lived assets to<br />
their estimated fair values. Charges of $342,522 reduced goodwill<br />
while the remaining portion of the charge primarily reduced fixed<br />
assets. The impaired assets are part of the Consumer Segment<br />
related to the previous acquisitions of Thompson Minwax Holding<br />
Corp. and Pratt & Lambert United, Inc., and the assets of<br />
Sunshine Quality Products, Inc. and the Household and<br />
Professional Products Division of Grow Group, Inc. Current year<br />
losses, cash flow deficiencies and cash flow shortfalls from<br />
expectations indicated an impairment review was necessary.<br />
Undiscounted future cash flows estimated by management<br />
established that impairment existed at December 31, <strong>2000</strong>. The<br />
amount of impairment was estimated using a discounted cash<br />
flow valuation technique incorporating a discount rate<br />
commensurate with the risks involved for each group of assets.<br />
NOTE 3–INVENTORIES<br />
Inventories are stated at the lower of cost or market. Cost is<br />
determined principally on the last-in, first-out (LIFO) method<br />
which provides a better matching of current costs and revenues in<br />
periods of inflation. The following presents the effect on<br />
inventories, net income and net income per share had the<br />
Company used the first-in, first-out (FIFO) inventory valuation<br />
adjusted for income taxes at the statutory rate and assuming no<br />
other adjustments. This information is presented to enable the<br />
reader to make comparisons with companies using the FIFO<br />
method of inventory valuation.<br />
28| The <strong>Sherwin</strong>-<strong>Williams</strong> Company <strong>2000</strong> <strong>Annual</strong> <strong>Report</strong>
<strong>2000</strong> 1999 1998<br />
Percentage of total inventories on LIFO .. 89% 90% 91%<br />
Excess of FIFO over LIFO .......................... $ 110,124 $ 97,953 $ 96,235<br />
Increase (decrease) in net income<br />
due to LIFO .......................................... (7,916) (894) 4,685<br />
Increase (decrease) in net income<br />
per share due to LIFO .......................... (.05) (.01) .03<br />
NOTE 4 – OTHER EXPENSE - NET<br />
A summary of significant items included in Other expense - net is<br />
as follows:<br />
<strong>2000</strong> 1999 1998<br />
Dividend and royalty income ........................ $ (4,144) $ (4,692) $ (3,069)<br />
Net expense of financing and<br />
investing activities.................................... 10,926 7,084 2,542<br />
Provisions for environmental<br />
matters - net (see Note 9).......................... 15,402 695<br />
Provisions for disposition and<br />
termination of operations (see Note 5) ...... 6,968 3,830 12,290<br />
Foreign currency exchange losses ................ 2,115 3,333 11,773<br />
Other (income) expense .............................. (1,112) 4,583 1,815<br />
$ 14,753 $ 29,540 $ 26,046<br />
The net expense of financing and investing activities represents<br />
the net realized gains or losses from disposing of fixed assets, the<br />
net gain or loss associated with the investment in certain longterm<br />
asset funds, the net pre-tax expense associated with the<br />
Company’s investment in broad-based corporate owned life<br />
insurance, other related fees and, in 1998, the net gain related to<br />
the sale of the Company’s joint venture interest in American<br />
Standox, Inc.<br />
The provisions for environmental matters represent the net charge<br />
necessary to record the most current estimates of potential costs<br />
of environmental remediation at current, former and third-party<br />
sites. See Note 9. The provision for 1998 was partially offset by<br />
settlements with certain insurance carriers totaling $3,600.<br />
The provisions for disposition and termination of operations<br />
reduce property, plant and equipment at closed facilities to<br />
estimated net realizable value and adjust previous provisions to<br />
current estimates as closure or disposition occurs. See Note 5.<br />
NOTE 5–DISPOSITION AND TERMINATION<br />
OF OPERATIONS<br />
The Company is continually re-evaluating its operating facilities<br />
against its long-term strategic goals. Upon cessation of<br />
operations, a provision is made to reduce property, plant and<br />
equipment to its estimated net realizable value. The expense is<br />
included in Other expense - net. Similarly, provisions are made,<br />
and included in Cost of goods sold, to provide for all qualified exit<br />
costs such as lease cancellation penalties, post-closure rent<br />
expenses, incremental post-closure expenses and the estimated<br />
costs of employee terminations.<br />
During <strong>2000</strong>, provisions were made to reduce certain assets to<br />
their net realizable value for two research centers idled by the<br />
Automotive Finishes Segment, resulting from the consolidation of<br />
its research operations into a newly purchased facility, and for a<br />
closed distribution center. Provisions were made for qualified exit<br />
costs associated with the shut down of these facilities, primarily<br />
incremental post-closure costs. In 1999, provisions were made to<br />
reduce certain assets to their net realizable value and to accrue<br />
qualified exit costs for two idle manufacturing facilities and a<br />
leased warehouse and for four redundant manufacturing facilities<br />
in 1998. Adjustments are made to prior accruals as information<br />
becomes available upon which more accurate costs can be<br />
reasonably estimated.<br />
Approximately 45 percent of the ending accrual at December 31,<br />
<strong>2000</strong> consisted of reductions in property, plant and equipment to<br />
estimated net realizable values. Approximately one-half of the<br />
reduction to net realizable value relates to facilities closed in<br />
<strong>2000</strong> while the other half relates primarily to facilities that ceased<br />
operations prior to 1998. The remaining portion of the ending<br />
accrual at December 31, <strong>2000</strong> relates primarily to post-closure<br />
demolition expenses, continued lease payments or cancellation<br />
penalties, and ongoing contractual expenses relating to facilities<br />
whose operations ceased prior to 1998. The Company is involved<br />
in ongoing environmental-related activities at certain owned<br />
facilities that have been closed and cannot reasonably estimate<br />
when such matters will be concluded to allow for disposition. As<br />
sale of the facilities occurs, following the completion of the<br />
environmental-related activities or at time of demolition, the<br />
realized loss from carrying value to net realizable value will be<br />
charged to the accrual. Most remaining demolition expenses are<br />
expected to be incurred during 2001.<br />
A summary of the financial data related to the closing or sale of<br />
the facilities is as follows:<br />
<strong>2000</strong> 1999 1998<br />
Beginning accruals – January 1 .................... $34,883 $ 56,097 $ 47,111<br />
Provisions included in Cost of goods sold .... 1,055 3,810 11,267<br />
Provisions included in<br />
Other expense - net .................................. 6,990 278 14,094<br />
Prior accrual adjustments included<br />
in Other expense - net .............................. (22) 3,552 (1,804)<br />
Total charges included in<br />
Other expense – net ........................ 6,968 3,830 12,290<br />
Actual expenditures charged to accrual ........ (6,173) (15,529) (5,322)<br />
Realized losses charged to accrual .............. (4,459) (13,325) (9,249)<br />
Ending accruals – December 31 .................... $ 32,274 $ 34,883 $ 56,097<br />
Net after-tax charges to<br />
current operations .................................... $ 5,215 $ 4,966 $ 15,312<br />
Net after-tax charges per share .................. $ .03 $ .03 $ .09<br />
NOTE 6 – PENSION AND OTHER BENEFITS<br />
The Company provides pension benefits to substantially all<br />
employees through noncontributory defined benefit or defined<br />
contribution plans. The Company’s annual contribution for its<br />
defined contribution pension plans, which is based on a level<br />
percentage of compensation for covered employees, was $33,043,<br />
$31,512, and $27,004 in <strong>2000</strong>, 1999, and 1998, respectively.<br />
The Company provides certain health care benefits for active<br />
employees. The plans are contributory and contain cost-sharing<br />
features such as deductibles and coinsurance. There were 16,811,<br />
16,081, and 15,894, active employees entitled to receive benefits<br />
The <strong>Sherwin</strong>-<strong>Williams</strong> Company <strong>2000</strong> <strong>Annual</strong> <strong>Report</strong> | 29
under these plans as of December 31, <strong>2000</strong>, 1999, and 1998,<br />
respectively. The cost of these benefits for active employees is<br />
recognized as claims are incurred and amounted to $58,782,<br />
$52,640, and $47,563 for <strong>2000</strong>, 1999, and 1998, respectively. The<br />
Company has a fund, to which it no longer intends to contribute,<br />
that provides for payment of health care benefits of certain<br />
qualified employees. Distributions from the fund amounted to<br />
$7,410, $6,421, and $4,928 in <strong>2000</strong>, 1999, and 1998,<br />
respectively.<br />
Employees of the Company who were hired prior to January 1,<br />
1993 and who are not members of a collective bargaining unit,<br />
and certain groups of employees added through acquisitions, are<br />
eligible for certain health care and life insurance benefits upon<br />
retirement from active service, subject to the terms, conditions<br />
and limitations of the applicable plans. There were 4,855, 4,831,<br />
and 4,800 retired employees entitled to receive benefits as of<br />
December 31, <strong>2000</strong>, 1999, and 1998, respectively. The plans<br />
are unfunded.<br />
Defined Benefit Pension Plans<br />
Other Postretirement Benefits<br />
<strong>2000</strong> 1999 1998 <strong>2000</strong> 1999 1998<br />
Benefit obligation:<br />
Balance at beginning of year . . . . . . . . . . . . . . . . . . $170,632 $ 169,099 $ 175,204 $ 225,686 $ 217,627 $206,007<br />
Service cost . . . . . . . . . . . . . . . . . . . . . . . . . . . . . . . 2,990 3,237 2,564 3,821 4,215 3,877<br />
Interest cost . . . . . . . . . . . . . . . . . . . . . . . . . . . . . . . 12,504 11,516 11,942 15,649 14,467 13,909<br />
Actuarial loss (gain) . . . . . . . . . . . . . . . . . . . . . . . . . 8,957 (1,106) 1,702 15,930 966 3,184<br />
Plan amendments . . . . . . . . . . . . . . . . . . . . . . . . . . 738 2,003<br />
Plan mergers . . . . . . . . . . . . . . . . . . . . . . . . . . . . . . 9,446<br />
Other - net . . . . . . . . . . . . . . . . . . . . . . . . . . . . . . . . 208 181<br />
Benefits paid . . . . . . . . . . . . . . . . . . . . . . . . . . . . . . (10,596) (12,295) (24,316) (13,150) (11,589) (9,350)<br />
Balance at end of year . . . . . . . . . . . . . . . . . . . . . . . 194,879 170,632 169,099 247,936 225,686 217,627<br />
Plan assets:<br />
Balance at beginning of year . . . . . . . . . . . . . . . . . . 523,453 492,384 446,271<br />
Actual return on plan assets . . . . . . . . . . . . . . . . . . 25,534 44,859 71,188<br />
Plan mergers . . . . . . . . . . . . . . . . . . . . . . . . . . . . . . 17,017<br />
Other - net . . . . . . . . . . . . . . . . . . . . . . . . . . . . . . . . (954) (1,495) (759)<br />
Benefits paid . . . . . . . . . . . . . . . . . . . . . . . . . . . . . . (10,596) (12,295) (24,316)<br />
Balance at end of year . . . . . . . . . . . . . . . . . . . . . . . 554,454 523,453 492,384<br />
Excess (deficient) plan assets:<br />
Balance at end of year . . . . . . . . . . . . . . . . . . . . . . . 359,575 352,821 323,285 (247,936) (225,686) (217,627)<br />
Unrecognized net asset . . . . . . . . . . . . . . . . . . . . . . (1,279) (2,792)<br />
Unrecognized actuarial loss (gain) . . . . . . . . . . . . . . 2,080 (20,262) (20,348) 37,752 21,993 20,171<br />
Unrecognized prior service cost (credit) . . . . . . . . . 2,320 2,404 2,330 (11,689) (14,498) (17,307)<br />
Net asset (liability) recognized in the<br />
consolidated balance sheets . . . . . . . . . . . . . . . . . . $ 363,975 $ 333,684 $ 302,475 $ (221,873) $(218,191) $(214,763)<br />
Net asset (liability) recognized in the<br />
consolidated balance sheets consists of:<br />
Prepaid benefit cost . . . . . . . . . . . . . . . . . . . . . . . $ 364,351 $ 334,094 $304,006<br />
Accrued benefit liability . . . . . . . . . . . . . . . . . . . . $ (208,673) $(206,591) $(204,763)<br />
Amount included in current liabilities . . . . . . . . . (376) (410) (1,531) (13,200) (11,600) (10,000)<br />
$ 363,975 $ 333,684 $ 302,475 $ (221,873) $(218,191) $(214,763)<br />
Weighted-average assumptions as of December 31:<br />
Discount rate . . . . . . . . . . . . . . . . . . . . . . . . . . . . . . 7.00% 7.25% 6.75% 7.00% 7.25% 6.75%<br />
Expected long-term rate of return on assets . . . . . . 8.50% 8.50% 8.50%<br />
Rate of compensation increase . . . . . . . . . . . . . . . . 5.00% 5.00% 5.00%<br />
Health care cost trend rate . . . . . . . . . . . . . . . . . . . . 6.00% 6.40% 6.70%<br />
Net periodic benefit (credit) cost:<br />
Service and interest cost . . . . . . . . . . . . . . . . . . . . . $ 15,494 $ 14,753 $ 14,506 $ 19,470 $ 18,682 $ 17,786<br />
Net amortization and deferral . . . . . . . . . . . . . . . . . (490) (699) (2,524) (2,814) (2,768) (2,809)<br />
Expected return on assets . . . . . . . . . . . . . . . . . . . . (44,633) (42,137) (37,531)<br />
Settlement gain . . . . . . . . . . . . . . . . . . . . . . . . . . . . (5,302)<br />
Net periodic benefit (credit) cost . . . . . . . . . . . . . . . $ (29,629) $ (28,083) $ (30,851) $ 16,656 $ 15,914 $ 14,977<br />
30| The <strong>Sherwin</strong>-<strong>Williams</strong> Company <strong>2000</strong> <strong>Annual</strong> <strong>Report</strong>
Plan assets included 2,338,800 shares of the Company’s<br />
common stock at December 31, <strong>2000</strong> with a market value of<br />
$61,541. Dividends received during the year from Company<br />
stock was $1,155.<br />
The assumed health care cost trend rate was revised during the<br />
year ended December 31, <strong>2000</strong>, to 9.5 percent for 2001<br />
decreasing gradually to 5.5 percent for 2010 and thereafter.<br />
Assumed health care cost trend rates have a significant effect on<br />
the amounts reported for the health care plan. A one-percentagepoint<br />
change in assumed health care cost trend rates would have<br />
the following effects as of December 31, <strong>2000</strong>:<br />
One-Percentage-Point<br />
Increase (Decrease)<br />
Effect on total of service and interest<br />
cost components ...................................... $ 580 $ (565)<br />
Effect on the postretirement benefit<br />
obligation.................................................. $ 8,137 $ (7,900)<br />
NOTE 7–LONG-TERM DEBT<br />
Amount Outstanding<br />
Due Date <strong>2000</strong> 1999 1998<br />
6.85% Notes .......................... 2007 $ 199,807 $ 199,775 $ 199,742<br />
7.375% Debentures.................. 2027 149,910 149,907 149,903<br />
7.45% Debentures .................. 2097 149,408 149,402 149,396<br />
6.5% Notes ............................ 2002 99,989 99,978 99,966<br />
6.25% Notes .......................... <strong>2000</strong> 99,974<br />
9.875% Debentures ................ 2007 to 2016 11,500 15,900 15,900<br />
5% to 9% Promissory Notes .... Through 2005 8,882 5,752 10,623<br />
8% to 12% Promissory Notes<br />
partially secured by certain<br />
land and buildings .............. Through 2005 2,259 3,569 3,884<br />
4.75% Promissory Note .......... <strong>2000</strong> 800<br />
Other Obligations .................. 1,832 82 95<br />
$ 623,587 $ 624,365 $ 730,283<br />
Maturities of long-term debt are as follows for the next five years:<br />
$19,368 in 2001; $106,616 in 2002; $5,632 in 2003; $405 in<br />
2004, and $204 in 2005.<br />
Interest expense on long-term debt was $46,569, $55,415, and<br />
$59,137 for <strong>2000</strong>, 1999, and 1998, respectively.<br />
The Company has renewable 364-day and five-year amended<br />
revolving credit agreements. The current agreements with<br />
effective dates of December 29, <strong>2000</strong> and January 3, 2001 reflect<br />
the following: 1) a 364-day annually renewable agreement<br />
aggregating $129,600 expiring on December 28, 2001; and 2) a<br />
five-year rolling agreement aggregating $638,400, with $30,400,<br />
$190,400, and $417,600 expiring on January 3, 2003, 2005, and<br />
2006, respectively. There were no borrowings outstanding under<br />
any revolving credit agreement during all years presented.<br />
The Company uses the revolving credit agreements to satisfy its<br />
commercial paper program’s dollar for dollar liquidity<br />
requirement. At December 31, <strong>2000</strong>, borrowings outstanding<br />
under the commercial paper program totaled $106,854 and are<br />
included in Short-term borrowings on the balance sheet. The<br />
weighted-average interest rate related to these borrowings was<br />
6.6% at December 31, <strong>2000</strong>. There were no borrowings<br />
outstanding under this program at December 31, 1999 and 1998,<br />
respectively. Effective January 3, 2001, this program is limited to<br />
$768,000, which equals the new aggregate maximum borrowing<br />
capacity under the revolving credit agreements.<br />
On October 6, 1997, the Company issued $50,000 of debt<br />
securities remaining under a previously existing shelf registration<br />
with the Securities and Exchange Commission consisting of 5.5%<br />
notes, due October 15, 2027, with provisions that the holders,<br />
individually or in the aggregate, may exercise a put option on<br />
October 15, 1999 and annually thereafter that would require the<br />
Company to repay the securities. On October 15, <strong>2000</strong> and 1999,<br />
individual debt security holders exercised put options requiring<br />
the Company to repay $7,960 and $38,945 of these debt<br />
securities. The remaining balance of $3,095 at December 31,<br />
<strong>2000</strong> and $11,055 at December 31, 1999 of these debt securities<br />
are included in Current portion of long-term debt on the balance<br />
sheets.<br />
On December 24, 1997, the Company filed a shelf registration with<br />
the Securities and Exchange Commission covering $150,000 of<br />
unsecured debt securities with maturities greater than nine<br />
months from the date of issue. The Company may issue these<br />
securities from time to time in one or more series and will offer<br />
the securities on terms determined at the time of sale. There were<br />
no borrowings outstanding under this registration at December 31,<br />
<strong>2000</strong>, 1999, and 1998.<br />
On August 18, 1998, the Company filed a universal shelf<br />
registration statement with the Securities and Exchange<br />
Commission to issue debt securities, common stock and warrants<br />
up to $1,500,000. The registration was effective September 8,<br />
1998. There were no borrowings outstanding under this<br />
registration at December 31, <strong>2000</strong>, 1999, and 1998.<br />
NOTE 8–LEASES<br />
The Company leases certain stores, warehouses, manufacturing<br />
facilities, office space and equipment. Renewal options are<br />
available on the majority of leases and, under certain conditions,<br />
options exist to purchase certain properties. Rental expense for<br />
operating leases was $130,552, $123,084, and $117,762 for <strong>2000</strong>,<br />
1999, and 1998, respectively. Certain store leases require the<br />
payment of contingent rentals based on sales in excess of<br />
specified minimums. Contingent rentals included in rent expense<br />
were $12,423, $11,530, and $10,329 in <strong>2000</strong>, 1999, and 1998,<br />
respectively. Rental income, as lessor, from real estate leasing<br />
activities and sublease rental income for all years presented was<br />
not significant.<br />
Following is a schedule, by year and in the aggregate, of future<br />
minimum lease payments under noncancellable operating leases<br />
having initial or remaining terms in excess of one year at<br />
December 31, <strong>2000</strong>:<br />
2001 .................................................... $ 98,001<br />
2002 .................................................... 81,919<br />
2003 .................................................... 62,376<br />
2004 .................................................... 46,533<br />
2005 .................................................... 30,805<br />
Later years............................................ 81,959<br />
Total minimum lease payments ............ $ 401,593<br />
The <strong>Sherwin</strong>-<strong>Williams</strong> Company <strong>2000</strong> <strong>Annual</strong> <strong>Report</strong> | 31
NOTE 9—OTHER LONG-TERM LIABILITIES<br />
Included in Other long-term liabilities at December 31, <strong>2000</strong>,<br />
1999, and 1998 were accruals for extended environmental-related<br />
activities of $116,594, $124,096 and $127,613, respectively. The<br />
accrual for extended environmental-related activities represents<br />
the Company’s provisions for estimated costs associated with<br />
some of its current and former sites. Also, the Company, together<br />
with other parties, has been designated a potentially responsible<br />
party under federal and state environmental protection laws for<br />
the remediation of hazardous waste at a number of third-party<br />
sites, primarily Superfund sites. In general, these laws provide<br />
that potentially responsible parties may be held jointly and<br />
severally liable for investigation and remediation costs regardless<br />
of fault. The Company provides for, and includes in long-term<br />
liabilities, its estimated potential long-term liability for<br />
investigation and remediation costs with respect to such thirdparty<br />
sites.<br />
The Company initially provides for the estimated cost of<br />
environmental-related activities relating to its current, former and<br />
third-party sites when costs can be reasonably estimated. These<br />
estimates are determined based on currently available facts<br />
regarding each site. If the best estimate of costs can only be<br />
identified as a range and no specific amount within that range can<br />
be determined more likely than any other amount within the<br />
range, the minimum of the range is accrued. Actual costs incurred<br />
may vary from these estimates due to the inherent uncertainties<br />
involved. The Company believes that any additional liability in<br />
excess of amounts provided which may result from the resolution<br />
of such matters will not have a material adverse effect on the<br />
financial condition, liquidity or cash flow of the Company.<br />
Current environmental-related liabilities are included in Other<br />
accruals on the consolidated balance sheets.<br />
NOTE 10–STOCK PURCHASE PLAN<br />
As of December 31, <strong>2000</strong>, 14,611 employees participated in the<br />
Company’s Employee Stock Purchase and Savings Plan. The<br />
Company’s contribution charged to operations was $28,070,<br />
$36,535, and $32,679 for <strong>2000</strong>, 1999, and 1998, respectively.<br />
Additionally, the Company made contributions on behalf of<br />
participating employees, representing amounts authorized by<br />
employees to be withheld from their earnings, of $26,636,<br />
$22,581, and $20,250 in <strong>2000</strong>, 1999, and 1998, respectively.<br />
At December 31, <strong>2000</strong>, there were 25,345,026 shares of the<br />
Company’s stock being held by this plan, representing 15.9<br />
percent of the total number of voting shares outstanding. Shares<br />
of company stock credited to each member’s account under the<br />
plan are voted by the trustee under instructions from each<br />
individual plan member. Shares for which no instructions are<br />
received, along with any unallocated shares held in the plan, are<br />
voted by the trustee in the same proportion as those for which<br />
instructions are received.<br />
NOTE 11–CAPITAL STOCK<br />
Shares Shares<br />
in Treasury Outstanding<br />
Balance at January 1, 1998 .................................. 31,630,255 172,907,418<br />
Shares tendered as payment for<br />
options exercised ...................................... 37,663 (37,663)<br />
Shares issued for exercise of stock options .... 1,201,476<br />
Shares cancelled under previous<br />
restricted stock grants ................................ (38,000)<br />
Treasury stock purchased ................................ 3,000,000 (3,000,000)<br />
Balance at December 31, 1998 ............................ 34,667,918 171,033,231<br />
Shares tendered as payment for<br />
options exercised ...................................... 8,392 (8,392)<br />
Shares issued for exercise of stock options .... 462,598<br />
Shares tendered in connection with<br />
restricted stock grants ................................ 44,236 (44,236)<br />
Net shares issued under<br />
restricted stock grants ................................ 145,400<br />
Treasury stock purchased ................................ 5,925,000 (5,925,000)<br />
Balance at December 31, 1999 ............................ 40,645,546 165,663,601<br />
Shares tendered as payment for<br />
options exercised ...................................... 8,757 (8,757)<br />
Shares issued for exercise of<br />
stock options ............................................ 533,991<br />
Shares transferred to revocable trust.............. (165,000) 165,000<br />
Net shares issued under<br />
restricted stock grants .............................. 4,500<br />
Treasury stock purchased .............................. 6,800,000 (6,800,000)<br />
Balance at December 31, <strong>2000</strong> ............................ 47,289,303 159,558,335<br />
An aggregate of 19,184,038 shares, 19,722,529 shares, and<br />
20,389,127 shares of stock at December 31, <strong>2000</strong>, 1999 and 1998,<br />
respectively, were reserved for future grants of restricted stock<br />
and the exercise and future grants of stock options. Shares<br />
outstanding include 432,518 shares, 215,150 shares, and 159,800<br />
shares of stock held in a revocable trust at December 31, <strong>2000</strong>,<br />
1999, and 1998, respectively. At December 31, <strong>2000</strong>, there were<br />
300,000,000 shares of common stock and 30,000,000 shares of<br />
serial preferred stock authorized for issuance (3,000,000 shares<br />
of the authorized serial preferred stock have been designated as<br />
cumulative redeemable serial preferred stock which may be<br />
issued pursuant to the Company’s shareholders’ rights plan<br />
if the Company becomes the target of coercive and unfair<br />
takeover tactics).<br />
NOTE 12–STOCK PLAN<br />
The Company’s 1994 Stock Plan permits the granting of restricted<br />
stock, stock appreciation rights and stock options to eligible<br />
employees. The 1994 Stock Plan succeeded the 1984 Stock Plan<br />
which expired on February 15, 1994. Although no further grants<br />
may be made under the 1984 Stock Plan, all rights granted under<br />
such plan remain. The Company’s 1997 Stock Plan for<br />
Nonemployee Directors provides for the granting of restricted<br />
stock and stock options to members of the Board of Directors who<br />
are not employees of the Company. There were 400,000 shares<br />
authorized as available for grant under the 1997 Stock Plan.<br />
Grants made pursuant to the 1997 Stock Plan are authorized by<br />
the Board of Directors.<br />
32| The <strong>Sherwin</strong>-<strong>Williams</strong> Company <strong>2000</strong> <strong>Annual</strong> <strong>Report</strong>
Restricted stock grants, which generally require four years of<br />
continuous employment from the date of grant before vesting and<br />
receiving the shares without restriction, have been awarded to<br />
certain officers and key employees under the 1994 Stock Plan. The<br />
number of shares to be received without restriction is based on<br />
the Company’s performance relative to a peer group of<br />
companies. Shares of restricted stock that vested and were<br />
delivered to officers and employees amounted to 120,400 during<br />
1999. No shares of restricted stock vested during <strong>2000</strong> or 1998. At<br />
December 31, <strong>2000</strong>, there were 352,500 shares of restricted stock<br />
outstanding. Unamortized deferred compensation expense with<br />
respect to the restricted stock grants amounted to $3,036,<br />
$4,249, and $2,781 at December 31, <strong>2000</strong>, 1999, and 1998,<br />
respectively, and is being amortized over the four-year vesting<br />
period. Deferred compensation expense aggregated $3,180, $77,<br />
and $2,090 in <strong>2000</strong>, 1999, and 1998, respectively. No stock<br />
appreciation rights have been granted.<br />
A summary of restricted stock granted during <strong>2000</strong>, 1999, and<br />
1998 is as follows:<br />
<strong>2000</strong> 1999 1998<br />
Shares granted ................................................ 4,500 204,000 4,000<br />
Weighted-average fair value of<br />
restricted shares granted during year .......... $ 19.63 $ 23.77 $ 33.06<br />
Non-qualified and incentive stock options have been granted to<br />
certain officers and key employees under the plans at prices not<br />
less than fair market value of the shares, as defined by the plans,<br />
at the date of grant. The options generally become exercisable to<br />
the extent of one-third of the optioned shares for each full year<br />
following the date of grant and generally expire ten years after the<br />
date of grant. The number of options and any period of service<br />
required before the options may be exercised is determined by<br />
the Board of Directors at the time of grant. No options may be<br />
exercised more than ten years from the date of the grant.<br />
The Company has elected to follow APBO No. 25, “Accounting for<br />
Stock Issued to Employees,” and related interpretations, in<br />
accounting for its employee stock options because, as discussed<br />
below, the alternative fair value accounting provided for under<br />
SFAS No. 123, “Accounting for Stock-Based Compensation,”<br />
requires use of highly subjective assumptions in option valuation<br />
models. Under APBO No. 25, because the exercise price of the<br />
Company’s employee stock options is not less than fair market<br />
price of the shares at the date of grant, no compensation expense<br />
is recognized in the financial statements. Pro forma information<br />
regarding net income and earnings per share, determined as if the<br />
Company had accounted for its employee stock options under the<br />
fair value method of SFAS No. 123, is required by that statement.<br />
The fair value for these options was estimated at the date of grant<br />
using a Black-Scholes option pricing model with the following<br />
weighted-average assumptions for all options granted:<br />
<strong>2000</strong> 1999 1998<br />
Risk-free interest rate ...................................... 6.29% 5.34% 5.14%<br />
Expected life of option ...................................... 3 years 3 years 3 years<br />
Expected dividend yield of stock ...................... 2.00% 2.00% 2.00%<br />
Expected volatility of stock .............................. 0.305 0.265 0.194<br />
The Black-Scholes option pricing model was developed for use in<br />
estimating the fair value of traded options which have no vesting<br />
restrictions and are fully transferable. Because the Company’s<br />
employee stock options have characteristics significantly different<br />
from those of traded options, and because changes in the<br />
subjective input assumptions can materially affect the fair value<br />
estimate, it is management’s opinion that the existing models do<br />
not necessarily provide a reliable single measure of the fair value<br />
of its employee stock options.<br />
The amounts below represent the pro forma information<br />
calculated through use of the Black-Scholes model. For purposes<br />
of pro forma disclosures, the estimated fair value of the options is<br />
amortized to expense over the options’ vesting period.<br />
<strong>2000</strong> 1999 1998<br />
Pro forma net income...................... $ 9,617 $ 297,107 $ 269,838<br />
Pro forma net income per share:<br />
Basic ........................................ $ .06 $ 1.77 $ 1.57<br />
Diluted ...................................... $ .06 $ 1.76 $ 1.56<br />
A summary of the Company’s stock option activity and related information for the years ended December 31, <strong>2000</strong>, 1999 and 1998 is<br />
shown in the following table:<br />
<strong>2000</strong> 1999 1998<br />
Weighted- Weighted- Weighted-<br />
Average Average Average<br />
Optioned Exercise Optioned Exercise Optioned Exercise<br />
Shares Price Shares Price Shares Price<br />
Outstanding beginning of year ................................................................ 10,724,653 $ 22.78 6,259,702 $ 22.89 5,810,471 $ 18.47<br />
Granted .................................................................................................... 2,820,900 19.75 5,292,350 22.33 1,867,500 29.10<br />
Exercised.................................................................................................. (533,991) 12.02 (462,598) 15.36 (1,201,476) 14.00<br />
Canceled .................................................................................................. (423,252) 24.62 (364,801) 27.69 (216,793) 26.68<br />
Outstanding end of year .......................................................................... 12,588,310 $ 22.47 10,724,653 $ 22.78 6,259,702 $ 22.89<br />
Exercisable at end of year ........................................................................ 5,923,537 $ 23.31 3,971,139 $ 21.09 3,019,873 $ 17.77<br />
Weighted-average fair value of options granted during year .................... $ 4.72 $ 4.67 $ 5.12<br />
Reserved for future grants........................................................................ 6,595,728 8,997,876 14,129,425<br />
The <strong>Sherwin</strong>-<strong>Williams</strong> Company <strong>2000</strong> <strong>Annual</strong> <strong>Report</strong> | 33
Exercise prices for optioned shares outstanding as of December 31, <strong>2000</strong> ranged from $9.56 to $35.34. A summary of these options by<br />
range of exercise prices is as follows:<br />
Outstanding<br />
Exercisable<br />
Weighted-<br />
Weighted- Average Weighted-<br />
Average Remaining Average<br />
Range of Optioned Exercise Contractual Optioned Exercise<br />
Exercise Prices Shares Price Life (years) Shares Price<br />
< $16.00 390,829 $ 12.86 1.80 390,829 $ 12.86<br />
$16.00 - $19.99 3,241,788 19.03 9.38 557,988 16.51<br />
$20.00 - $26.00 6,128,196 22.00 8.01 2,701,625 21.74<br />
> $26.00 2,827,497 28.77 6.96 2,273,095 28.65<br />
12,588,310 $ 22.47 7.67 5,923,537 $ 23.31<br />
NOTE 13–INCOME TAXES<br />
Deferred income taxes reflect the net tax effects of temporary<br />
differences between the carrying amounts of assets and liabilities<br />
for financial reporting purposes and the amounts used for income<br />
tax purposes using the enacted tax rates and laws that are<br />
currently in effect. Significant components of the Company’s<br />
deferred tax assets and liabilities as of December 31, <strong>2000</strong>, 1999<br />
and 1998 are as follows:<br />
<strong>2000</strong> 1999 1998<br />
Deferred tax assets:<br />
Dispositions, environmental and<br />
other similar items .......................... $ 55,220 $ 56,123 $ 61,857<br />
Other items (each less than 5% of<br />
total assets) .................................... 98,107 94,196 88,432<br />
Total deferred tax assets ............ $ 153,327 $ 150,319 $ 150,289<br />
Deferred tax liabilities:<br />
Depreciation and amortization ............ $ 35,691 $ 66,374 $ 51,997<br />
Deferred employee benefit items.......... 50,333 42,785 35,163<br />
Total deferred tax liabilities ............ $ 86,024 $109,159 $ 87,160<br />
Significant components of the provisions for income taxes are as<br />
follows:<br />
<strong>2000</strong> 1999 1998<br />
Current:<br />
Federal ................................................ $125,393 $128,185 $ 106,538<br />
Foreign ................................................ 6,211 11,787 6,982<br />
State and Local .................................... 22,662 25,116 23,162<br />
Total Current.................................... 154,266 165,088 136,682<br />
Deferred:<br />
Federal ................................................ (27,386) 14,388 20,946<br />
Foreign ................................................ 6,213 3,851 5,587<br />
State and Local .................................... (5,713) 2,931 4,024<br />
Total Deferred.................................. (26,886) 21,170 30,557<br />
Total income tax expense .......................... $ 127,380 $186,258 $ 167,239<br />
Significant components of income before income taxes as used<br />
for income tax purposes, are as follows:<br />
<strong>2000</strong> 1999 1998<br />
Domestic .................................................. $ 90,412 $411,626 $382,469<br />
Foreign...................................................... 52,994 78,492 57,634<br />
$143,406 $490,118 $ 440,103<br />
A reconciliation of the statutory federal income tax rate and the<br />
effective tax rate follows:<br />
<strong>2000</strong> 1999 1998<br />
Statutory tax rate ...................................... 35.0% 35.0% 35.0%<br />
Effect of:<br />
State and local taxes............................ 7.7 3.7 4.0<br />
Investment vehicles ............................ (7.3) (1.5) (2.7)<br />
Impairment of long-lived assets .......... 51.0<br />
Other - net .......................................... 2.5 0.8 1.7<br />
Effective tax rate ...................................... 88.9% 38.0% 38.0%<br />
A portion of the impairment of long-lived assets charge in <strong>2000</strong><br />
related to goodwill was not deductible for tax purposes. The effect<br />
on the statutory federal income tax rate is shown separately in the<br />
previous table. The state and local tax effect is not shown<br />
separately. The remaining portion of the impairment charge<br />
created federal, state and local deferred tax benefits due to the<br />
significant temporary differences between the reduced financial<br />
carrying amounts and amounts used for tax purposes.<br />
The provisions for income taxes includes estimated taxes payable<br />
on that portion of retained earnings of foreign subsidiaries<br />
expected to be received by the Company. A provision was not<br />
made with respect to $5,647 of retained earnings at December 31,<br />
<strong>2000</strong> that have been invested by foreign subsidiaries. It is not<br />
practicable to estimate the amount of unrecognized deferred tax<br />
liability for undistributed foreign earnings.<br />
Netted against the Company’s other deferred tax assets are<br />
valuation reserves of $9,082, $16,211 and $16,703 at December<br />
31, <strong>2000</strong>, 1999, and 1998, respectively, resulting from the<br />
uncertainty as to the realization of the tax benefits from certain<br />
foreign net operating losses and certain other foreign assets.<br />
NOTE 14–SUMMARY OF QUARTERLY RESULTS<br />
OF OPERATIONS (Unaudited)<br />
<strong>2000</strong><br />
Net Income Net Income<br />
Net Income (Loss) per (Loss) per<br />
Quarter Net Sales Gross Profit (Loss) Share – Basic Share - Diluted<br />
1st $ 1,221,916 $ 516,244 $ 40,923 $ .25 $ .25<br />
2nd 1,429,267 641,474 115,843 .71 .71<br />
3rd 1,411,903 626,095 106,719 .66 .66<br />
4th 1,148,538 523,798 (247,459) (1.55) (1.55)<br />
The fourth quarter net loss resulted from an after-tax charge for<br />
the impairment of long-lived assets of $293,628 or $1.84 per<br />
share ($1.80 per share for the year due to the effect of dilution<br />
and higher average shares outstanding). Net income in the fourth<br />
quarter of $46,169, excluding the impairment charge, was<br />
decreased by $484, no per share impact, due to certain year-end<br />
adjustments. Gross profit increased by $8,666 ($5,633 after-tax,<br />
$.04 per share) primarily as a result of physical inventory<br />
adjustments of $9,889 ($6,428 after-tax, $.04 per share) partially<br />
offset by fourth quarter provisions for closing costs associated<br />
with certain operations of $1,055 ($686 after-tax, no per share<br />
34| The <strong>Sherwin</strong>-<strong>Williams</strong> Company <strong>2000</strong> <strong>Annual</strong> <strong>Report</strong>
impact). Administrative expenses increased $1,288 ($838 aftertax,<br />
$.01 per share) due to other year-end adjustments. Other<br />
expense-net increased $8,122 ($5,279 after-tax, $.03 per share)<br />
due primarily to fourth quarter provisions for the reduction to net<br />
realizable value of certain fixed assets related to site closings of<br />
$6,968 ($4,529 after-tax, $.03 per share).<br />
1999<br />
Net Income Net Income<br />
per<br />
per<br />
Quarter Net Sales Gross Profit Net Income Share – Basic Share - Diluted<br />
1st $ 1,127,867 $ 477,086 $ 28,797 $ .17 $ .17<br />
2nd 1,384,070 610,390 107,594 .64 .63<br />
3rd 1,345,483 609,834 111,482 .67 .66<br />
4th 1,146,416 551,204 55,987 .34 .34<br />
Net income during the fourth quarter decreased by $1,751 ($.01<br />
per share) due to certain year-end adjustments. Gross profit<br />
increased by $23,006 ($14,953 after-tax, $.09 per share) as a<br />
result of physical inventory adjustments of $32,659 ($21,228<br />
after-tax, $.12 per share). These adjustments were partially offset<br />
by other year-end adjustments of $5,843 ($3,798 after-tax, $.02<br />
per share) and by provisions for the closing costs associated with<br />
certain operations of $3,810 ($2,477 after-tax, $.01 per share).<br />
Administrative expenses decreased $703 ($457 after-tax, no per<br />
share effect) due to other year-end adjustments. Other expense -<br />
net increased $26,403 ($17,162 after-tax, $.10 per share) due to<br />
the net provisions for environmental-related matters at current,<br />
former and third-party sites of $16,860 ($10,959 after-tax, $.07<br />
per share), the provision of $3,830 ($2,490 after-tax, $.01 per<br />
share) for the adjustment to net realizable value of certain net<br />
fixed assets related to site closings, and due to other year-end<br />
adjustments of $5,713 ($3,713 after-tax, $.02 per share).<br />
NOTE 15–NET INCOME PER SHARE<br />
<strong>2000</strong> 1999 1998<br />
Basic<br />
Average shares outstanding ............ 161,911,789 167,924,660 172,162,472<br />
Net income ...................................... $ 16,026 $ 303,860 $ 272,864<br />
Net income per share ...................... $ .10 $ 1.81 $ 1.58<br />
Diluted<br />
Average shares outstanding ............ 161,911,789 167,924,660 172,162,472<br />
Non-vested restricted stock grants .. 279,300 263,567 235,317<br />
Stock options –<br />
treasury stock method ................ 503,982 838,069 1,137,890<br />
Average shares assuming dilution .. 162,695,071 169,026,296 173,535,679<br />
Net income ...................................... $ 16,026 $ 303,860 $ 272,864<br />
Net income per share ...................... $ .10 $ 1.80 $ 1.57<br />
NOTE 16–COMPREHENSIVE INCOME<br />
Cumulative other comprehensive loss consists of the following<br />
components:<br />
Foreign Minimum Cumulative<br />
Currency Pension Other<br />
Translation Liability Comprehensive<br />
Adjustments Adjustments Loss<br />
Balance at January 1, 1998 ............ $ (33,089) $ (428) $ (33,517)<br />
Other comprehensive loss.............. (11,838) 428 (11,410)<br />
Balance at December 31, 1998 ...... (44,927) $ 0 (44,927)<br />
Other comprehensive loss.............. (100,697) (100,697)<br />
Balance at December 31, 1999 ...... (145,624) (145,624)<br />
Other comprehensive loss ............ (17,985) (17,985)<br />
Balance at December 31, <strong>2000</strong> ...... $ (163,609) $ (163,609)<br />
NOTE 17 – REPORTABLE SEGMENT INFORMATION<br />
The Company reports its segment information in five reportable<br />
segments – the Paint Stores, Consumer, Automotive Finishes,<br />
International Coatings (collectively, the “Operating Segments”)<br />
and Administrative Segments – in accordance with SFAS No. 131,<br />
“Disclosures about Segments of an Enterprise and Related<br />
Information.” SFAS No. 131 requires an enterprise to report<br />
segment information in the same way that management internally<br />
organizes its business for assessing performance and making<br />
decisions regarding allocation of resources. See the inside front<br />
cover and page 1 of this report for more information about<br />
reportable segments.<br />
The Company’s chief operating decision maker has been<br />
identified as the Chief Executive Officer because he has final<br />
authority over performance assessment and resource allocation<br />
decisions. Because of the global, diverse operations of the<br />
Company, the chief operating decision maker regularly receives<br />
discrete financial information about each reportable segment as<br />
well as a significant amount of additional financial information<br />
about certain aggregated divisions, operating units and<br />
subsidiaries of the Company. The chief operating decision maker<br />
uses all such financial information for performance assessment<br />
and resource allocation decisions. Factors considered in<br />
determining the five reportable segments of the Company include<br />
the nature of the business activities, existence of managers<br />
responsible for the operating and administrative activities and<br />
information presented to the Board of Directors. The Company<br />
evaluates the performance of operating segments and allocates<br />
resources based on profit or loss and cash generated from<br />
operations before income taxes, excluding corporate expenses<br />
and financing gains and losses. The accounting policies of the<br />
reportable segments are the same as those described in Note 1.<br />
The Paint Stores Segment consists of 2,488 company-operated<br />
specialty paint stores in the United States, Canada, Virgin Islands,<br />
Puerto Rico and Mexico. Each of the stores has the same business<br />
activity of selling identical national and similar regional products<br />
to similar types of customers. During <strong>2000</strong>, this Segment opened<br />
or acquired 92 net new stores, remodeled 52 and relocated 36.<br />
The net new stores consisted of 79 stores in the United States, 3<br />
in Canada, 1 in the Virgin Islands, 4 in Puerto Rico and 5 in<br />
Mexico. In 1999, there were 73 net new stores opened (66 in the<br />
The <strong>Sherwin</strong>-<strong>Williams</strong> Company <strong>2000</strong> <strong>Annual</strong> <strong>Report</strong> | 35
United States). In 1998, 64 net new stores were opened (55 in the<br />
United States). This Segment also manufactures original<br />
equipment manufacturer (OEM) product finishes sold through the<br />
paint stores and by direct outside sales representatives. In<br />
addition to stores, operations in Mexico include a manufacturing<br />
facility, distribution activities and outside selling functions to<br />
dealers and other distributors.<br />
The Paint Stores Segment is the exclusive North American<br />
marketer and seller of <strong>Sherwin</strong>-<strong>Williams</strong> ® branded architectural<br />
coatings, industrial and marine products, OEM product finishes<br />
and related items produced by its Mexican operations, its product<br />
finishes manufacturing and by the Consumer Segment. The loss of<br />
any single customer would not have a material adverse effect on<br />
the business of this Segment. A map on the inside back cover of<br />
this report shows the number of paint stores and their<br />
geographical locations.<br />
The Consumer Segment develops, manufactures and distributes a<br />
variety of paint, coatings and related products to third party<br />
customers and the Paint Stores Segment. Approximately 41<br />
percent of the total sales of the Consumer Segment in <strong>2000</strong>,<br />
including inter-segment transfers, represented products sold<br />
through the Paint Stores Segment. Sales and marketing of certain<br />
control-branded and private labeled products is performed by a<br />
direct sales staff. The products distributed through third party<br />
customers are intended for resale to the ultimate end-user of the<br />
product. The Consumer Segment has sales to certain customers<br />
that, individually, may be a significant portion of the sales of the<br />
Segment. However, the loss of any single customer would not<br />
have a material adverse effect on the overall profitability of the<br />
Segment. This Segment incurs most of the Company’s capital<br />
expenditures related to ongoing environmental compliance<br />
measures.<br />
The Automotive Finishes Segment develops, manufactures and<br />
distributes a variety of motor vehicle finish, refinish and touch-up<br />
products primarily throughout North and South America, the<br />
Caribbean Islands, and Italy. This Segment also licenses certain<br />
technology and trade names worldwide. <strong>Sherwin</strong>-<strong>Williams</strong> ®<br />
branded automotive finish and refinish products are distributed<br />
throughout North America solely through this Segment’s network<br />
of 127 company-operated automotive branches in the United<br />
States and 17 in Canada. Additional automotive branches in<br />
Jamaica (14) and Chile (17) complete this Segment’s worldwide<br />
network. At December 31, <strong>2000</strong>, this Segment included 11 foreign<br />
wholly-owned subsidiaries in 8 foreign countries and 11 licensing<br />
agreements in 15 foreign countries. During <strong>2000</strong>, the Automotive<br />
Finishes Segment opened or acquired three net new branches<br />
worldwide. A map on the inside back cover of this report shows<br />
the number of branches and their geographical locations.<br />
The International Coatings Segment develops, licenses,<br />
manufactures and distributes a variety of paint, coatings and<br />
related products worldwide. The majority of the sales from<br />
licensees and subsidiaries occur in South America, the Segment’s<br />
most important international market. This Segment sells its<br />
products through 29 company-operated specialty paint stores in<br />
Chile and 16 in Brazil and by outside selling functions to dealers<br />
and other distributors. At December 31, <strong>2000</strong>, this Segment<br />
included 12 foreign wholly-owned subsidiaries in 8 foreign<br />
countries, 4 foreign joint ventures and 29 licensing agreements in<br />
20 foreign countries.<br />
The Administrative Segment includes the administrative expenses<br />
of the Company’s and certain consolidated subsidiaries’<br />
headquarters sites. This Segment includes interest expense which<br />
is unrelated to retail real estate leasing activities, investment<br />
income, certain foreign currency transaction losses related to<br />
dollar-denominated debt, certain provisions for disposition and<br />
environmental-related matters, and other expenses which are not<br />
directly associated with any Operating Segment. Administrative<br />
expenses do not include any significant foreign operations. Also<br />
included in the Administrative Segment is a real estate<br />
management unit that is responsible for the ownership,<br />
management, leasing of non-retail properties held primarily for<br />
use by the Company, including the Company’s headquarters site,<br />
and disposal of idle facilities. Sales of the Administrative<br />
Segment represent external leasing revenue of excess<br />
headquarters space or leasing of facilities no longer used by the<br />
Company in its operations. Gains and losses from the sale of<br />
property are not a significant operating factor in determining the<br />
performance of this Segment.<br />
Net external sales of all consolidated foreign subsidiaries were<br />
$540 million, $497 million, and $521 million for <strong>2000</strong>, 1999, and<br />
1998, respectively. Operating profits of all consolidated foreign<br />
subsidiaries were $32 million, $70 million, and $47 million for<br />
<strong>2000</strong>, 1999, and 1998, respectively. Domestic operations account<br />
for the remaining net sales and operating profits. Long-lived<br />
assets consist of net property, plant and equipment, goodwill,<br />
and intangibles. Long-lived assets of consolidated foreign<br />
subsidiaries totaled $245 million, $242 million, and $312 million<br />
at December 31, <strong>2000</strong>, 1999, and 1998, respectively. The<br />
consolidated total of long-lived assets for the Company was<br />
$1,687 million, $2,026 million, and $2,134 million at December<br />
31, <strong>2000</strong>, 1999, and 1998, respectively. No single geographic area<br />
outside the United States was significant relative to consolidated<br />
net external sales or operating profits. Export sales and sales to<br />
any individual customer were each less than 10 percent of<br />
consolidated sales to unaffiliated customers during all years<br />
presented.<br />
In the reportable segment financial information that follows,<br />
operating profit is total revenue, including inter-segment<br />
transfers, less operating costs and expenses. Identifiable assets<br />
are those directly identified with each reportable segment.<br />
Administrative Segment assets consist primarily of cash,<br />
investments, deferred pension assets, headquarters property,<br />
plant and equipment, and other real estate. The operating margin<br />
for each Operating Segment is based upon total external sales<br />
and inter-segment transfers. Domestic inter-segment transfers are<br />
accounted for at the approximate fully absorbed manufactured<br />
cost plus distribution costs. International inter-segment transfers<br />
are accounted for at values comparable to normal unaffiliated<br />
customer sales.<br />
36| The <strong>Sherwin</strong>-<strong>Williams</strong> Company <strong>2000</strong> <strong>Annual</strong> <strong>Report</strong>
<strong>Report</strong>able Segment Financial Information<br />
(Millions of Dollars)<br />
<strong>2000</strong> 1999 1998 1997 1996<br />
Net External Sales<br />
Paint Stores . . . . . . . . . . . . . . . . . . . . . . . . . . . . . . . $ 3,185 $ 3,002 $ 2,822 $ 2,639 $ 2,414<br />
Consumer . . . . . . . . . . . . . . . . . . . . . . . . . . . . . . . . . 1,219 1,224 1,282 1,409 1,162<br />
Automotive Finishes . . . . . . . . . . . . . . . . . . . . . . . . . 493 471 474 476 434<br />
International Coatings . . . . . . . . . . . . . . . . . . . . . . . 307 299 348 350 114<br />
Administrative . . . . . . . . . . . . . . . . . . . . . . . . . . . . . 8 8 8 7 9<br />
Consolidated totals . . . . . . . . . . . . . . . . . . . . . . . . . $ 5,212 $ 5,004 $ 4,934 $ 4,881 $ 4,133<br />
Operating Profits<br />
Paint Stores . . . . . . . . . . . . . . . . . . . . . . . . . . . . . . . $ 411 $ 377 $ 347 $ 315 $ 277<br />
Consumer . . . . . . . . . . . . . . . . . . . . . . . . . . . . . . . . . (210)* 155 125 167 126<br />
Automotive Finishes . . . . . . . . . . . . . . . . . . . . . . . . . 61 67 65 64 52<br />
International Coatings . . . . . . . . . . . . . . . . . . . . . . . 18 34 24 36 20<br />
Administrative:<br />
Interest expense . . . . . . . . . . . . . . . . . . . . . . . . . . (60) (59) (70) (79) (22)<br />
Corporate expenses and other . . . . . . . . . . . . . . . (77) (84) (51) (76) (78)<br />
Income before income taxes . . . . . . . . . . . . . . . . . . $ 143 * $ 490 $ 440 $ 427 $ 375<br />
Identifiable Assets<br />
Paint Stores . . . . . . . . . . . . . . . . . . . . . . . . . . . . . . . $ 1,018 $ 930 $ 881 $ 832 $ 757<br />
Consumer . . . . . . . . . . . . . . . . . . . . . . . . . . . . . . . . . 1,360 * 1,804 1,850 1,938 1,122<br />
Automotive Finishes . . . . . . . . . . . . . . . . . . . . . . . . . 349 279 275 274 274<br />
International Coatings . . . . . . . . . . . . . . . . . . . . . . . 298 294 356 312 194<br />
Administrative . . . . . . . . . . . . . . . . . . . . . . . . . . . . . 726 726 689 680 648<br />
Consolidated totals . . . . . . . . . . . . . . . . . . . . . . . . . $ 3,751 * $ 4,033 $ 4,051 $ 4,036 $ 2,995<br />
Capital Expenditures<br />
Paint Stores . . . . . . . . . . . . . . . . . . . . . . . . . . . . . . . $ 48 $ 49 $ 57 $ 56 $ 49<br />
Consumer . . . . . . . . . . . . . . . . . . . . . . . . . . . . . . . . . 40 40 37 57 44<br />
Automotive Finishes . . . . . . . . . . . . . . . . . . . . . . . . . 29 10 8 14 10<br />
International Coatings . . . . . . . . . . . . . . . . . . . . . . . 6 11 15 13 12<br />
Administrative . . . . . . . . . . . . . . . . . . . . . . . . . . . . . 10 24 29 24 8<br />
Consolidated totals . . . . . . . . . . . . . . . . . . . . . . . . . $ 133 $ 134 $ 146 $ 164 $ 123<br />
Depreciation<br />
Paint Stores . . . . . . . . . . . . . . . . . . . . . . . . . . . . . . . $ 45 $ 42 $ 38 $ 40 $ 35<br />
Consumer . . . . . . . . . . . . . . . . . . . . . . . . . . . . . . . . . 28 29 30 24 21<br />
Automotive Finishes . . . . . . . . . . . . . . . . . . . . . . . . . 9 8 8 7 7<br />
International Coatings . . . . . . . . . . . . . . . . . . . . . . . 6 6 6 6 1<br />
Administrative . . . . . . . . . . . . . . . . . . . . . . . . . . . . . 21 20 16 13 12<br />
Consolidated totals . . . . . . . . . . . . . . . . . . . . . . . . . $ 109 $ 105 $ 98 $ 90 $ 76<br />
Operating Segment Margins<br />
Paint Stores . . . . . . . . . . . . . . . . . . . . . . . . . . . . . . . 12.9% 12.5% 12.3% 11.9% 11.5%<br />
Consumer . . . . . . . . . . . . . . . . . . . . . . . . . . . . . . . . . (10.1%) 7.6% 6.1% 8.0% 7.0%<br />
Automotive Finishes . . . . . . . . . . . . . . . . . . . . . . . . . 11.5% 13.3% 12.8% 12.5% 11.1%<br />
International Coatings . . . . . . . . . . . . . . . . . . . . . . . 5.9% 11.4% 6.9% 10.2% 17.5%<br />
Operating segment totals . . . . . . . . . . . . . . . . . . . . 4.6% * 10.8% 9.8% 10.4% 9.9%<br />
Intersegment Transfers<br />
Paint Stores . . . . . . . . . . . . . . . . . . . . . . . . . . . . . . . $ 10 $ 8 $ 5<br />
Consumer . . . . . . . . . . . . . . . . . . . . . . . . . . . . . . . . . 860 817 771 $ 666 $ 645<br />
Automotive Finishes . . . . . . . . . . . . . . . . . . . . . . . . . 36 31 34 37 33<br />
International Coatings . . . . . . . . . . . . . . . . . . . . . . . 2<br />
Administrative . . . . . . . . . . . . . . . . . . . . . . . . . . . . . 11 12 11 9 9<br />
Segment totals . . . . . . . . . . . . . . . . . . . . . . . . . . . . . $ 917 $ 868 $ 821 $ 714 $ 687<br />
* Includes charge and reduction in asset value of $352 in <strong>2000</strong> for impairment of long-lived assets. See note 2.<br />
The <strong>Sherwin</strong>-<strong>Williams</strong> Company <strong>2000</strong> <strong>Annual</strong> <strong>Report</strong> | 37
DIRECTORS, OFFICERS, MANAGERS<br />
BOARD OF DIRECTORS<br />
James C. Boland, 61*<br />
President and Chief Executive Officer<br />
CAVS/Gund Arena Company<br />
John G. Breen, 66<br />
Retired, former Chairman, Chief Executive<br />
Officer and President<br />
The <strong>Sherwin</strong>-<strong>Williams</strong> Company<br />
Duane E. Collins, 64<br />
Chairman and Chief Executive Officer<br />
Parker-Hannifin Corporation<br />
Christopher M. Connor, 44<br />
Chairman and Chief Executive Officer<br />
The <strong>Sherwin</strong>-<strong>Williams</strong> Company<br />
Daniel E. Evans, 64<br />
Chairman<br />
Bob Evans Farms, Inc.<br />
Robert W. Mahoney, 64<br />
Retired, former Chairman, Chief Executive<br />
Officer and President<br />
Diebold, Incorporated<br />
William G. Mitchell, 70*<br />
Retired, former Vice Chairman<br />
Centel Corporation<br />
A. Malachi Mixon, III, 60<br />
Chairman and Chief Executive Officer<br />
Invacare Corporation<br />
Curtis E. Moll, 61*<br />
Chairman and Chief Executive Officer<br />
MTD Products, Inc.<br />
Helen O. Petrauskas, 56*<br />
Vice President-Environmental and<br />
Safety Engineering<br />
Ford Motor Company<br />
Joseph M. Scaminace, 47<br />
President and Chief Operating Officer<br />
The <strong>Sherwin</strong>-<strong>Williams</strong> Company<br />
Richard K. Smucker, 52*<br />
President<br />
The J. M. Smucker Company<br />
CORPORATE OFFICERS<br />
Christopher M. Connor, 44**<br />
Chairman and Chief Executive Officer<br />
Joseph M. Scaminace, 47**<br />
President and Chief Operating Officer<br />
Larry J. Pitorak, 54**<br />
Senior Vice President - Finance,<br />
Treasurer and Chief Financial Officer<br />
John L. Ault, 55**<br />
Vice President - Corporate Controller<br />
Cynthia D. Brogan, 49<br />
Vice President and<br />
Assistant Treasurer<br />
Mark J. Dvoroznak, 42<br />
Vice President -<br />
Corporate Audit and Loss Prevention<br />
Thomas E. Hopkins, 43**<br />
Vice President -<br />
Human Resources<br />
Conway G. Ivy, 59**<br />
Vice President -<br />
Corporate Planning and Development<br />
James J. Sgambellone, 43<br />
Vice President -<br />
Taxes and Assistant Secretary<br />
Louis E. Stellato, 50**<br />
Vice President, General<br />
Counsel and Secretary<br />
Richard M. Weaver, 46<br />
Vice President - Administration<br />
OPERATING MANAGERS<br />
Thomas S. Brummett, 55<br />
President & General Manager<br />
Eastern Division<br />
Paint Stores Group<br />
Robert J. Davisson, 40<br />
President & General Manager<br />
Southeastern Division<br />
Paint Stores Group<br />
Michael A. Galasso, 53**<br />
President & General Manager<br />
International Division<br />
Blair P. LaCour, 54<br />
President & General Manager<br />
Mid Western Division<br />
Paint Stores Group<br />
John G. Morikis, 37**<br />
President<br />
Paint Stores Group<br />
Ronald P. Nandor, 41**<br />
President & General Manager<br />
Automotive Division<br />
Steven J. Oberfeld, 48<br />
President & General Manager<br />
South Western Division<br />
Paint Stores Group<br />
Thomas W. Seitz, 52**<br />
President & General Manager<br />
Consumer Division<br />
Robert A. Taylor, 47<br />
President & General Manager<br />
Chemical Coatings Business Unit<br />
Paint Stores Group<br />
*Audit Committee Member<br />
**Executive Officer as defined by the Securities Exchange Act of 1934<br />
38| The <strong>Sherwin</strong>-<strong>Williams</strong> Company <strong>2000</strong> <strong>Annual</strong> <strong>Report</strong>
SHAREHOLDER INFORMATION<br />
<strong>Annual</strong> Meeting<br />
The annual meeting of shareholders will<br />
be held at 10:00 A.M., April 25, 2001 in<br />
the Landmark Conference Center, Room<br />
927, Midland Building, 101 Prospect<br />
Avenue, N.W., Cleveland, Ohio.<br />
<strong>Investor</strong> <strong>Relations</strong><br />
Conway G. Ivy<br />
The <strong>Sherwin</strong>-<strong>Williams</strong> Company<br />
101 Prospect Avenue, N.W.<br />
Cleveland, Ohio 44115-1075<br />
Internet: www.sherwin.com<br />
Form 10-K<br />
The Company’s <strong>Annual</strong> <strong>Report</strong> on Form<br />
10-K, filed with the Securities and<br />
Exchange Commission, is available<br />
without charge. To obtain a copy, contact<br />
the <strong>Investor</strong> <strong>Relations</strong> Office.<br />
Dividend Reinvestment Program<br />
A dividend reinvestment program is<br />
available to shareholders of common<br />
stock. For information, contact our<br />
transfer agent, The Bank of New York.<br />
Headquarters<br />
The <strong>Sherwin</strong>-<strong>Williams</strong> Company<br />
101 Prospect Avenue, N.W.<br />
Cleveland, Ohio 44115-1075<br />
(216) 566-<strong>2000</strong><br />
Independent Auditors<br />
Ernst & Young LLP<br />
Cleveland, Ohio<br />
Stock Trading<br />
<strong>Sherwin</strong>-<strong>Williams</strong> Common<br />
Stock–Symbol, SHW–is traded on the<br />
New York Stock Exchange.<br />
Transfer Agent & Registrar<br />
The Bank of New York<br />
Shareholder <strong>Relations</strong> Department-11E<br />
P.O. Box 11258<br />
Church Street Station<br />
New York, NY 10286<br />
1-800-432-0140<br />
E-mail address:<br />
Shareowner-svcs@Email.bony.com<br />
COMMON STOCK TRADING STATISTICS<br />
<strong>2000</strong> 1999 1998 1997 1996<br />
High . . . . . . . . . . . . . . . . . . . . . . . . . . . . . . . . . . . . . . . . . . . . $ 27.625 $ 32.875 $ 37.875 $ 33.375 $ 28.875<br />
Low . . . . . . . . . . . . . . . . . . . . . . . . . . . . . . . . . . . . . . . . . . . . . 17.125 18.750 19.438 24.125 19.500<br />
Close December 31 . . . . . . . . . . . . . . . . . . . . . . . . . . . . . . . . . 26.313 21.000 29.375 27.750 28.000<br />
Shareholders of record . . . . . . . . . . . . . . . . . . . . . . . . . . . . . 10,813 11,475 11,929 11,964 11,933<br />
Shares traded (thousands) . . . . . . . . . . . . . . . . . . . . . . . . . . 158,349 161,118 128,942 98,855 72,638<br />
QUARTERLY STOCK PRICES AND DIVIDENDS<br />
<strong>2000</strong> 1999<br />
Quarter High Low Dividend Quarter High Low Dividend<br />
1st $ 23.000 $ 17.125 $ .135 1st $ 30.688 $ 23.063 $ .12<br />
2nd 27.625 21.172 .135 2nd 32.875 27.000 .12<br />
3rd 24.625 19.875 .135 3rd 30.000 19.438 .12<br />
4th 26.563 18.875 .135 4th 23.125 18.750 .12<br />
The <strong>Sherwin</strong>-<strong>Williams</strong> Company <strong>2000</strong> <strong>Annual</strong> <strong>Report</strong> | 39
SUBSIDIARIES<br />
FOREIGN<br />
Compañia <strong>Sherwin</strong>-<strong>Williams</strong>, S.A. de C.V.<br />
Distribuidores Pinturas del Mundo S.r.L.<br />
Eurofinish S.r.L.<br />
Kriesol, S.A.<br />
Marson Chilena, S.A.<br />
Productos Quimicos y Pinturas, S.A. de C.V.<br />
Proquipsa, S.A. de C.V.<br />
Pulverlack Tintas Ltda.<br />
Quetzal Pinturas, S.A. de C.V.<br />
Ronseal (Ireland) Limited<br />
Ronseal Limited<br />
ScottWarren S.p.A.<br />
<strong>Sherwin</strong>-<strong>Williams</strong> (Caribbean) N.V.<br />
<strong>Sherwin</strong>-<strong>Williams</strong> (West Indies) Limited<br />
<strong>Sherwin</strong>-<strong>Williams</strong> Argentina I.y C.S.A.<br />
<strong>Sherwin</strong>-<strong>Williams</strong> Canada Inc.<br />
<strong>Sherwin</strong>-<strong>Williams</strong> Cayman Islands Limited<br />
<strong>Sherwin</strong>-<strong>Williams</strong> Chile S.A.<br />
<strong>Sherwin</strong>-<strong>Williams</strong> do Brasil Industria e Comercio Ltda.<br />
<strong>Sherwin</strong>-<strong>Williams</strong> Foreign Sales Corporation Limited<br />
<strong>Sherwin</strong>-<strong>Williams</strong> Japan Co., Ltd.<br />
SW Paints Ltda.<br />
The <strong>Sherwin</strong>-<strong>Williams</strong> Company Resources Limited<br />
DOMESTIC<br />
Contract Transportation Systems Co.<br />
DIMC, Inc.<br />
Dupli-Color Products Company<br />
<strong>Sherwin</strong>-<strong>Williams</strong> Automotive Finishes Corp.<br />
SWIMC, Inc.<br />
The <strong>Sherwin</strong>-<strong>Williams</strong> Acceptance Corporation<br />
Thompson Minwax International Corp.<br />
40| The <strong>Sherwin</strong>-<strong>Williams</strong> Company <strong>2000</strong> <strong>Annual</strong> <strong>Report</strong>
5 2<br />
2<br />
1<br />
15 7<br />
5<br />
7<br />
1<br />
1 1<br />
32 4<br />
24 1 9<br />
14 1<br />
91 15<br />
13 1<br />
10<br />
6<br />
38 2<br />
26 3 15 1<br />
7<br />
7<br />
16 1<br />
39<br />
207 11<br />
41 2<br />
45<br />
28<br />
2<br />
1 58<br />
1<br />
3<br />
39 1<br />
56<br />
2<br />
48 1<br />
85 1<br />
45<br />
61<br />
3<br />
82<br />
169<br />
38 2<br />
68 5<br />
57<br />
1<br />
3<br />
86<br />
3<br />
9<br />
145<br />
19<br />
10<br />
15<br />
76 3 38 3<br />
116 6<br />
10<br />
46 2 32 2<br />
14<br />
7<br />
34 3<br />
73 7<br />
97<br />
56<br />
2<br />
4<br />
14<br />
2<br />
3 1<br />
78<br />
14<br />
25<br />
2<br />
16<br />
29<br />
17
The <strong>Sherwin</strong>-<strong>Williams</strong> Company | 101 Prospect Avenue, N.W. | Cleveland, Ohio | 44115-1075