WHAT IS ARKANSAS DOING TO CLOSE THE ACHIEVEMENT GAP?
WHAT IS ARKANSAS DOING TO CLOSE THE ACHIEVEMENT GAP?
WHAT IS ARKANSAS DOING TO CLOSE THE ACHIEVEMENT GAP?

Create successful ePaper yourself
Turn your PDF publications into a flip-book with our unique Google optimized e-Paper software.
economically disadvantaged students on the other. 67 He also<br />
used Advanced Placement, Gifted and Talented, and dropout<br />
data to demonstrate a severe achievement gap between white,<br />
African American, and Latino students. African American<br />
and Latino students were significantly underrepresented in<br />
Advanced Placement courses as well as the Gifted and Talented<br />
Program, while white and Asian students were significantly<br />
overrepresented (Rickard 2005, 23-4). African American<br />
students were significantly overrepresented in suspension and<br />
expulsion rates, as well as dropout rates (Rickard 2005, 24).<br />
Finally, African American students in Arkansas scored 15% to<br />
20% below the state average on the ACT (Rickard 2005, 27).<br />
Since 2005, the achievement gap has persisted. The most<br />
recent Arkansas Benchmark Test scores show that the test scores<br />
of all students have generally risen, but reflect only a slight<br />
narrowing of the white-African American achievement gap and<br />
an increase in the white and Latino achievement gap (Arkansas<br />
7 For example, more than twice as many white 11 th graders<br />
(55%) score at proficient or advanced levels in literacy<br />
than African American (19%), economically disadvantaged<br />
(27%), or Latino students (28%) (Rickard 2005, 14).<br />
Department of Education 2007).<br />
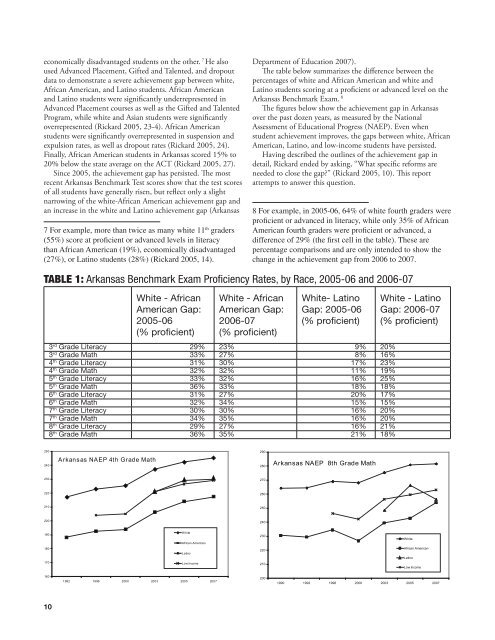
The table below summarizes the difference between the<br />
percentages of white and African American and white and<br />
Latino students scoring at a proficient or advanced level on the<br />
Arkansas Benchmark Exam. 78<br />
The figures below show the achievement gap in Arkansas<br />
over the past dozen years, as measured by the National<br />
Assessment of Educational Progress (NAEP). Even when<br />
student achievement improves, the gaps between white, African<br />
American, Latino, and low-income students have persisted.<br />
Having described the outlines of the achievement gap in<br />
detail, Rickard ended by asking, “What specific reforms are<br />
needed to close the gap” (Rickard 2005, 10). This report<br />
attempts to answer this question.<br />
8 For example, in 2005-06, 64% of white fourth graders were<br />
proficient or advanced in literacy, while only 35% of African<br />
American fourth graders were proficient or advanced, a<br />
difference of 29% (the first cell in the table). These are<br />
percentage comparisons and are only intended to show the<br />
change in the achievement gap from 2006 to 2007.<br />
TABLE 1: Arkansas Benchmark Exam Profi ciency Rates, by Race, 2005-06 and 2006-07<br />
White - African<br />
American Gap:<br />
2005-06<br />
(% proficient)<br />
White - African<br />
American Gap:<br />
2006-07<br />
(% proficient)<br />
White- Latino<br />
Gap: 2005-06<br />
(% proficient)<br />
3 rd Grade Literacy 29% 23% 9% 20%<br />
3 rd Grade Math 33% 27% 8% 16%<br />
4 th Grade Literacy 31% 30% 17% 23%<br />
4 th Grade Math 32% 32% 11% 19%<br />
5 th Grade Literacy 33% 32% 16% 25%<br />
5 th Grade Math 36% 33% 18% 18%<br />
6 th Grade Literacy 31% 27% 20% 17%<br />
6 th Grade Math 32% 34% 15% 15%<br />
7 th Grade Literacy 30% 30% 16% 20%<br />
7 th Grade Math 34% 35% 16% 20%<br />
8 th Grade Literacy 29% 27% 16% 21%<br />
8 th Grade Math 36% 35% 21% 18%<br />
White - Latino<br />
Gap: 2006-07<br />
(% proficient)<br />
250<br />
290<br />
240<br />
Arkansas NAEP 4th Grade Math<br />
280<br />
Arkansas NAEP 8th Grade Math<br />
230<br />
270<br />
220<br />
260<br />
210<br />
250<br />
200<br />
240<br />
190<br />
White<br />
African American<br />
230<br />
White<br />
180<br />
Latino<br />
220<br />
African American<br />
Latino<br />
170<br />
Low Income<br />
210<br />
Low Income<br />
160<br />
1992 1996 2000 2003 2005 2007<br />
200<br />
1990 1992 1996 2000 2003 2005 2007<br />
10