Micro Theory Problems and Practice Exams - Lake Forest College ...
Micro Theory Problems and Practice Exams - Lake Forest College ...
Micro Theory Problems and Practice Exams - Lake Forest College ...

Create successful ePaper yourself
Turn your PDF publications into a flip-book with our unique Google optimized e-Paper software.
MICRO THEORY PROBLEMS AND PRACTICE EXAMS<br />
Companion Guide to Econ 210<br />
This section contains over 100 problems. These problems represent an almost complete compilation of<br />
nine years of exam questions.<br />
Question 1<br />
In the United States there is great dem<strong>and</strong> for human organs for medical transplants. A person suffering<br />
from kidney or liver failure, for example, can wait for many years before receiving a replacement organ.<br />
At the same time, for ethical reasons it is illegal (<strong>and</strong> will remain illegal) for healthy people to sell their<br />
organs. Rather, all transplanted organs come from people who agree to donate their organs upon their<br />
death (<strong>and</strong> then die).<br />
A. Explain in the simplest economic terms possible why the waiting list is so long.<br />
B. Suppose someone proposed the following policy: a person with a failed organ can only put their name<br />
on the list for a new organ if she or he willingly becomes an organ donor. Explain why this proposal<br />
would not be likely to substantially reduce the waiting time.<br />
C. Explain how the proposal could be altered slightly to make the proposal successful at substantially<br />
reducing waiting times. That is, how might the proposal in part B be amended or changed slightly to<br />
have the desired effect of reducing the waiting time for donated organs<br />
Question 2<br />
A supposedly important aspect of the “War on Terrorism” requires the U.S. to prevent terrorists from<br />
smuggling weapons or chemicals into the United States in cargo containers that are shipped to the U.S. on<br />
freight boats from all around the world, <strong>and</strong> in particular, from foreign ports that do not have tight<br />
security. Thus, the Department of Homel<strong>and</strong> Security needs to determine how many cargo containers to<br />
inspect <strong>and</strong> how thoroughly to inspect them. From an economic perspective, how should these decisions<br />
be made<br />
Question 3<br />
Suppose six people get together to watch the Super Bowl. All six people like Pepsi a lot. When they get<br />
together, there is one case of Pepsi, containing twelve cans of Pepsi.<br />
A. Describe a Pareto efficient distribution of the Pepsi that is not very equitable.<br />
B. Describe an equitable distribution of the Pepsi that is not Pareto efficient.<br />
Question 4<br />
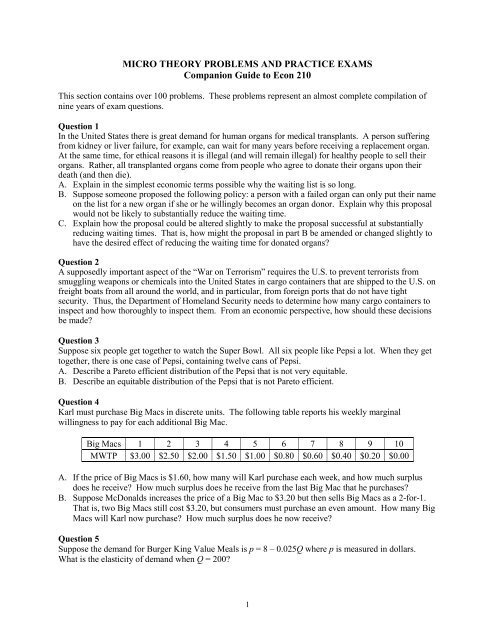
Karl must purchase Big Macs in discrete units. The following table reports his weekly marginal<br />
willingness to pay for each additional Big Mac.<br />
Big Macs 1 2 3 4 5 6 7 8 9 10<br />
MWTP $3.00 $2.50 $2.00 $1.50 $1.00 $0.80 $0.60 $0.40 $0.20 $0.00<br />
A. If the price of Big Macs is $1.60, how many will Karl purchase each week, <strong>and</strong> how much surplus<br />
does he receive How much surplus does he receive from the last Big Mac that he purchases<br />
B. Suppose McDonalds increases the price of a Big Mac to $3.20 but then sells Big Macs as a 2-for-1.<br />
That is, two Big Macs still cost $3.20, but consumers must purchase an even amount. How many Big<br />
Macs will Karl now purchase How much surplus does he now receive<br />
Question 5<br />
Suppose the dem<strong>and</strong> for Burger King Value Meals is p = 8 – 0.025Q where p is measured in dollars.<br />
What is the elasticity of dem<strong>and</strong> when Q = 200<br />
1
Question 6<br />
The dem<strong>and</strong> for apples is Q = 2,000 – 1,000p <strong>and</strong> the current price for an apple is $1.20. What is the<br />
elasticity of dem<strong>and</strong> for apples<br />
Question 7<br />
Consider the following dem<strong>and</strong> function for skateboards: Q D = 100 – 2p + 4p A – 3p B + 0.005Y.<br />
A. Are skateboards <strong>and</strong> good A (whose price is represented by p A ) complements or substitutes<br />
B. Are skateboards normal or inferior<br />
C. Suppose the price of a skateboard is $100, the price of good A is $125, the price of good B is $75, <strong>and</strong><br />
average income is $5,000 per month. What is the cross-price elasticity of skateboards with respect to<br />
good A<br />
Question 8<br />
Suppose Toys-R-Us faces dem<strong>and</strong> for model airplanes in September of:<br />
Q D = 35 – 5p – 0.5p G + 1.5p MC + 10Y,<br />
where p is the price of a model airplane, p G <strong>and</strong> p MC represent prices of other goods, <strong>and</strong> Y is average<br />
monthly household income in thous<strong>and</strong>s of dollars<br />
A. Is the good with a price of p G a complement to or a substitute for model airplanes<br />
B. Is the good with a price of p MC a complement to or a substitute for model airplanes<br />
C. Extra Credit: What do G <strong>and</strong> MC st<strong>and</strong> for<br />
D. Are model airplanes a normal or an inferior good<br />
E. Suppose p G = $2, p MC = $8, <strong>and</strong> average monthly income is $5,400 (i.e., average monthly income is<br />
5.4 thous<strong>and</strong>s of dollars). Rewrite the monthly dem<strong>and</strong> for model airplanes in terms of just Q D <strong>and</strong> p.<br />
F. Transform the dem<strong>and</strong> function into an inverse dem<strong>and</strong> function.<br />
G. How many model airplanes will Toys-R-Us sell in September if it sets a price of $12<br />
H. What is the elasticity of dem<strong>and</strong> when price equals $12<br />
I. At what price would the elasticity of dem<strong>and</strong> equal -3<br />
J. Which of the following dem<strong>and</strong> functions: Q D = 50 – 5p – 0.5p G + 1.5p MC + 10Y or<br />
Q D = 15 – 5p – 0.5p G + 1.5p MC + 10Y is more likely to be the monthly dem<strong>and</strong> for model airplanes in<br />
December<br />
Question 9<br />
When her income is $25,000 a year, Maggie spends $1,250 on sporting tickets annually. If her income<br />
would increase to $40,000 a year, she would spend $1,500 on sporting tickets annually. What is her<br />
income elasticity of sporting tickets<br />
Question 10<br />
The (inverse) market dem<strong>and</strong> for CDs can be expressed as p = 50 – 0.01Q. What is the price elasticity of<br />
dem<strong>and</strong> for CDs at a price of $20<br />
Question 11<br />
Suppose the dem<strong>and</strong> for cars is Q = 45000 – 5p – 2000p G + 500Y, where p is the price of a car, p G is the<br />
price of a gallon of gas, <strong>and</strong> Y is the average yearly household income in thous<strong>and</strong>s of dollars.<br />
A. Suppose p = $10,000, p G = $2.50, <strong>and</strong> Y = $30. How many cars are dem<strong>and</strong>ed under these<br />
conditions<br />
B. Calculate the price elasticity of dem<strong>and</strong>, the income elasticity of dem<strong>and</strong>, <strong>and</strong> the cross-price<br />
elasticity of dem<strong>and</strong> between cars <strong>and</strong> gas under the same conditions as in part A.<br />
2
Question 12<br />
The inverse supply curve for CD’s is p = 2 + 0.01Q S . What is the elasticity of supply when the price of a<br />
CD is $14<br />
Question 13<br />
Consider the following industry dem<strong>and</strong> <strong>and</strong> supply functions: Q D = 5000 – 20p <strong>and</strong> Q S = –400 + 4p.<br />
A. Solve for the inverse dem<strong>and</strong> function.<br />
B. Solve for the inverse supply function.<br />
C. Solve for the market equilibrium.<br />
Question 14<br />
The dem<strong>and</strong> for home security systems is given by Q D = 4,000 – 10p. The supply of home security<br />
systems is given by Q S = 20p – 2,000. What is the market equilibrium At the equilibrium price, what is<br />
the elasticity of dem<strong>and</strong> At the equilibrium price, what is the elasticity of supply<br />
Question 15<br />
The dem<strong>and</strong> for <strong>and</strong> supply of yachts are Q D = 5000 – 0.01p <strong>and</strong> Q S = 0.04p – 10000. What is the market<br />
equilibrium<br />
Question 16<br />
The dem<strong>and</strong> for weekly airplane travel is p = 10000 – 20Q where p is measured in dollars. The supply of<br />
weekly airplane travel is p = 2000 + 5Q. What is the market equilibrium What is the elasticity of<br />
dem<strong>and</strong> at the market equilibrium What is the elasticity of supply at the market equilibrium<br />
Question 17<br />
Consider the market for CDs. Monthly dem<strong>and</strong> <strong>and</strong> supply are Q D = 2,500 – 50p <strong>and</strong> Q S = 150p – 300.<br />
A. Solve for the inverse dem<strong>and</strong> <strong>and</strong> inverse supply functions.<br />
B. Solve for the equilibrium.<br />
C. How many CDs are dem<strong>and</strong>ed <strong>and</strong> supplied under (i) a $16 price floor, (ii) a $16 price ceiling, (iii) a<br />
$10 price floor, <strong>and</strong> (iv) a $10 price ceiling.<br />
D. Suppose income increases causing dem<strong>and</strong> to become Q D = 2,900 – 50p. Are CDs a normal or<br />
inferior good Solve for the new equilibrium.<br />
Question 18<br />
The market for cars is described by: Q D = 2,500 – 0.1p <strong>and</strong> Q S = 0.05p – 500.<br />
A. What is the market equilibrium<br />
B. What is the elasticity of dem<strong>and</strong> at the equilibrium<br />
C. What is the elasticity of supply at the equilibrium<br />
D. If the government sets a price ceiling of $14,000 per car, how many cars would be bought Is there a<br />
shortage or a surplus of cars If so, how large is it<br />
E. If the government sets a price floor of $14,000 per car, how many cars would be bought Is there a<br />
shortage or a surplus of cars If so, how large is it<br />
F. If the government sets a price ceiling of $24,000 per car, how many cars would be bought Is there a<br />
shortage or a surplus of cars If so, how large is it<br />
G. If the government sets a price floor of $24,000 per car, how many cars would be bought Is there a<br />
shortage or a surplus of cars If so, how large is it<br />
3
Question 19<br />
Presently each bag of dog food sells for $14. Moreover, the price elasticity of dem<strong>and</strong> for dog food is<br />
–0.6 while the price elasticity of supply of dog food is +1.8. Suppose the government starts to require<br />
firms to pay a $4 excise tax for each bag of dog food that it sells. How much of the $4 tax will consumers<br />
bear What is the new price consumers pay for a bag of dog food<br />
Question 20<br />
Best Buy faces weekly dem<strong>and</strong> for its DVD movies of<br />
Q D = 500 – 20p + 10p RGI – 5p RGII + Y<br />
where Q D is the number of DVD movies, p is the price of each movie, p RGI <strong>and</strong> p RGII are the prices of two<br />
related goods, <strong>and</strong> Y is average monthly income. The current values for the other prices <strong>and</strong> income are:<br />
p RGI = $20, p RGII = $50, <strong>and</strong> Y = $650.<br />
A. According to the dem<strong>and</strong> equation, are DVD movies <strong>and</strong> the first other related good, whose price is<br />
p RGI , complements or substitutes<br />
B. Algebraically solve for the dem<strong>and</strong> curve <strong>and</strong> the inverse dem<strong>and</strong> curve.<br />
C. Suppose Best Buy supplies DVD movies on a weekly basis according to Q S = 25p – 250.<br />
Algebraically solve for the inverse supply curve.<br />
D. Solve for the market equilibrium.<br />
E. Calculate the elasticity of dem<strong>and</strong> at the market equilibrium.<br />
F. Calculate the elasticity of supply at the market equilibrium.<br />
G. What percentage of a per-unit tax do consumers pay<br />
H. What would the price of a DVD be following a tax of $4.50 per DVD<br />
Question 21<br />
Suppose the government imposes a $2 excise tax on each taxi ride provided in Chicago.<br />
A. Under what condition(s) would the imposition of such a tax not result in the quantity of taxi rides<br />
purchased in Chicago to fall That is, under what condition(s) will quantity dem<strong>and</strong>ed be unaffected<br />
by the tax<br />
B. If the condition(s) in part A are met, what will happen to the price of each taxi ride<br />
Question 22<br />
In response to a recent mad-cow disease scare, the U.S. Food <strong>and</strong> Drug Administration decided to require<br />
all cows be tested for the disease. The test costs $500 per cow. With the test being administered,<br />
however, consumers are confident in their food supply <strong>and</strong> do not change their willingness to pay for<br />
beef. According to the st<strong>and</strong>ard model of supply <strong>and</strong> dem<strong>and</strong>, how will the testing of cows affect the<br />
supply of beef, the price of beef, <strong>and</strong> the total amount of beef purchased in the market<br />
Question 23<br />
Consider the market for gasoline in the United States. How did the equilibrium price <strong>and</strong> quantity change<br />
in the wake of hurricanes Katrina <strong>and</strong> Rita, which left more than twenty-five percent of the infrastructure<br />
for oil transportation <strong>and</strong> oil refining in the U.S. unusable at least for several months<br />
4
Question 24<br />
A. What happens to the equilibrium price <strong>and</strong> quantity of hamburgers when the price of tacos, a<br />
substitute, falls How have the supply <strong>and</strong> dem<strong>and</strong> curves for hamburgers shifted Draw a graph<br />
showing these shifts.<br />
B. What happens to the equilibrium price <strong>and</strong> quantity of hamburgers when the price of cattle feed<br />
increases How have the supply <strong>and</strong> dem<strong>and</strong> curves for hamburgers shifted Draw a graph showing<br />
these shifts.<br />
C. What happens to the equilibrium price <strong>and</strong> quantity of hamburgers when non-labor income increases<br />
How have the supply <strong>and</strong> dem<strong>and</strong> curves for hamburgers shifted Clearly state any assumptions you<br />
make. Draw a graph showing these shifts.<br />
Question 25<br />
Consider two goods: food <strong>and</strong> pollution. People like food but do not like pollution. Draw some<br />
indifference curves for food <strong>and</strong> pollution. (Put food on the x-axis <strong>and</strong> pollution on the y-axis.) Label<br />
three indifference curves so that consumers prefer IC 3 to IC 2 to IC 1 .<br />
Question 26<br />
Neil takes $40 to a Chicago Bears game to spend on beer <strong>and</strong> hotdogs. Each beer costs $4. Each hotdog<br />
costs $5.<br />
A. Draw Neil’s budget line. Label it BL A .<br />
B. Suppose the price of each hotdogs falls to $4. Draw Neil’s new budget line. Label it BL B .<br />
C. Suppose instead that Neil brings $60 with him to the game instead of $40. Draw his new budget line<br />
using the original prices of $4 per beer <strong>and</strong> $5 per hotdog. Label it BL C .<br />
D. Return to the original situation − income of $40 <strong>and</strong> prices of $4 per beer <strong>and</strong> $5 per hotdog.<br />
Suppose Cook County levies a $1 excise tax (or quantity tax) on each beer. Draw Neil’s new budget<br />
line. Label it BL D .<br />
E. Return to the original situation − income of $40 <strong>and</strong> prices of $4 per beer <strong>and</strong> $5 per hotdog.<br />
Suppose Cook County levies a 25% ad valorem tax on the purchase of all goods at Bears game. Draw<br />
Neil’s new budget line. Label it BL E .<br />
Question 27<br />
Karla has to buy beer <strong>and</strong> pizza for a party. Parts A – C require you to draw Karla’s budget line under<br />
different conditions. Be sure to state the slope of the budget line as well as both intercepts <strong>and</strong> all other<br />
interesting points. Provide a separate graph for each part. Put beer on the X-axis.<br />
A. Karla has $240 to spend. Each beer costs $3. Each pizza costs $12.<br />
B. Karla has $150 to spend. Before paying taxes, each beer costs $2 <strong>and</strong> each pizza costs $10. The<br />
government levies a $0.50 tax on each beer.<br />
C. Karla has $320 to spend. Each beer costs $5. The regular price of a pizza is $15, but Karla receives a<br />
$5 discount on every pizza she buys after buying 10 at the regular price.<br />
Question 28<br />
Consider a two-good, fixed price economy. The two goods are hammocks <strong>and</strong> swings. The price of each<br />
hammock is $120. The price of each swing is $40. The director of a retirement community has $6,000 to<br />
spend on furnishing the out-door patio area with hammocks <strong>and</strong> swings.<br />
A. Draw the director’s budget line. (Put hammocks on the x-axis.) Label this budget line BL A .<br />
B. Suppose the price of swings doubles. Draw the new budget line. Label this budget line BL B .<br />
C. Ignoring part B, suppose someone gives the retirement community a gift of $3,000 to help it furnish<br />
the patio. As a result of this gift, the administration of the retirement community decides to reduce its<br />
budget for patio furniture from $6,000 to $4,200. With the gift of $3,000, therefore, the director’s<br />
new budget is $7,200. Draw the new budget line. Label this budget line BL C .<br />
5
Question 29<br />
Consider a two-good, fixed price economy. The two goods are sheets of music <strong>and</strong> guitar picks. The<br />
price of each sheet of music is 60¢ regardless of what store Don goes to. There is a music store that Don<br />
can walk to but that store does not sell guitar picks. Traveling to the next closest store, which does sell<br />
guitar picks at $3 per pick, requires Don to purchase a $6 round-trip train ticket. Don does not care about<br />
the time involved in traveling to either store. Don has a budget of $24. Graph Don’s budget line. Put<br />
sheets of music on the x-axis.<br />
Question 30<br />
Consider a two-good economy with fixed prices. The goods are books <strong>and</strong> movies.<br />
A. Graph the budget line when the price of each book is $40, the price of each movie is $12, <strong>and</strong> a<br />
consumer has $120 to spend. Indicate the value of the intercepts <strong>and</strong> slope of the budget line. Label<br />
the budget line BL A .<br />
B. Graph a new budget line when the price of each movie decreases to $8 while the price of books <strong>and</strong><br />
the consumer’s budget remains fixed. Label this budget line BL B .<br />
Question 31<br />
As a financially strained college student, you are faced with the following situation. In return for your<br />
tuition, <strong>Lake</strong> <strong>Forest</strong> <strong>College</strong> gives you a place to live, pays for your books <strong>and</strong> supplies, <strong>and</strong> lets you take<br />
classes. Your own financial resources leave you with $120 to spend each month. The only goods which<br />
you can buy are Pepsi (which is life sustaining) <strong>and</strong> cellular phone service (which is social-life<br />
sustaining). Each can of Pepsi costs $1. If you sign on with the cellular service, they give you a phone<br />
for free but charge a monthly access fee of $20. Additionally, you are charged 50 cents per minute for<br />
each of the first 100 minutes you use the service. If you use more than 100 minutes, each minute after<br />
your first 100 <strong>and</strong> up to a total of 200 is billed at a rate of 25 cents per minute. If you use more than 200<br />
minutes, each minute in excess of 200 minutes is billed at 20 cents per minute.<br />
A. If you use 50 minutes of airtime, how many cans of Pepsi will you be able to buy<br />
B. Show that consuming 40 cans of Pepsi <strong>and</strong> using 140 minutes is on your budget line.<br />
C. Draw your budget line.<br />
D. Suppose, faced with all of the options on the budget line, your optimal choice is to buy 75 cans of<br />
Pepsi <strong>and</strong> 50 minutes of airtime. Now, the phone company proposes to change its fee schedule. It<br />
will eliminate its monthly fee, but charge a flat rate of $0.80 per minute. Should you, an economic<br />
agent with well-behaved preferences, favor the new proposal by the phone company<br />
Question 32<br />
Best Buy sells DVDs <strong>and</strong> VHS tapes. Each DVD sells for $20 each.<br />
A. Because of weak dem<strong>and</strong> for VHS tapes, Best Buy sells the first four VHS tapes purchased by any<br />
consumer at a price of $15 each, but sells each additional tape at the discounted price of $12 per tape.<br />
Graph a consumer’s budget constraint if she has $120 to spend on DVDs <strong>and</strong> VHS tapes.<br />
B. Repeat part A using the same information except that instead of giving the consumer a price break<br />
after buying the first four VHS tapes, assume Best Buy sells each VHS tape for $15 to consumers<br />
who buy at most four <strong>and</strong> sells each VHS tape (including the first four) to consumers who buy more<br />
than four tapes at a price of $12 per tape.<br />
C. Under the pricing scheme of part B, if someone has well-behaved preferences over DVDs <strong>and</strong> VHS<br />
tapes, what is the greatest number of VHS tapes she might purchase with her $120 assuming she<br />
purchases 4 or fewer tapes<br />
Question 33<br />
What would you predict to happen to the equilibrium price <strong>and</strong> quantity of computer chips if there is a<br />
technological advance that allows computer chips to be made three times faster than is currently possible<br />
6
Question 34<br />
According to our basic model of consumer behavior, how do indifference curves shift when income<br />
increases<br />
Question 35<br />
Draw some indifference curves for two goods that are both disliked, such as pollution <strong>and</strong> traffic jams.<br />
Question 36<br />
Which of our four assumptions – completeness, transitivity, monotonicity, <strong>and</strong> diminishing returns – are<br />
violated by perfect substitutes<br />
Good 2<br />
Perfect Substitutes<br />
Good 1<br />
Question 37<br />
Nathan likes cookies <strong>and</strong> is always willing to eat more, but he does not care for peas. When his mom<br />
gives him peas, Nathan casually drops them on the floor <strong>and</strong> let’s his dog eat them. (The dog likes peas<br />
<strong>and</strong> is always willing to eat more.) As dropping peas on the floor is rather easy, doing so does not cause<br />
Nathan any disutility. Graph Nathan’s indifference curves for cookies (x-axis) <strong>and</strong> peas (y-axis).<br />
Question 38<br />
Olivia’s preferences are well-behaved. Below are graphed five possible consumption bundles. Thus,<br />
there are 10 two-way comparisons using all five bundles. Olivia reveals that she prefers E to A <strong>and</strong><br />
prefers D to E. What can you say about the other 8 possible comparisons<br />
Good 2<br />
Possible Consumption Bundles<br />
D<br />
A<br />
E<br />
B<br />
C<br />
Good 1<br />
7
Question 39<br />
Regardless of his consumption level, Tony always receives the same happiness from consuming 3<br />
minutes of long-distance as he does from consuming 2 minutes of dial-up.<br />
A. Provide a utility function describing Tony’s preference ordering for long-distance <strong>and</strong> dial-up.<br />
B. Using the utility function you gave in part A, which consumption bundle does Tony prefer: 15<br />
minutes of long-distance <strong>and</strong> 32 minutes of dial-up or 24 minutes of long-distance <strong>and</strong> 28 minutes of<br />
dial-up<br />
C. Draw some of Tony’s indifference curves. (Put long-distance on the x-axis.)<br />
D. What is Tony’s marginal rate of substitution for long-distance if he consumes 23 minutes of longdistance<br />
<strong>and</strong> 201 minutes of dial-up<br />
Question 40<br />
Katy’s preferences for apples (a) <strong>and</strong> bananas (b) can be represented as: u(a,b) = 3a+5b.<br />
A. What is Katy’s marginal rate of substitution between apples <strong>and</strong> bananas<br />
B. Graph some of Katy’s indifference curves.<br />
C. If the price of each apple is $0.25 <strong>and</strong> the price of each banana is $0.40, how many apples <strong>and</strong><br />
bananas will Katy buy when her income is $4.00<br />
Question 41<br />
Morty values going to 5 baseball games the same as he values going to 2 football games. Each baseball<br />
game costs $10 <strong>and</strong> each football game costs $30. Morty’s sporting entertainment budget is $150 dollars.<br />
A. Draw several of Morty’s indifference curves.<br />
B. Draw Morty’s budget line. Is going to 4 baseball games <strong>and</strong> 4 football games on his budget line<br />
C. What is Morty’s marginal rate of substitution of baseball games for football games at the point of<br />
going to 4 baseball games <strong>and</strong> 4 football games<br />
D. What is Morty’s optimal consumption bundle<br />
Question 42<br />
Due to a rather active baby, Maggie always uses 1 bib with every 12 jars of baby food.<br />
A. Provide a utility function describing Maggie’s preference ordering for bibs <strong>and</strong> jars of baby food.<br />
B. Using the utility function you gave in part A, which consumption bundle does Maggie prefer: 4 bibs<br />
<strong>and</strong> 30 jars of food or 6 bibs <strong>and</strong> 15 jars of food<br />
C. Draw some of Maggie’s indifference curves. (Put bibs on the x-axis.)<br />
D. What is Maggie’s marginal rate of substitution for bibs when she consumes 9 bibs <strong>and</strong> 9 jars of food<br />
Question 43<br />
Kim’s preferences for apples (a) <strong>and</strong> bananas (b) can be represented as: u(a,b) = b + a 0.5 .<br />
A. Graph some of Kim’s indifference curves.<br />
B. What is Kim’s marginal rate of substitution between apples <strong>and</strong> bananas<br />
C. Is v(a,b) = b 2 + a a monotonic transformation of u(a,b)<br />
Question 44<br />
S<strong>and</strong>ra’s preferences for cookies (c) <strong>and</strong> donuts (d) can be represented as u(c,d) = 2.5c 5 d 10 . Provide a<br />
transformed utility function of S<strong>and</strong>ra’s preferences so that the exponents refer to income shares.<br />
Question 45<br />
For lunch, Joey eats cokes <strong>and</strong> s<strong>and</strong>wiches in equal proportions−1 coke for every 2 s<strong>and</strong>wiches. Joey has<br />
$30 for the week. Each coke costs $1, <strong>and</strong> each s<strong>and</strong>wich costs $2.50. What is Joey’s optimal<br />
consumption bundle<br />
8
Question 46<br />
True or False: The preference ordering described by perfect complements is well-behaved. Explain.<br />
Question 47<br />
Under well-behaved preferences, will the marginal utility from consuming a good increase or decrease as<br />
one’s consumption of that good increases That is, if x 1 ↑ → MU 1 ↑ or MU 1 ↓ Which assumption of wellbehaved<br />
preferences guarantees this result<br />
Question 48<br />
One representation of Ben’s preferences for beer (b) <strong>and</strong> cigarettes (c) is v(b,c) = 32b 2 c 3 .<br />
A. Using a monotonic transformation, Ben’s utility can be written as u(b,c) = b α c 1-α . What is the value<br />
for α<br />
B. Consider the bundle of 10 beers <strong>and</strong> 30 cigarettes, <strong>and</strong> use the new utility function, u(b,c), to answer<br />
the following questions. Use the calculus formulas to answer questions a – c.<br />
a. What is Ben’s marginal utility from beer<br />
b. What is Ben’s marginal utility from cigarettes<br />
c. What is Ben’s marginal rate of substitution for beer<br />
Question 49<br />
The marginal utility from buying one more Pepsi at a cost of $1 is 16 utils; whereas buying 1 more slice<br />
of pizza at a cost of $2 yields 24 additional utils.<br />
A. Which good is associated with the higher marginal utility<br />
B. Which good is associated with the higher marginal utility per dollar<br />
C. Which good will a utility maximizing economic agent purchase next<br />
Question 50<br />
Amy’s preferences for bags of chips (c) <strong>and</strong> cans soda (s) can be represented as: u(c, s) = c ¾ s ¼ . Each bag<br />
of chips costs $2. Each can of soda costs $0.50. Amy has $12 per week to spend chips <strong>and</strong> soda.<br />
A. Draw Amy’s budget line <strong>and</strong> highest possible indifference curve subject to her budget constraint.<br />
Indicate her optimal consumption level of chips <strong>and</strong> soda.<br />
B. Analytically solve for Amy’s optimal consumption level of chips <strong>and</strong> soda. (Be sure to go back to<br />
your graph <strong>and</strong> label the optimal choices with your numerical answers.)<br />
C. What is Amy’s marginal rate of substitution of soda for chips at her optimal consumption bundle<br />
What is the market cost of 1 more bag of chips in terms of cans of soda<br />
D. Show that consuming (c = 2, s = 16) is on Amy’s budget line. What is Amy’s marginal rate of<br />
substitution of soda for chips at this point<br />
E. Suppose Amy’s budget increases to $16 per week, how many bags of chips will she now consume<br />
What is the income elasticity of chips in this example Are chips normal or inferior<br />
Question 51<br />
Amy’s preferences for bags of chips (c) <strong>and</strong> cans soda (s) can be represented as: u(c,s) = c 8 s 2 . Each bag<br />
of chips costs $1. Each can of soda costs $0.75. Amy has $15 per week to spend on chips <strong>and</strong> soda.<br />
Draw Amy’s budget line. How many bags of chips <strong>and</strong> cans of soda will Amy purchase each week to<br />
maximize her utility.<br />
Question 52<br />
Craig has a budget of $13 to buy milk <strong>and</strong> tacos. Let x represent cartons of milk, <strong>and</strong> y represent tacos.<br />
Each carton of milk costs 65¢. Each taco costs 25¢. What is the optimal consumption bundle if Craig’s<br />
preference ordering can be captured by u(x,y) = x 93 y 31 <br />
9
Question 53<br />
A consumer’s preferences can be expressed with a utility function of u(x,y) = x 3 y 8 . She has income of<br />
$44, <strong>and</strong> faces prices of p X = $4 <strong>and</strong> p Y = $2. How much of each good will she purchase in order to<br />
maximize her utility<br />
Question 54<br />
Suppose preferences for x 1 <strong>and</strong> x 2 can be represented as:<br />
U(x 1 , x 2 ) = 50x 1 13 x 2 52 .<br />
A. Using monotonic transformations, U(x 1 , x 2 ) can be transformed into V(x 1 , x 2 ) = x 1 α x 2<br />
1– α . What is the<br />
value of α<br />
B. Suppose the budget is $1,000, the price of x 1 is $10, <strong>and</strong> the price of x 2 is $80. What is the optimal<br />
consumption bundle<br />
C. Use the transformed utility function to calculate the following items at the optimal consumption<br />
bundle: the marginal utility of x 1 , the marginal utility of x 2 , the marginal rate of substitution, <strong>and</strong> the<br />
marginal rate of transformation.<br />
Question 55<br />
Suppose preferences can be represented by U(B,Z) = 5B 2 Z 3 where B represents the number of beers<br />
consumed <strong>and</strong> Z equals the number of slices of pizza consumed. Each beer costs $2 <strong>and</strong> each slice of<br />
pizza costs $4.<br />
A. Transform U(B,Z) into a Cobb-Douglas function of the form B α Z 1– α . Interpret α.<br />
B. Using the new utility representation, calculate the marginal utility for beer for the (B,Z) bundles (6,1),<br />
(4,8), <strong>and</strong> (10,10).<br />
C. Using the new utility representation, calculate the marginal utility for pizza for the (B,Z) bundles<br />
(6,1), (4,8), <strong>and</strong> (10,10).<br />
D. Calculate the marginal rate of substitution at the (B,Z) bundles (6,1), (4,8), <strong>and</strong> (10,10).<br />
E. If the budget is $20, what is the optimal consumption bundle<br />
Question 56<br />
Preferences for CDs <strong>and</strong> DVDs can be represented by U(C,D) = C 0.25 D 0.75 where C is the number of CDs<br />
<strong>and</strong> D is the number of DVDs. Each CD costs $12 while each DVD costs $20. There is a $240 budget.<br />
A. Show that the (C,D) bundles of (15,3), (10,6), <strong>and</strong> (5,9) are on the budget line.<br />
B. What is the optimal consumption bundle<br />
C. For each of the three bundles listed in part A, calculate the MRS <strong>and</strong> the MRT.<br />
Question 57<br />
Consider an economy with two goods – gloves (g) <strong>and</strong> hats (h). Judy has Cobb-Douglas preferences for<br />
gloves <strong>and</strong> hats according to u(g,h) = g 0.4 h 0.6 .<br />
A. As a function of income (Y) <strong>and</strong> prices (p g <strong>and</strong> p h ), what are Judy’s dem<strong>and</strong> curves for gloves <strong>and</strong><br />
hats<br />
B. Let the price of each pair of gloves be $10 <strong>and</strong> the price of each hat be $12. What is Judy’s Engel<br />
curves for hats. Graph her Engel curve for hats.<br />
C. Let the price of each pair of gloves be $10 <strong>and</strong> the price of each hat be $12. What is Judy’s optimal<br />
consumption bundle if she has a budget of $100<br />
D. Let the price of each pair of gloves be $10 <strong>and</strong> the price of each hat be $12. What is the MRS <strong>and</strong> the<br />
MRT of gloves in terms of hats if Judy consumes 50 pairs of gloves <strong>and</strong> 30 hats<br />
E. How much money would Judy need to afford the proposed bundle in part D If she had that much<br />
money, would she consume more than, exactly, or less than 50 pairs of gloves<br />
10
Question 58<br />
Jack’s dem<strong>and</strong> for DVD’s can be described as q = 250 – 2p – 10Y where p is the price of each DVD.<br />
Graph Jack’s Engel curve holding p fixed at $20 per DVD for Y > $2. Are DVDs normal or inferior<br />
How can you tell if DVDs are normal or inferior from the Engel curve<br />
Question 59<br />
Consider an individual decision maker who consumes two goods, x <strong>and</strong> y, in a 5:3 proportion (i.e., 5 x’s<br />
are eaten with every 3 y’s). Prices are p x <strong>and</strong> p y , <strong>and</strong> the person’s income is Y.<br />
A. Rigorously determine the person’s dem<strong>and</strong> function for good x.<br />
B. Graph the dem<strong>and</strong> function for good x.<br />
C. Graph the Engel curve associated with good x.<br />
Question 60<br />
0.4 0.6<br />
Suppose Kate’s preferences for bales of hay (x 1 ) <strong>and</strong> bushels of oats (x 2 ) are u ( x1 , x2<br />
) = x1<br />
x2<br />
.<br />
A. Solve for <strong>and</strong> graph both of Kate’s dem<strong>and</strong> curves (i.e., one dem<strong>and</strong> curve for hay, <strong>and</strong> one dem<strong>and</strong><br />
curve for oats) assuming that her income is $250.<br />
B. Solve for <strong>and</strong> graph both of Kate’s Engel curves (i.e, one Engel curve for hay, <strong>and</strong> one Engel curve<br />
for oats) assuming that p 1 = $4 <strong>and</strong> p 2 = $3.<br />
C. Suppose Kate’s budget is $250, the price of each bale of hay is $4, <strong>and</strong> the price of each bushel of<br />
oats is $3. What is Kate’s optimal consumption bundle of hay <strong>and</strong> oats<br />
Question 61<br />
Suppose Neil’s preferences for sheets of paper (x 1 ) <strong>and</strong> pencils (x 2 ) are perfect complements in a ratio of<br />
20 sheets of paper with 1 pencil.<br />
A. Solve for <strong>and</strong> graph Neil’s dem<strong>and</strong> curve for paper assuming that his income is $40 <strong>and</strong> the price of<br />
each pencil is 25¢.<br />
B. Solve for <strong>and</strong> graph Neil’s dem<strong>and</strong> curve for pencils assuming that his income is $40 <strong>and</strong> the price of<br />
each sheet of paper is 5¢.<br />
C. Solve for <strong>and</strong> graph both of Neil’s Engel curves assuming that each sheet of paper costs 5¢ <strong>and</strong> each<br />
pencil costs 25¢.<br />
D. Suppose Neil’s budget for paper <strong>and</strong> pencils is $40, each sheet of paper costs 5¢, <strong>and</strong> each pencil<br />
costs 25¢. What is Neil’s optimal consumption of sheets of paper <strong>and</strong> pencils<br />
Question 62<br />
Suppose Joni treats her consumption of subway rides (s) <strong>and</strong> taxi rides (t) as perfect substitutes, where<br />
each taxi ride can substitute for two subway rides (likewise, two subway rides can substitute for one taxi<br />
ride).<br />
A. Provide a utility function that represents Joni’s preference.<br />
B. Solve for <strong>and</strong> graph Joni’s dem<strong>and</strong> for subway rides assuming that her weekly budget for subway <strong>and</strong><br />
taxi rides is $120 <strong>and</strong> that each taxi ride costs $10.<br />
C. Solve for <strong>and</strong> graph Joni’s dem<strong>and</strong> for taxi rides assuming that her weekly budget for subway <strong>and</strong> taxi<br />
rides is $120 <strong>and</strong> that each subway ride costs $2.<br />
D. Solve for <strong>and</strong> graph both of Joni’s Engel curves assuming that the price of each subway ride is $2<br />
while the price of each taxi ride is $10.<br />
E. Suppose Joni’s weekly budget for subway <strong>and</strong> taxi rides is $120 <strong>and</strong> that each subway ride costs $2<br />
while each taxi ride costs $10. What is Joni’s optimal consumption bundle of subway <strong>and</strong> taxi rides<br />
for the week<br />
11
Question 63<br />
Consider a two-good, fixed prices model of consumer theory with well-behaved preferences. Assume<br />
good 2 is a normal good. True or False: A decrease in the price of good 1 necessarily leads to a decrease<br />
in the quantity dem<strong>and</strong>ed of good 2. Explain.<br />
Question 64<br />
The graph below represents the st<strong>and</strong>ard two-good consumer model. The consumer originally chose<br />
consumption bundle A, then the price of good X fell <strong>and</strong> the consumer chose consumption bundle C. Is X<br />
a normal good, an inferior good, or either Is Y a normal good, an inferior good, or either<br />
Question 65<br />
Consider the st<strong>and</strong>ard two-good, fixed prices model of consumer theory where the two goods are rice <strong>and</strong><br />
steak. Suppose that rice is a Giffen good.<br />
A. Demonstrate using budget lines <strong>and</strong> indifference curves the change in quantity dem<strong>and</strong>ed for rice<br />
when its price increases. Label all budget lines <strong>and</strong> indifference curves. Indicate on your graph the<br />
substitution effect, income effect, <strong>and</strong> total effect.<br />
B. Does rice violate the law of dem<strong>and</strong> in this example<br />
C. Graph a reasonable Engel curve for rice in this example<br />
Question 66<br />
Consider a model of worklife consumption (denoted by C 0 ) versus retirement consumption (denoted by<br />
C 1 ). The consumer is endowed with $4 million of worklife income <strong>and</strong> $1.2 million of retirement<br />
income. The consumer can save worklife income (to spend during retirement) at a guaranteed interest<br />
rate of 25%. Alternatively, the consumer can borrow (to be financed out of retirement income) at an<br />
interest rate of 50% in order to consume more during his worklife.<br />
A. Draw the consumer’s budget line for consumption today versus consumption tomorrow. (Place C 0 on<br />
the y-axis <strong>and</strong> C 1 on the x-axis.) Indicate the slope(s) of the budget line.<br />
B. Might a consumer with well-behaved preferences borrow against his retirement income<br />
C. Consider a consumer with well-behaved preferences who optimally chooses to save some income<br />
today when the rate of return on savings is 25% <strong>and</strong> the rate of payment on borrowing is 50%. How<br />
might this consumer adjust his savings/borrowing if the rate of payment on borrowing falls to 25%<br />
D. Consider a consumer with well-behaved preferences who optimally chooses to not save or borrow<br />
when the rate of return on savings is 25% <strong>and</strong> the rate of payment on borrowing is 50%. How might<br />
this consumer adjust his savings/borrowing if the rate of payment on borrowing falls to 25%<br />
Question 67<br />
Assuming that consumption when young <strong>and</strong> consumption when old are both normal goods, it can be<br />
shown that the effect on current savings from decreasing the capital gains tax rate is ambiguous. That is,<br />
it is not clear if savings will increase or decrease following a cut in the capital gains tax rate. Why<br />
12
Question 68<br />
Consider the basic two-good consumer model where the two goods are consumption today (y-axis) <strong>and</strong><br />
consumption tomorrow (x-axis). Today’s income is Y. There is no income tomorrow other than what is<br />
saved from today’s income. Individual savings does not earn interest. Rather, whatever is saved today is<br />
placed in a lockbox. When tomorrow comes, the consumer opens the lockbox <strong>and</strong> consumes the money<br />
in the box. The price of consuming in both time periods is $1. Parts A - C have you draw a budget line.<br />
For each, specify the interesting points (including intercepts) <strong>and</strong> the slope.<br />
A. Draw the budget line given the set-up above. Label it BL A .<br />
B. Suppose the government requires the consumer to give the government S G where 0 < S G < Y. The<br />
government puts this money in a lockbox for the consumer. When tomorrow comes, the government<br />
returns S G to the consumer. The consumer is also allowed to put S I in a lockbox where 0 < S I < Y with<br />
the condition that S G + S I ≤ Y. Neither S G nor S I earn interest. Draw the budget line. Label it BL B .<br />
C. Suppose the government requires the consumer to give the government S G where 0 < S G < Y. The<br />
government puts this money in a lockbox for the consumer. When the government returns the<br />
consumer’s money to her tomorrow, however, the government gives the consumer 2S G . The<br />
consumer is allowed to put S I in her own lockbox (i.e., personal savings) where 0 < S I < Y with the<br />
condition that S G + S I ≤ Y. Again, S I does not earn interest. Draw the budget line. Label it BL C .<br />
D. What can be said about the consumer’s ranking of BL A , BL B , <strong>and</strong> BL C assuming “nice” preferences<br />
Question 69<br />
The U.S. military posts a wage <strong>and</strong> recruits people who are willing to be a soldier at that wage (i.e., the<br />
U.S. has a “voluntary” army). There has been some discussion about raising the pay of soldiers in order<br />
to get more people to willingly enter the military (that is, to improve recruitment) <strong>and</strong> to entice those who<br />
do enter to remain in the military longer (that is, to improve retention). As an economist, comment<br />
separately on the effect increasing military pay will have on the recruitment <strong>and</strong> retention of soldiers.<br />
Question 70<br />
Consider someone who values consumption (c) <strong>and</strong> leisure (l). Both goods are normal. The person faces<br />
a wage of $8 per hour <strong>and</strong> has no non-labor income.<br />
A. If this person has well-behaved preferences <strong>and</strong> currently does not work, what is his reservation<br />
wage<br />
B. Is it likely that an increase in the person’s non-labor income (e.g., through a lump-sum welfare<br />
payment) will entice the person to start working<br />
C. Instead of a lump-sum transfer, is it possible for a wage subsidy (e.g., through the earned income tax<br />
credit) to entice the person to start working<br />
Question 71<br />
Tina has 112 hours each week to devote to leisure <strong>and</strong>/or work. Tina faces an after-tax hourly wage of<br />
$10 per hour for the first 40 hours of work each week. Any hours she works in excess of 40 hours is<br />
considered overtime, which is paid at “time <strong>and</strong> a half” so that her after-tax overtime hourly wage is $15.<br />
Tina must earn any money that she spends on consumption goods. Graph Tina’s weekly budget line<br />
showing what consumption-leisure bundles Tina can afford.<br />
Question 72<br />
Consider the basic labor supply model in which workers get utility from eating consumption <strong>and</strong> leisure.<br />
The hourly wage is w, each worker can work T hours each week, <strong>and</strong> the price of a unit of consumption is<br />
$1. Assume both consumption <strong>and</strong> leisure are normal goods.<br />
A. What use is it to assume consumption <strong>and</strong> leisure are normal goods. (That is, what does this<br />
assumption tell us about consumption <strong>and</strong> leisure)<br />
B. Under these assumptions, will hours worked by poor, single mothers currently working part-time<br />
necessarily increase if Congress increases the minimum wage<br />
13
Question 73<br />
Calculate the marginal rate of technical substitution for the following three production technologies.<br />
A. f(K,L) = 12K 1/4 L 1/3 .<br />
B. f(K,L) = 4K + 3L.<br />
C. f(K,L) = min{4K, 3L}.<br />
Question 74<br />
The firm’s total cost function written in units of output, q, is: C(q) = 1200 + 6q 2 .<br />
A. Derive the algebraic expression for each of the following: variable costs, fixed costs, average total<br />
costs, average variable costs, average fixed costs, the marginal cost curve, the short-run supply curve,<br />
<strong>and</strong> the long-run supply curve.<br />
B. Plot total costs, variable costs, <strong>and</strong> fixed costs on the same graph.<br />
C. Plot average total cost, average variable costs, average fixed costs, <strong>and</strong> marginal costs on the same<br />
graph.<br />
Question 75<br />
A firm’s total cost function written in units of output, q, is: C(q) = 5000 + 10q.<br />
A. Algebraically solve for the firm’s variable cost curve, fixed costs, average total cost curve, average<br />
variable cost curve, average fixed cost curve, <strong>and</strong> marginal cost curve.<br />
B. Graph the firm’s average total costs, average variable costs, <strong>and</strong> marginal costs on the same graph.<br />
Question 76<br />
Provide values for boxes A – E in the table below.<br />
Quantity Price<br />
Total<br />
Revenue<br />
Total<br />
Cost Profit<br />
Marginal<br />
Cost<br />
Marginal<br />
Revenue<br />
0 --------- --------- $50.00 -$50.00 --------- ---------<br />
1 $25.00 $25.00 $60 -$35.00 $10.00 $25.00<br />
2 $24.00 $48.00 $69 -$21.00 $9.00 $23.00<br />
3 $23.00<br />
4 A $4.00 $19.00<br />
5 B<br />
6 $118.50 $96.75 $6.25<br />
7 $18.50 $6.00<br />
8 $17.25 C $5.75<br />
9 $16.00 D $29.25<br />
10 $147.50<br />
11 $13.50 $128.00<br />
12 E $135.00 -$1.50<br />
13 $11.00 $0.75<br />
Question 77<br />
Graph several isoquants associated with the production function: q = f(x 1 , x 2 ) = min{3x 1 , x 2 }. Given<br />
factor prices of w 1 <strong>and</strong> w 2 , what is the cost function<br />
Question 78<br />
Graph several isoquants associated with the production function: q = f(x 1 , x 2 ) = 2x 1 + 3x 2 . Given factor<br />
prices of w 1 <strong>and</strong> w 2 , what is the cost function<br />
14
Question 79<br />
What is the cost function associated with a production process that turns 5 units of x 1 <strong>and</strong> 0.25 units of x 2<br />
into 32 units of output, when the cost of each unit of x 1 is $25 <strong>and</strong> the cost of each unit of x 2 is $12.<br />
Question 80<br />
What is the cost function associated with a production process that repeatedly turns 2 units of x 1 <strong>and</strong> 5<br />
units of x 2 into 3 units of output, when each unit of x 1 costs $20 <strong>and</strong> each unit of x 2 costs $4<br />
Question 81<br />
Fisher Price can sell as many Little People Houses as it likes at a price of $27.99 each. If Fisher Price<br />
makes 100 houses, the average total cost of production is $20.25 per house. If Fisher Price makes 101<br />
houses, the average total cost of production is $20.34. Should Fisher Price make <strong>and</strong> sell the 101 st house<br />
Why or why not<br />
Question 82<br />
Joni drives a big yellow taxi in Chicago where she can charge a price of $1.25 per mile. She is willing to<br />
work 8 hours a day. During an 8 hour day, she will receive payment for driving a total of 300 miles. Her<br />
cost of operating her taxi is $0.25 per mile in gas, $0.40 per mile in general maintenance, <strong>and</strong> $50 in<br />
insurance each day. Joni has the option of working at McDonalds for 8 hours a day earning $5.15 per<br />
hour. She has no other employment options. What is Joni’s daily profit from driving a taxi cab<br />
Question 83<br />
A firm earns $10,000 profit from selling 200 units of output. The firm’s fixed costs are $12,000 <strong>and</strong> its<br />
average variable cost per unit sold is $13. At what price is each unit of output sold<br />
Question 84<br />
Analyze the validity of the following statement. A profit maximizing firm will remain open in the shortrun<br />
as long as it can recuperate its fixed costs.<br />
Question 85<br />
Suppose Ripon <strong>College</strong> is a price taker. Its fixed costs are $4 million per year. The marginal cost per<br />
student is $7,000 as long as the <strong>College</strong> enrolls 1300 or fewer students. The marginal cost is $12,000 per<br />
student for every student over 1300 that the college enrolls . How many students should Ripon <strong>College</strong><br />
enroll if it receives tuition of $11,000 from each student who enrolls<br />
Question 86<br />
The costs of recording <strong>and</strong> producing a music album’s master tape are quite large, say $5 million. Once<br />
the master tape is produced, the cost of actually producing each CD for sale is $2. We also observe CD<br />
prices falling over time. For example, when Mariah Carey released the album "Butterfly" in September<br />
of 1997, a CD sold for $17.99. A year <strong>and</strong> a half later, the same album could be bought for $12.88. If the<br />
marginal cost of producing a CD is always $2, why do we observe the price of the same CD falling over<br />
time Does this mean Mariah Carey is not profit maximizing<br />
Question 87<br />
The yearly production function for a profit-maximizing firm is q = f(L) = 100L, where L is the number of<br />
workers the firm hires each year. The price of output depends on how much is sold according to the<br />
following schedule: p(q) = 1000 − 0.25q. Each worker costs $40,000 for the year. How much labor<br />
should the firm hire to maximize profits How many units of output will be produced At what price<br />
will each unit of output sell How much profit will the firm earn<br />
15
Question 88<br />
Explain why a firm will never choose to produce at a quantity where its marginal revenue is negative.<br />
Question 89<br />
Consider a firm that employs labor <strong>and</strong> capital. Each unit of labor costs $15 <strong>and</strong> each unit of capital costs<br />
$5. The firm’s production function is q = f(K,L) = 0.5K 0.2 L 0.6 . Given this production function, the MRTS<br />
equals –3K / L.<br />
A. Does the production function exhibit decreasing, constant, or increasing returns to scale<br />
B. How many units of labor <strong>and</strong> capital should the firm employ if it wants to minimize the cost of<br />
making 128 units of output<br />
Question 90<br />
Suppose a firm faces a constant selling price of $3 <strong>and</strong> has a total costs of 2 + 4q.<br />
A. What are the algebraic expressions for the firm’s fixed cost, variable costs, <strong>and</strong> marginal costs<br />
B. What is the short-run profit maximizing action of the firm How much is produced How much<br />
profit does the firm earn in the short run<br />
C. As the firm goes to the long-run, what is the profit maximizing action of the firm How much is<br />
produced How much profit does the firm earn<br />
Question 91<br />
Bob’s Apple Orchard faces perfectly elastic dem<strong>and</strong> for apples at a price of $2 per bag. Let q represent<br />
the number of bags of apples produced <strong>and</strong> sold by Bob’s. Bob’s total cost for producing bags of apples<br />
is C(q) = 1000 + q + 0.0025q 2 . How many bags of apples should the orchard sell to maximize profits<br />
How much profit will the orchard earn<br />
Question 92<br />
Central Perk’s total cost of producing cups of coffee is C(q) = 2q + 0.01q 2 . Dem<strong>and</strong> for Central Perk<br />
coffee is p(q) = 10 – 0.015q. If Central Perk is a profit maximizing firm, how much coffee will it sell<br />
What price will it charge How much profit will it earn<br />
Question 93<br />
Al makes desks. The (inverse) dem<strong>and</strong> curve for Al’s desks is p(q) = 1000 − 10q. Al’s total costs of<br />
production are C(q) = 3,500 + 100q + 5q 2 . How many desks should Al make in order to maximize<br />
profits What price will he charge How much profit will he earn<br />
Question 94<br />
The (inverse) dem<strong>and</strong> curve for widgets is p(q) = 200 – 5q. Widgets are produced by a monopolist for<br />
which total costs are C(q) = 4q 2 – 16q + 24.<br />
A. What is the firm’s average total cost curve<br />
B. Assuming the monopolist maximizes her profits, how many widgets will the firm produce At what<br />
price does the monopolist sell widgets How much profit does the monopolist earn<br />
16
Question 95<br />
Suppose volleyballs are produced in a perfectly competitive market. In 2003, the market for volleyballs<br />
was in long-run equilibrium wherein the price of each volleyball was $5 <strong>and</strong> two million volleyballs were<br />
produced each year by forty firms producing 50,000 balls each. Then, Misty May <strong>and</strong> Kerri Walsh won<br />
the gold medal in women’s beach volleyball for the U.S.A. in the summer of 2004. As a result, volleyball<br />
became very popular throughout the country (<strong>and</strong> will continue to remain popular).<br />
A. What would you expect to happen to the price of volleyballs, total quantity of volleyballs sold, the<br />
number of volleyballs produced by each volleyball-making firm, <strong>and</strong> the number of volleyballmaking<br />
firms in the short run.<br />
B. What would you expect to happen to the price of volleyballs, total quantity of volleyballs sold, the<br />
number of volleyballs produced by each volleyball-making firm, <strong>and</strong> the number of volleyballmaking<br />
firms in the long run. Be as precise as possible.<br />
Question 96<br />
Suppose the market for milk is perfectly competitive <strong>and</strong>, given current technology, is in long-run<br />
equilibrium. Discuss in words <strong>and</strong> show with graphs what the effects would be if the Food <strong>and</strong> Drug<br />
Administration releases new evidence that drinking milk each day helps prevent getting sick. Be sure to<br />
comment on the effects the announcement will have in the short run <strong>and</strong> long run on (i) the quantity of<br />
milk produced by each farmer, (ii) the quantity of milk produced in the entire industry, (iii) the price of<br />
milk, (iv) each farmer’s profits, (v) entry <strong>and</strong>/or exit of firms, (vi) the market dem<strong>and</strong> curve, <strong>and</strong> (vii) firm<br />
cost curves.<br />
Question 97<br />
The market for fertilizer is perfectly competitive. Each bag of fertilizer sells at a price of $20. The total<br />
cost to Fred’s Fertilizing Factory of producing q bags of fertilizer is C(q) = 125 + 5q + 0.05q 2 . How<br />
many bags of fertilizer should Fred make in the short run to maximize profits How much profit does<br />
Fred earn How much profit will Fred earn in the long run<br />
Question 98<br />
Suppose beets are produced in a perfectly competitive industry. The price of each 10 pound bag of beets<br />
is $1.80. A typical farmer’s yearly cost function in dollars is C(q) = 180,000 + 0.3q + 0.000002q 2 where<br />
q is the number of ten- pound bags of beets the farmer produces during the year. Given this cost function,<br />
the marginal cost for each bag of beets is MC(q) = 0.30 + 0.000004q. For the current year, the farmer is<br />
in the short run.<br />
A. How many bags of beets should the farmer make during the year How much profit does the farmer<br />
earn for the year<br />
B. Suppose instead that the farmer’s fixed costs are $680,000. How many bags of beets should the<br />
farmer make during the year How much profit does the farmer earn for the year<br />
Question 99<br />
Alison makes chairs. Inverse dem<strong>and</strong> for Alison’s chairs is p = 800 − 15q where p is the price of a chair<br />
<strong>and</strong> q is the number of chairs sold. Alison’s total cost of producing q chairs is C(q) = 500 + 200q + 15q 2 .<br />
How many chairs will Alison make in the short run to maximize profits What price will she charge<br />
Question 100<br />
In 2007, the market for household robots is small <strong>and</strong> uncompetitive due to patents of new technologies.<br />
In the long run, however, patents will expire <strong>and</strong> it is likely that the market for household robots will be<br />
very competitive. At that time, people will eventually be able to purchase a robot that does all household<br />
chores – cooking, cleaning, washing clothes, etc. The cost of paying an actual person, not a robot, to do<br />
these for a household will be about $65,000 per year by the time the market for household robots is<br />
competitive. What do you expect the long-run cost of a household robot to be Why<br />
17
Question 101<br />
The market for apartments in <strong>Lake</strong> <strong>Forest</strong> is competitive. Dem<strong>and</strong> is captured by Q D = 430 – 0.05p while<br />
supply is captured by Q S = 0.15p – 110. Suppose the city of <strong>Lake</strong> <strong>Forest</strong> imposes a price ceiling of<br />
$1,200. Following the imposition of the price ceiling, how many apartments will be supplied How<br />
many apartments will be dem<strong>and</strong>ed By how much is producer surplus reduced due to the price ceiling<br />
Question 102<br />
Currently the yearly market dem<strong>and</strong> <strong>and</strong> supply for fire extinguishers are Q D = 18,000 – 200p <strong>and</strong><br />
Q S = 50p – 250 respectively.<br />
A. Solve for the competitive equilibrium. How much surplus do consumers <strong>and</strong> producers receive<br />
How much is total surplus<br />
B. In an attempt to get more fire extinguishers to be purchased each year, the government places a price<br />
ceiling of $35 on each extinguisher. How many fire extinguishers will be purchased when the price<br />
ceiling is in place Calculate consumer surplus, producer surplus, total surplus, <strong>and</strong> deadweight loss<br />
under the $35 price ceiling.<br />
C. Was the government successful in achieving its goal Can you suggest an intervention that would be<br />
more successful<br />
Question 103<br />
The inverse dem<strong>and</strong> curve for a gallon of milk can be expressed as p = 5 – 0.001Q D . Similarly, the<br />
inverse supply curve for a gallon of milk can be expressed as p = 2 + 0.002Q S .<br />
A. What is the competitive equilibrium How much surplus do consumers <strong>and</strong> producers receive<br />
B. Suppose the government imposes a price ceiling of $3.80 per gallon of milk. How large is the<br />
quantity surplus or quantity shortage associated with such a price ceiling<br />
C. What is the value of producer surplus under the price ceiling<br />
D. What is the value of consumer surplus under the price ceiling<br />
E. Compared to the competitive equilibrium, has the price ceiling collectively helped the (potential)<br />
consumers of milk<br />
F. Compared to the competitive equilibrium, has the price ceiling collectively helped the (potential)<br />
producers of milk<br />
Question 104<br />
Suppose industry dem<strong>and</strong> is Q = 50 – 0.20p. A patent gives a monopolist complete control of the<br />
industry. The monopolist’s costs are C(q) = 4q 2 + 16q + 221. How much should the monopolist produce<br />
to maximize her profits What price will she charge How much profit will the monopolist earn<br />
18
Question 105<br />
The graph below shows the industry dem<strong>and</strong> curve for computers. The marginal cost of producing a<br />
computer is $1,000 <strong>and</strong> there are no fixed costs of production.<br />
A. If Dell is the only computer manufacturer, at what price will Dell sell computers How many<br />
computers will it sell How much profit will Dell earn<br />
B. If computers are produced in a perfectly competitive industry, at what price will computers be<br />
sold How many computers will be sold in total How much profit will each firm earn<br />
C. What is the dollar value of the deadweight loss associated with monopoly versus a perfectly<br />
competitive<br />
Question 106<br />
Consider our classroom discussion of monopolies.<br />
A. Explain why monopoly is never consumer efficient.<br />
B. Explain why a natural monopoly is producer efficient.<br />
C. If the government gives a natural monopolist (such as ComEd) a monopoly franchise, why doesn’t<br />
the government require that the firm sell the good at its marginal cost of production so that the market<br />
is consumer efficient<br />
Question 107<br />
A monopolist faces inverse dem<strong>and</strong> of p = 40 – 0.025q <strong>and</strong> total costs of C(q) = 150 + 2q + 0.05q 2 so that<br />
its marginal cost curve is MC(q) = 2 + 0.1q. How many units of output will the monopolist produce to<br />
maximize its profit What price does the monopolist charge How much profit is earned<br />
Question 108<br />
The <strong>Lake</strong> <strong>Forest</strong> Water Company (LFWC) is a natural monopoly. It has fixed costs of $2 million per<br />
week. Its marginal cost of refining <strong>and</strong> distributing 100 gallons of water is $25. Weekly dem<strong>and</strong> for<br />
household tap water in <strong>Lake</strong> <strong>Forest</strong> can be written as p = 100 – 0.0005q where q is each 100 gallons of<br />
water.<br />
A. What price will LFWC set for a gallon of water How many gallons of water will LFWC provide<br />
each week How much profit will LFWC earn each week<br />
B. Compared to a competitive water market in which price would equal marginal cost, how much<br />
inefficiency is created by LFWC’s monopoly power<br />
19
Question 109<br />
Consider a two-player game. The normal form of the game is listed below, with player one’s payoffs<br />
listed first. Both players act to maximize their payoffs.<br />
Player<br />
One<br />
Player Two<br />
C1 C2 C3 C4 C5<br />
R1 ( 2 , 2 ) ( 2 , 3 ) ( 3 , 1 ) ( 6 , 5 ) ( 4 , 3 )<br />
R2 ( 1 , 3 ) ( 1 , 1 ) ( 2 , 1 ) ( 3 , 4 ) ( 5 , 6 )<br />
R3 ( 7 , 5 ) ( 4 , 8 ) ( 3 , 9 ) ( 2 , 3 ) ( 3 , 3 )<br />
R4 ( 8 , 4 ) ( 6, 6 ) ( 4 , 8 ) ( 2 , 2 ) ( 1 , 2 )<br />
R5 ( 9 , 3 ) ( 8 , 4 ) ( 5, 7 ) ( 1 , 2 ) ( 3 , 3 )<br />
A. What are all of the pure strategy Nash Equilibria to the game<br />
B. What are all of the Pareto efficient outcomes to the game<br />
C. Suppose Player One chooses her action first. Player Two then chooses her action after seeing what<br />
Player One has done. What is the likely outcome to this game<br />
Question 110<br />
Consider the following two player game. Player One’s available strategies are Top <strong>and</strong> Bottom. Player<br />
Two’s available strategies are Left, Middle, <strong>and</strong> Right. As ususal, Player One’s payoffs are listed first.<br />
Player One<br />
Player Two<br />
Left Middle Right<br />
Top 2 , 50 5 , 20 4 , 10<br />
Bottom 10 , 10 2 , 4 10 , 5<br />
A. What is a Nash Equilibrium if both players choose their actions simultaneously<br />
B. If Player One chooses her action after seeing Player Two’s action, what is an equilibrium to the<br />
game<br />
C. What are the Pareto Optimal outcomes of the game<br />
Question 111<br />
Consider the following normal form game.<br />
Player 1<br />
Player 2<br />
Left Right<br />
Top 10 , 10 12 , 8<br />
Bottom 8 , 12 α , α<br />
What values for α would make the above game a Prisoners Dilemma<br />
20
Question 112<br />
Find all pure-strategy Nash equilibrium to the simultaneous move game with the following normal form<br />
representation..<br />
Player 1<br />
Player 2<br />
V W X Y Z<br />
A 9 , 4 3 ,5 0 , 1 9 , 1 7 , 6<br />
B 2 , 6 4 , 6 7 , 0 2 , 3 3 , 3<br />
C 4 , 4 1 , 4 4 , 7 7 , 6 6 , 6<br />
D 3 , 8 2 , 8 8 , 5 4 , 6 5 , 5<br />
E 7 , 7 4 , 2 8 , 9 8 , 5 3 , 8<br />
Question 113<br />
For each of the eight characteristics of industry structures given below, list whether it is associated with<br />
Perfect Competition, Monopoly, <strong>and</strong>/or Monopolistic Competition. Write Y if the characteristic is<br />
associated with the industry structure. Write N if the characteristic is not associated with the industry<br />
structure. Fill in all 24 boxes.<br />
Profits are zero in the long run.<br />
The industry is consumer efficient in the long run.<br />
The industry is consumer efficient in the short run.<br />
Supply curves are essentially marginal cost curves.<br />
Entry into the industry is prohibited in the short run.<br />
Entry into the industry is prohibited in the long run.<br />
Each firm faces a downward sloped dem<strong>and</strong> curve.<br />
A firm might find it profitable to advertise its product.<br />
Perfect<br />
Competition<br />
Monopoly<br />
Monopolistic<br />
Competition<br />
Question 114<br />
Suppose that the marginal cost of mining gold is $500 per pound (there are no fixed costs), <strong>and</strong> the<br />
dem<strong>and</strong> for gold is described by the schedule below.<br />
Price: $300 $400 $500 $600 $700 $800 $900 $1,000<br />
Quantity: 5,000 4,400 3,800 3,200 2,600 2,000 1,400 800<br />
A. If there are many suppliers of gold, what would be the market price of gold <strong>and</strong> how many pounds of<br />
gold would be sold<br />
B. If there was only one supplier of gold, what would be the market price, quantity sold, <strong>and</strong> profit<br />
C. If there are only two countries that successfully form a cartel <strong>and</strong> split production evenly, what would<br />
be the market price of gold, how many pounds of gold does each country mine, <strong>and</strong> what is each<br />
country’s profit<br />
D. Show that both countries in part C have an incentive to cheat on the cartel’s collusive agreement.<br />
21
Question 115<br />
General observation suggests two empirical facts: (1) Pepsi <strong>and</strong> Coke dominate the soft drink industry,<br />
<strong>and</strong> (2) Pepsi <strong>and</strong> Coke products are sold essentially at the same price. True, there are sale prices, but<br />
Pepsi’s best sale price is the same as Coke’s best sale price, <strong>and</strong> both companies offer their best sale price<br />
frequently.<br />
A. Given these facts, the predictions from economic theory suggest that Pepsi <strong>and</strong> Coke could be a<br />
Cartel, engaged in Bertr<strong>and</strong> competition, or engaged in Cournot competition. Explain why all three<br />
market structures are possible given the facts above.<br />
B. How might you, as an economist for the Federal Trade Commission, go about determining which of<br />
the three forms of oligopoly best describes the competitive practices between Coke <strong>and</strong> Pepsi<br />
Question 116<br />
The daily global market for oil is described by p = 160 – 0.25Q where Q is total industry output (in<br />
millions of barrels) <strong>and</strong> p is the price of each barrel. The marginal cost of producing a barrel of oil is $10<br />
in all countries. Suppose all oil producing countries are members of OPEC. OPEC decides to limit<br />
production to 300 million barrels per day, which maximizes joint profits for OPEC. Under this limitation,<br />
OPEC agrees that Mexico will produce 5 million barrels each day.<br />
A. What is Mexico’s daily variable profit from oil if it <strong>and</strong> all OPEC countries abide by the agreement<br />
B. Show that Mexico could increase its daily profit by cheating on the agreement.<br />
C. Suppose OPEC is successful in limiting daily supply to 300 million barrels. How much deadweight<br />
loss arises because of this policy in comparison to the perfectly competitive market that would exist<br />
in the absence of OPEC<br />
Question 117<br />
Graph a market with a negative consumption externality but no production externality. Label the private<br />
dem<strong>and</strong> <strong>and</strong> supply curves <strong>and</strong> the social dem<strong>and</strong> <strong>and</strong> supply curves. Indicate how much quantity is<br />
produced under the private outcome. Indicate how much quantity is produced under the socially efficient<br />
outcome. Indicate the dead weight loss associated with the externality.<br />
Question 118<br />
Most museums receive public funds to offset some of their expenses.<br />
A. Are museums public goods<br />
B. Whether or not museums are public goods, governments may want to subsidize museums for other<br />
economic reasons. Why<br />
Question 119<br />
The table below lists the amount of pollution each of 4 firms emits during production. The table also lists<br />
each firm’s cost of cleaning up each unit of its own pollution. The government wants to limit pollution to<br />
200 units. Thus, each firm is given 50 tradable permits, <strong>and</strong> each permit allows the firm to emit 1 unit of<br />
pollution without cleaning it up. Firms are required to pay to clean up all of its pollution for which it does<br />
not have a permit. Assuming that firms do not respond to regulation by producing less output (<strong>and</strong> thus<br />
pollute less), fill-in the remainder of the table. At what price do permits trade<br />
Firms: A B C D<br />
Pre-Regulation Units of Pollution: 100 75 200 100<br />
Cost of Cleaning Up Each Unit of Pollution: $25 $100 $50 $75<br />
Permits Given: 50 50 50 50<br />
Permits Bought:<br />
Permits Sold:<br />
Total Permits Held After Trading:<br />
22
PRACTICE QUESTIONS TEST ONE<br />
Question 1<br />
The cost of a daily pass to Disneyl<strong>and</strong> is $40. At this price, Disneyl<strong>and</strong>’s total monthly revenue is $8<br />
million. Disneyl<strong>and</strong> decides to cut prices one month to $30 per pass. During that month, 220,000 people<br />
visited Disneyl<strong>and</strong>.<br />
A. Approximately what is the elasticity of dem<strong>and</strong> for Disneyl<strong>and</strong><br />
B. Would you advise Disneyl<strong>and</strong> to keep its price at $30 per person or return its price to $40 per person<br />
C. Why might these numbers be a bit misleading when making long-term projections<br />
Question 2<br />
What is your best estimate of the elasticity of dem<strong>and</strong> for ice cream cones What is your best estimate of<br />
the elasticity of dem<strong>and</strong> for Dairy Queen ice cream cones Explain both answers in terms of their relation<br />
to each another.<br />
Question 3<br />
Consider the market for air travel. Recently, Northwest Airlines <strong>and</strong> Delta Airlines both filed for Chapter<br />
11 bankruptcy. Chapter 11 bankruptcy allows these firms to reorganize their debt structure, financial<br />
obligations, <strong>and</strong> labor contracts to the firms’ advantage, while allowing the firms to continue to operate.<br />
A. What effect does the option of Chapter 11 bankruptcy have on the equilibrium price <strong>and</strong> quantity of<br />
air travel<br />
B. In contrast to Chapter 11 bankruptcy, the firm is actually dissolved under Chapter 7 bankruptcy.<br />
Comment on the different effects Chapter 7 bankruptcy would have on the market for air travel in<br />
contrast to Chapter 11 bankruptcy.<br />
C. If the problem with the airline industry is that prices are too low due to over-capacity, which<br />
bankruptcy law, Chapter 11 or Chapter 7, would be better for the industry in the long run<br />
Question 4<br />
Due to an increased frequency of malpractice law suits, doctors are paying higher premiums for<br />
malpractice insurance. What effect will this have on the cost <strong>and</strong> availability of medical services Draw<br />
a graph to illustrate your answer.<br />
Question 5<br />
Cable service costs $50 per month, <strong>and</strong> almost every household buys cable. Comcast is the only cable<br />
provider <strong>and</strong> earns huge profits each year. <strong>Lake</strong> County decides to impose a $5 per month excise tax on<br />
cable service. After the tax is imposed, almost all households continue their service, <strong>and</strong> the government<br />
collects $4 million in taxes each month. True or False: The profits Comcast receives for operating in<br />
<strong>Lake</strong> county will fall by roughly $4 million.<br />
Question 6<br />
Suppose the market for DVD movies can be described by p = 40 – 0.5Q D <strong>and</strong> p = 10 + 2Q S .<br />
A. What is the equilibrium<br />
B. What are the elasticity of supply <strong>and</strong> elasticity of dem<strong>and</strong> at the equilibrium<br />
C. Suppose the government levies a $5 tax on every DVD sold. What is the new price consumers pay<br />
for a DVD What price (net of taxes) do firms receive for each DVD How much tax revenue does<br />
the government receive<br />
D. What percent of the $5 tax is paid by consumers What percent is paid by firms<br />
23
Question 7<br />
The monthly dem<strong>and</strong> for pizza is Q D = 900 – 50p <strong>and</strong> the monthly supply of pizzas is Q S = 100p – 300<br />
where p is the price of each pizza.<br />
A. Solve for the inverse dem<strong>and</strong> <strong>and</strong> inverse supply equations.<br />
B. Solve for the market equilibrium.<br />
C. What is the elasticity of dem<strong>and</strong> <strong>and</strong> elasticity of supply at the market equilibrium<br />
D. What price would consumers pay if the government imposes a $3 tax on each pizza sold<br />
E. What percentage of the $3 per pizza tax do firms pay<br />
F. How much revenue does the government receive from a $3 excise tax<br />
Question 8<br />
Provide accurate <strong>and</strong> complete mathematical definitions of the following properties regularly assumed<br />
about preferences: completeness, convexity, monotonicity, <strong>and</strong> transitivity.<br />
Question 9<br />
Consider the preference ordering captured by the “thick” indifference curves below. Which of our four<br />
assumptions – completeness, transitivity, monotonicity, <strong>and</strong> diminishing returns – are violated by thick<br />
indifference curves (Thick indifference curves, unlike well-behaved indifference curves, have a<br />
thickness or width, so geometrically they are not officially lines.)<br />
Good 2<br />
Thick Indifference Curves<br />
Good 1<br />
Question 10<br />
Suppose Tom’s preferences for two goods can be described as perfect substitutes whereby Tom is always<br />
indifferent between consuming 3 units of good one or 5 units of good two. Provide a utility function<br />
representation of Tom’s preferences.<br />
Question 11<br />
Suppose Sean has $48. Each beer costs $2 <strong>and</strong> each pizza costs $8.<br />
A. Draw Sean’s budget line, label it BL 1 . Label the intercepts. What is the slope of BL 1 <br />
B. Suppose the price of beer increases to $4 each. Draw Sean’s new budget line, label it BL 2 .<br />
24
PRACTICE QUESTIONS FOR TEST TWO<br />
Question 1<br />
Olivia views cookies <strong>and</strong> bags of fish crackers as perfect substitutes in a 3:1 ratio. That is, 3 cookies give<br />
her the same utility as 1 bag of fish crackers.<br />
A. Graph some of Olivia’s indifference curves. (Put cookies on the x-axis <strong>and</strong> fish crackers on the y-<br />
axis.)<br />
B. What is Olivia’s marginal rate of substitution when consuming 10 cookies <strong>and</strong> 2 bags of crackers<br />
What is her marginal rate of substitution when consuming 2 cookies <strong>and</strong> 10 bags of crackers<br />
C. Suppose Olivia has $5 to spend on these goods. Each cookie costs $0.20, while each bag of crackers<br />
costs $0.75. How many of each good should she buy to maximize her utility<br />
D. Let Y represent Olivia’s budget, p 1 represent the price of each cookie, <strong>and</strong> p 2 represent the price of<br />
each bag of crackers. In terms of these three variables, what is Olivia’s optimal consumption bundle<br />
Question 2<br />
Nathan views boxes of milk <strong>and</strong> cookies as perfect complements in a 1:4 ratio. That is, Nathan always<br />
drinks 1 box of milk with every 4 cookies that he eats (<strong>and</strong> vice versa).<br />
A. Graph some of Nathan’s indifference curves. (Put milk on the x-axis <strong>and</strong> cookies on the y-axis.)<br />
B. What is Nathan’s marginal rate of substitution when consuming 10 boxes of milks <strong>and</strong> 2 cookies<br />
What is his marginal rate of substitution when consuming 2 boxes of milk <strong>and</strong> 10 cookies<br />
C. Suppose Nathan has $5 to spend on these goods. Each box of milk costs $0.80, while each cookie<br />
costs $0.05. How many of each good should he buy to maximize his utility<br />
D. Let Y represent Nathan’s budget, p 1 represent the price of each box of milk, <strong>and</strong> p 2 represent the price<br />
of each cookie. In terms of these three variables, what is Nathan’s optimal consumption bundle<br />
Question 3<br />
Suppose preferences for x 1 <strong>and</strong> x 2 can be represented as: U(x 1 ,x 2 ) = 5x 1 12 x 2 24 .<br />
A. Using a monotonic transformation, U(x 1 ,x 2 ) can be transformed into V(x 1 ,x 2 ) = x 1 α x 2<br />
1– α . What is the<br />
value of α<br />
B. Suppose the budget is $1,200, the price of x 1 is $50, <strong>and</strong> the price of x 2 is $80. What is the optimal<br />
consumption bundle<br />
C. Use the transformed utility function to calculate the marginal utility of x 1 , the marginal utility of x 2 ,<br />
the marginal rate of substitution, <strong>and</strong> the marginal rate of transformation at the optimal consumption<br />
bundle.<br />
Question 4<br />
Consider a two-good, fixed price economy. The two goods are bread <strong>and</strong> cheese. Everybody has a<br />
budget of $50. The price of a loaf of bread is $1.25. The price of a pound of cheese is $4.<br />
A. Ann has Cobb-Douglas preferences for bread <strong>and</strong> cheese in which she associates a 70% income share<br />
to bread <strong>and</strong> a 30% income share to cheese. How much bread <strong>and</strong> cheese does Ann purchase with her<br />
$50<br />
B. Bryan is indifferent between eating bread <strong>and</strong> cheese. In particular, he always receives the same<br />
utility from eating 2 loaves of bread as he does from eating 1 pound of cheese. How much bread <strong>and</strong><br />
cheese does Bryan purchase with his $50<br />
C. Cathy always consumes one half pound of cheese with four tenths of a loaf of bread. Any bread or<br />
cheese consumed in addition to this proportion gives Cathy no utility. How much bread <strong>and</strong> cheese<br />
does Cathy purchase with her $50<br />
25
Question 5<br />
Shelly has well-behaved preferences. Her budget allows her to afford exactly 30 tablets of cold medicine<br />
(x-axis) <strong>and</strong> 7 boxes of Kleenex (y-axis). At this bundle, however, the slope of her budget line is -0.25<br />
while her MRS for cold tablets is -0.20. Should Shelly purchase more than 30, exactly 30, or less than 30<br />
tablets of cold medicine<br />
Question 6<br />
Karen’s preferences for butterscotch chips (b) <strong>and</strong> chocolate chips (c) can be expressed as u(b,c) = 5b 2 c 3 .<br />
The price of each chip is 5¢ for butterscotch <strong>and</strong> 8¢ for chocolate. Karen has $12 to spend on chips.<br />
A. Draw Karen’s budget line. (Put butterscotch chips on the x-axis.)<br />
B. If Karen buys 80 butterscotch chips, how many chocolate chips can she afford<br />
C. What is the marginal rate of transformation for butterscotch chips<br />
D. What is the marginal rate of substitution for butterscotch chips if Karen consumes 100 butterscotch<br />
chips <strong>and</strong> 100 chocolate chips<br />
E. What is Karen’s optimal consumption bundle What is Karen’s marginal rate of substitution for<br />
butterscotch chips at her optimal consumption bundle<br />
Question 7<br />
Suppose Richard always consumes shoes <strong>and</strong> suits in a fixed 2:5 proportion. That is, he always buys two<br />
pairs of shoes with five suits.<br />
A. Draw some of Richard’s indifference curves. (Put shoes on the x-axis.)<br />
B. What is Richard’s MRS for shoes when consuming 8 pairs of shoes <strong>and</strong> 5 suits<br />
C. What is Richard’s MRS for shoes when consuming 5 pairs of shoes <strong>and</strong> 8 suits<br />
For parts D – F, assume that the price of each pair of shoes is $50 <strong>and</strong> the price of each suit is $180.<br />
D. Graph Richard’s budget line when he has $9,000 to spend.<br />
E. Solve for Richard’s optimal consumption bundle given his $9,000 budget.<br />
F. Solve for <strong>and</strong> graph Richard’s Engle curve for shoes. Let Y denote Richard’s budget.<br />
Question 8<br />
Toll ways are roads that people need to pay to use. Suppose that workers who commute to work by<br />
driving on the toll way are charged $1.50 each day. Of course, commuters can choose to use alternative<br />
routes that are not toll ways for free, but these routes may increase commute time.<br />
A. One senator proposes increasing the toll charge to $3 per day. He claims that the higher toll charge<br />
will result in greater tax revenue. A different senator, however, is opposed to the higher toll. She<br />
claims that the higher toll will lead to fewer people using the toll way, <strong>and</strong> ultimately lead to less, not<br />
more, tax revenue. Are both of these arguments plausible If not, why not If yes, explain what<br />
factors will determine which scenario comes about<br />
B. In a compromise, the daily toll on commuters is raised from $1.50 to $2.25. In order to learn more<br />
about the effect of the toll on driving patterns, the state hires a few economists from Knox <strong>College</strong> to<br />
analyze the data. The economists define poor commuters to be those earning less than $50,000 per<br />
year <strong>and</strong> rich commuters to be those earning more than $50,000 per year. According to this<br />
classification, 80% of all workers are poor <strong>and</strong> 20% are wealthy. Before the toll increase, 32% of<br />
poor commuters <strong>and</strong> 63% of wealthy commuters used the toll way. After the toll was increased to<br />
$2.25 per day, 18% of poor commuters <strong>and</strong> 68% of wealthy commuters used the toll way. The<br />
economists concluded that toll ways are normal goods for poor commuters as this group used toll<br />
ways less after the price increased, but that toll ways are Giffen goods for wealthy commuters as this<br />
group used toll ways more after the price increased. Are the economists from Knox <strong>College</strong> correct<br />
in their assessment that toll ways are Giffen goods for wealthy commuters If yes, explain what must<br />
be happening in terms of the substitution <strong>and</strong> income effects for poor vs. wealthy commuters. If the<br />
economists from Knox <strong>College</strong> are wrong, what part of the model or data are they misinterpreting or<br />
considering incorrectly<br />
26
Question 9<br />
Suppose beer <strong>and</strong> slices of pizza are perfect complements in a 2:5 ratio so that 2 beers are always<br />
consumed with 5 slices of pizza.<br />
A. Assuming the budget is $20 <strong>and</strong> the price of each slice of pizza is $2, derive the dem<strong>and</strong> curve for<br />
beer.<br />
B. Assuming the price of each beer is $5 <strong>and</strong> the price of each slice of pizza is $2, derive the Engel curve<br />
for beer.<br />
Question 10<br />
A. Explain the substitution effect.<br />
B. Explain the income effect.<br />
C. When leisure is a normal good, explain why the income effect goes against the substitution effect.<br />
D. Demonstrate using budget lines <strong>and</strong> indifference curves <strong>and</strong> explain in terms of income <strong>and</strong><br />
substitution effects the change in quantity dem<strong>and</strong>ed for a normal good when its price increases.<br />
E. Demonstrate using budget lines <strong>and</strong> indifference curves <strong>and</strong> explain in terms of income <strong>and</strong><br />
substitution effects the change in quantity dem<strong>and</strong>ed for a Giffen good when its price decreases.<br />
Question 11<br />
In a st<strong>and</strong>ard two-good economy, if good one is normal <strong>and</strong> good two is inferior, is it true that the two<br />
goods must then behave like substitutes when the price of good one falls<br />
Question 12<br />
Consider a consumer model of optimal choice using two normal goods – education <strong>and</strong> consumption.<br />
Each credit hour of education costs p E . Presently p E = $5,000. Each person, however, can apply for<br />
government aid based on his or her financial situation. He or she will then receive a per-credit<br />
government subsidy of between $0 <strong>and</strong> $5,000. Thus, someone who receives no subsidy continues to pay<br />
$5,000 per credit, while education is free for someone who receives a per-credit subsidy of $5,000. The<br />
more typical case, however, is between these two extremes. For example, someone who receives a<br />
$1,200 per-credit subsidy would have to pay $3,800 per education credit.<br />
A. Using income <strong>and</strong> substitution effects, show intuitively that the optimal amount of education<br />
increases (or at least does not decrease) as the government subsidy increases. Recall that both goods<br />
are normal.<br />
B. When is it likely (or for whom is it likely) that an increase in the subsidy for which an individual is<br />
eligible will not affect the amount of education purchased<br />
C. Consider the following two empirical facts.<br />
i. Children from wealthier households are much more likely to purchase more education,<br />
especially a college education, than children from poorer households.<br />
ii. Children from poorer households will receive a much higher education subsidy than<br />
children from wealthier households.<br />
Your answer in part A should have concluded that someone is more likely to purchase more<br />
education when his or her subsidy increases. Given this prediction, how is it that children of<br />
wealthier households actually purchase more education than children of poorer households even<br />
though the children from poorer households are eligible for larger subsidies<br />
27
Question 13<br />
Consider a two-good consumer model where the goods are consumption today (C 0 ) <strong>and</strong> consumption<br />
tomorrow (C 1 ). The consumer is given Y 0 dollars of income today. The selling price of each unit of<br />
consumption is $1 in each time period. The consumer can invest any savings, S, from today until<br />
tomorrow at a guaranteed interest rate, i, so that her income tomorrow, Y 1 , equals (1+i)S. Assume<br />
throughout that C 0 is inferior while C 1 is a normal good.<br />
A. Mathematically, how does S relate to C 0 <strong>and</strong> Y 0 <br />
B. Graph the consumer’s budget line with tomorrow’s consumption on the x-axis <strong>and</strong> today’s<br />
consumption on the y-axis. Label this budget line BL 1 .<br />
C. What is the slope of BL 1 Mark a point A on BL 1 <strong>and</strong> draw an indifference curve (label it IC 1 ) that<br />
indicates that A is the consumer’s optimal consumption bundle given BL 1 .<br />
D. Suppose the government increases the interest rate by lowering the capital gains tax rate. Graph the<br />
consumer’s new budget line (label it BL 2 ). What is the slope of BL 2 Mark a point B on BL 2 <strong>and</strong><br />
draw an indifference curve (label it IC 2 ) that indicates that C is the consumer’s optimal consumption<br />
bundle given BL 2 . (Keep in mind that C 0 is inferior <strong>and</strong> C 1 is normal.)<br />
E. When the interest rate increases, how do C 0 , C 1 , S, <strong>and</strong> the consumer’s utility change That is, for<br />
each of these 4 items, can you say for certain if they increase or decrease Keep in mind that C 0 is<br />
inferior <strong>and</strong> C 1 is normal.<br />
28
PRACTICE QUESTIONS FOR EXAM THREE<br />
Question 1<br />
A firm’s total cost function written in units of output, q, is: C(q) = 4q 2 + 2q + 2500.<br />
A. Algebraically solve for the firm’s variable cost curve, fixed costs, average total cost curve, average<br />
variable cost curve, average fixed cost curve, <strong>and</strong> marginal cost curve.<br />
B. Graph the firm’s average total costs, average variable costs, <strong>and</strong> marginal costs on the same graph.<br />
Question 2<br />
Consider the cost function: C(q) = 30 + 50q. What are the algebraic expressions for F, VC(q), AFC(q),<br />
AVC(q), AC(q), <strong>and</strong> MC(q)<br />
Question 3<br />
Provide values for boxes A – H in the table below.<br />
Quantity Price<br />
Total<br />
Revenue<br />
Total<br />
Cost Profit<br />
Marginal<br />
Cost<br />
Marginal<br />
Revenue<br />
0 --------- --------- $50.00 -$50.00 --------- ---------<br />
1 $25.00 $25.00 $60.00 -$35.00 $10.00 $25.00<br />
2 $24.00 $48.00 $69.00 -$21.00 $9.00 $23.00<br />
3 $23.00 B<br />
4 A $4.00 $19.00<br />
5 C<br />
6 $118.50 $96.75 $6.25<br />
7 $18.50 $6.00<br />
8 $17.25 D $5.75<br />
9 $16.00 E $29.25<br />
10 $147.50<br />
11 $13.50 $128.00<br />
12 F $135.00 -$1.50<br />
13 $11.00 G $0.75 H<br />
Question 4<br />
Graph several isoquants associated with the production function: q = f(x 1 , x 2 ) = min{5x 1 , 4x 2 }. Given<br />
factor prices of w 1 <strong>and</strong> w 2 , what is the cost function<br />
Question 5<br />
Below are six economic concepts (i – vi) that can all be graphed <strong>and</strong> eight possible descriptions (A – H).<br />
Associate with each concept all descriptions that apply to that concept. Each description can be used<br />
more than once or not at all, <strong>and</strong> a concept may be associated with more than one description.<br />
Concepts<br />
Descriptions<br />
i. Isoquants A. Typically graphed with labor on the x-axis <strong>and</strong> capital on the y-axis.<br />
ii. Isocost Lines<br />
B. Constant slope in the typical case.<br />
iii. Marginal Product of Labor C. Has a zero slope when profits are maximized.<br />
iv. SR Total Costs<br />
D. Usually graphed with quantity on the x-axis <strong>and</strong> dollars on the y-axis.<br />
v. SR Average Variable Costs E. Negatively sloped in the typical case.<br />
vi. SR Average Fixed Costs F. Assumes at least one factor of production is being held fixed.<br />
G. Positively sloped in the typical case.<br />
H. Can be used to determine when labor exhibits diminishing returns.<br />
29
Question 6<br />
Graph several isoquants associated with the production function: q = f(x 1 x 2 ) = min { 3x 1 , 2x 2 }. Given<br />
competitive factor markets that yield factor prices of w 1 = $12 <strong>and</strong> w 2 = $30, what is the cost function<br />
Question 7<br />
Andrea currently owns a piano for her own playing enjoyment. She also works 15 hours a week at the<br />
Kaplan tutoring center earning $15 per hour. She only works at Kaplan during the school year, which is<br />
36 weeks long. She is considering quitting Kaplan <strong>and</strong> teaching piano lessons instead. If she gave piano<br />
lessons, she would need to pay $10 each week to get the piano tuned. Andrea could quit Kaplan <strong>and</strong><br />
teach piano lessons after school every day for 3 hours, Monday through Friday. She would do this for the<br />
same 36 week stretch <strong>and</strong> receive $20 per hour from her piano students. What is the dollar value of the<br />
yearly economic profit Andrea gains by quitting Kaplan <strong>and</strong> teaching piano lessons<br />
Question 8<br />
A firm employs capital <strong>and</strong> labor to produce its product. Suppose factor prices are $12.50 per unit of<br />
labor <strong>and</strong> $50 per unit of capital. Currently the firm employs an optimal amount of capital <strong>and</strong> labor to<br />
make 24,000 units of output as cheaply as possible. Given this optimal bundle of factor inputs, the<br />
marginal product of labor is 30 units of output <strong>and</strong> the average product of labor is 40 units of output.<br />
What is the marginal product of capital<br />
Question 9<br />
A firm uses capital, K, <strong>and</strong> labor, L, in it production process, both of which the firm purchases from<br />
competitive factor markets. The firm also sells its output, q, in a competitive product market. Presently,<br />
the price of capital is $50 per unit, the price of labor is $10 per unit, <strong>and</strong> the firm can sell each unit of<br />
output for $20. The firm’s production function is described by q = f(K,L) = min{20K, L}, <strong>and</strong> the firm is<br />
required to produce 2,000 units of output. How much capital does the firm purchase How much labor<br />
does the firm purchase How much output does the firm produce How much profit does the firm earn<br />
Question 10<br />
A firm uses capital, K, <strong>and</strong> labor, L, in it production process, both of which the firm purchases from<br />
competitive factor markets. The firm also sells its output, q, in a competitive product market. Presently,<br />
the price of capital is $50 per unit, the price of labor is $10 per unit, <strong>and</strong> the firm can sell each unit of<br />
output for $20. The firm’s production function is described by q = f(K,L) = 20K + L, <strong>and</strong> the firm is<br />
required to produce 1,000 units of output. How much capital does the firm purchase How much labor<br />
does the firm purchase How much output does the firm produce How much profit does the firm earn<br />
Question 11<br />
Consider a firm that employs labor (L) <strong>and</strong> capital (K) to make output (q). Each unit of labor costs $10<br />
<strong>and</strong> each unit of capital costs $2. The firm’s production function is q = KL. Given this production<br />
function, the firm’s marginal rate of technical substitution for any factor input bundle is MRTS = –K / L.<br />
A. Does the production function exhibit diminishing marginal returns to labor<br />
B. Does the production function exhibit decreasing, constant, or increasing returns to scale<br />
C. Draw the firm’s isoquant associated with q = 180.<br />
D. How many units of labor <strong>and</strong> capital should the firm employ if it wants to minimize the cost of<br />
making 180 units of output<br />
E. Draw the firm’s isocost curve associated with spending $120 on factor inputs.<br />
30
Question 12<br />
Parrot Jungle, a tourist attraction in Miami, is a monopolistically competitive firm. Daily dem<strong>and</strong> for<br />
Parrot Jungle is p = 36 − 0.05q where p is the price of admission <strong>and</strong> q is the number of people admitted.<br />
Parrot Jungle’s daily total costs are C(q) = 5,000 + 0.01q 2 . What price should Parrot Jungle set to<br />
maximize profits How many people visit Parrot Jungle each day What are Parrot Jungle’s daily<br />
profits<br />
Question 13<br />
ABC Records has paid the fixed capital cost of $500,000 associated with having Joni Mitchell record her<br />
next album. Burning, packaging, <strong>and</strong> shipping each CD costs ABC Records $2. ABC has a contract with<br />
Joni Mitchell whereby ABC pays Mitchell $3 for every CD it sells. Finally, ABC must pay an<br />
entertainment tax of $1 for each CD it sells.<br />
A. Specify ABC’s total cost function. What is ABC’s marginal cost curve<br />
B. Suppose dem<strong>and</strong> for the Mitchell CD can be expressed as p = 30 – 0.00005q. How many CDs will<br />
ABC sell in order to maximize its profit At what price will each CD sell How much profit will<br />
ABC earn from the CD How much income does Mitchell receive from the CD<br />
C. Is the contract between Mitchell <strong>and</strong> ABC records efficient That is, could you write a contract so<br />
that Mitchell <strong>and</strong> ABC both earn more than they did in part B If not, why not If yes, specify one<br />
such contract.<br />
Question 14<br />
Annie’s Pear Orchard can sell as many pears as it likes at a price of $8.63 per bushel. Each week, Annie<br />
spends $500 on rent <strong>and</strong> other necessary maintenance items that are out of her control. Annie also incurs<br />
variable costs of production according to VC(q) = 0.13q + 0.005q 2 .<br />
A. Algebraically solve for C(q), AC(q), AVC(q), <strong>and</strong> MC(q)<br />
B. Graph MC(q), AC(q), <strong>and</strong> AVC(q) as accurately as possible on the same graph.<br />
C. How many pounds of pears should Annie make each week to maximize her profits How much profit<br />
does Annie earn each week<br />
D. Instead of a price of $8.63 per bushel, suppose Annie faces a price of $1.43 per bushel. How many<br />
pounds of pears (if any) should Annie make each week to maximize her profits How much profit<br />
does Annie earn each week<br />
Question 15<br />
Suppose wheat is produced in a perfectly competitive market. Currently farmers are making zero<br />
economic profits. Then dem<strong>and</strong> for wheat shifts out due to a severe corn shortage. Describe what<br />
happens in the wheat market in the short run. Describe what happens in the wheat market in the long run.<br />
Include in your analysis comments at the industry <strong>and</strong> firm level on price, quantity, <strong>and</strong> profits.<br />
Question 16<br />
Suppose the market for calculators is perfectly competitive. The current price for a calculator is $12.<br />
Texas Instruments’ (TI) weekly total cost function is C(q) = 2500 + 2q + 0.1q 2 , where q is the number of<br />
calculators it makes in a week. Given this cost function, TI’s marginal cost function is MC(q) = 2 + 0.2q.<br />
A. How many calculators should TI make in a week to maximize its profits How much profit does it<br />
earn for the week<br />
B. Suppose TI’s weekly fixed cost did not equal $2,500. At what level of fixed costs would TI earn<br />
weekly profit of $0<br />
C. Suppose TI’s weekly fixed cost did not equal $2,500. At what level of fixed costs would TI choose to<br />
shutdown in the short run<br />
31
Question 17<br />
Oliver receives a constant price of $20 for each broom that he makes <strong>and</strong> sells. He can sell as many<br />
brooms as he likes at this price. Oliver’s monthly cost function is C(q) = 5000 + 8q + 0.005q 2 .<br />
A. How many brooms should Oliver sell each month to maximize his profits<br />
B. How much profit does Oliver earn each month<br />
C. If Oliver’s fixed costs increased to $50,000 per month, explain as precisely as possible how your<br />
answers to parts A <strong>and</strong> B would change<br />
D. Suppose price does not equal $20, but instead fluctuates. At what price would Oliver be indifferent<br />
between staying open <strong>and</strong> shutting down<br />
Question 18<br />
A monopoly faces dem<strong>and</strong> of q = 346 – 0.02p <strong>and</strong> costs of C(q) = 50,000 + 500q + 10q 2 .<br />
A. Solve for the firm’s marginal revenue curve <strong>and</strong> marginal cost curve.<br />
B. What is the profit maximizing quantity <strong>and</strong> price<br />
C. How much profit does the firm earn<br />
D. How much deadweight loss is associated with the monopolist compared to the efficient outcome<br />
Question 19<br />
A monopoly faces costs of of C(q) = 320 + 10q + 2q 2 <strong>and</strong> dem<strong>and</strong> for its product of q = 50.8 – 0.4p.<br />
A. How many units of output does the monopolist make to maximize its profit What price does the<br />
monopolist charge How much profit does the monopolist earn<br />
B. Suppose the monopolist could pay a local sports hero $1,200 to advertise its product. It is expected<br />
that dem<strong>and</strong> for the product would increase to q = 76 – 0.4p. Should the monopolist pursue this<br />
advertising opportunity<br />
Question 20<br />
Glaxo-Smith-Kline (GSK) has a patent on Glisimnex, a drug that can help treat a form of cancer. GSK’s<br />
cost of making q tablets of Glisimnex each month is C(q) = 18750 + 5q + 0.025q 2 . Monthly dem<strong>and</strong> for<br />
Glisimnex, which can be expressed as an inverse dem<strong>and</strong> function, is p(q) = 180 - 0.01q. How many<br />
tablets of Glisimnex should GSK make each month What price will it charge for each tablet How<br />
much profit will it earn each month<br />
32
PRACTICE QUESTIONS FOR FINAL EXAM<br />
Question 1<br />
The farm lobby is headed to Washington D.C. in hopes of getting Congress to set higher price floors for<br />
all agricultural goods. When interviewed by CNN, the leader of the farm lobby was asked what target<br />
price floor the lobby was hoping to get enacted. His response was “The higher, the better.”<br />
A. Is this true That is, is a higher price floor always better for producers<br />
B. In the United States, agricultural price floors are usually also accompanied with a promise by the<br />
government to purchase (at the price floor) any goods that farmers fail to sell in the marketplace.<br />
Does your answer to A hold up when both of these policies – a price floor <strong>and</strong> a promise to purchase<br />
all of the quantity surplus – are in place<br />
Question 2<br />
The market for apartments in <strong>Lake</strong> <strong>Forest</strong> is competitive, with dem<strong>and</strong> of Q D = 420 – 0.05p <strong>and</strong> supply of<br />
Q S = 0.10p – 60. Suppose the city of <strong>Lake</strong> <strong>Forest</strong> imposes a price ceiling of $2,800. Following the<br />
imposition of the price ceiling, how many apartments will be supplied How many apartments will be<br />
dem<strong>and</strong>ed By how much is producer surplus reduced due to the price ceiling How much deadweight<br />
loss is caused by the price ceiling<br />
Question 3<br />
Consider an oligopoly with two firms. The market inverse dem<strong>and</strong> curve is p = 160 – 2Q. The two firms<br />
make identical products, have no fixed costs, <strong>and</strong> face a marginal cost of 40 per unit produced.<br />
A. Suppose the oligopoly is engaged in Bertr<strong>and</strong> competition. What is the equilibrium price How<br />
much output does each firm make How much profit does each firm earn<br />
B. Suppose the two firms form an enforceable cartel. What is the equilibrium price How much output<br />
does each firm make How much profit does each firm earn<br />
Question 4<br />
The total yearly (inverse) dem<strong>and</strong> for motorcycles is p = 70,000 – 5Q. Harley Davidson <strong>and</strong> Yamaha are<br />
the only makers of motorcycles. Each year, each company decides how many motorcycles to make, <strong>and</strong><br />
the total made determines the market price. Each company has a total cost of production of 10,000q.<br />
A. If the two companies collude to maximize joint profits, how many motorcycles will each company<br />
make (assuming they split production <strong>and</strong> profits equally) <strong>and</strong> how much profit does each company<br />
earn<br />
B. Assuming that Yamaha sticks to this optimal colluding level of production, show that Harley<br />
Davidson can increase its profits by deviating from the agreement <strong>and</strong> making more motorcycles.<br />
Question 5<br />
Consider an industry in which there are two firms with no fixed costs. Both firms face a constant<br />
marginal cost of $7 <strong>and</strong> the industry inverse dem<strong>and</strong> curve is p = 187 – 2Q.<br />
A. If the firms successfully form a cartel, what price will the cartel set How much quantity will be<br />
made in the industry How much profit will the cartel earn<br />
B. If the firms are engaged in Bertr<strong>and</strong> competition, what market price will come about How much<br />
output will be produced in total How much profit will each firm earn<br />
Question 6<br />
Provide very brief descriptions/definitions of the following concepts by completing the sentence.<br />
A. Schumpeterian Growth is the idea that<br />
B. Natural monopoly exists whenever<br />
C. Monopolistic competition is described by the following three properties:<br />
D. Cournot competition requires that<br />
33
Question 7<br />
The following payoff matrix represents payoffs from a game in which there are 2 players each with 4<br />
possible actions. The first number in each box is Player One’s payoff, <strong>and</strong> the second number is Player<br />
Two’s payoff.<br />
Player One<br />
Player Two<br />
B1 B2 B3 B4<br />
A1 12 , 0 12 , 1 3 , 3 10 , 0<br />
A2 9 , 9 8 , 8 4 , 10 8 , 10<br />
A3 4 , 5 9 , 4 5 , 5 9 , 0<br />
A4 6 , 6 5 , 6 1 , 7 50 , 6<br />
A. What are the pure strategy Nash equilibria to the game<br />
B. List all of the Pareto optimal outcomes to the game.<br />
Question 8<br />
Consider the following normal form game.<br />
Player 1<br />
Player 2<br />
Left Center Right<br />
Top 5 , 4 6 , 9 7 , 2<br />
Middle 8 , 9 4 , 9 2 , 7<br />
Bottom 3 , 5 7 , 6 5 , 5<br />
A. What is the predicted outcome of the above game when considering dominant strategies<br />
B. List all of the pure-strategy Nash equilibria to the above game.<br />
Question 9<br />
Consider the following normal form game.<br />
Player 1<br />
Player 2<br />
A B C D E<br />
W 6 , 3 2 , 9 5 , 5 8 , 9 7 , 9<br />
X 4 , 2 9, 2 2 , 5 2 , 0 6 , 4<br />
Y 0 , 0 7 , 7 5 , 2 9 , 9 5 , 1<br />
Z 7 , 19 3 , 4 7 , 3 4 , 5 1 , 2<br />
List all of the pure strategy Nash equilibria to the above game.<br />
34
Question 10<br />
Consider the following sequential game.<br />
Left<br />
1<br />
Right<br />
In<br />
2 2<br />
Out<br />
In<br />
Out<br />
10 , 40 20 , 30 5 , 100 100 , 5<br />
What is the sub-game perfect equilibrium to the above game<br />
Question 11<br />
The table below lists the amount of pollution each of 4 firms emits during production <strong>and</strong> each firm’s cost<br />
of cleaning up each unit of its own pollution. The government wants to limit pollution to 300 units. Thus,<br />
each firm is given 75 tradable permits, <strong>and</strong> each permit allows the firm to emit 1 unit of pollution without<br />
cleaning it up. Firms are required to pay to clean up all of its pollution for which it does not have a permit.<br />
Firms: A B C D<br />
Pre-Regulation Units of Pollution: 160 240 200 400<br />
Cost of Cleaning-Up Each Unit of Pollution: 40 25 30 20<br />
Permits Given: 75 75 75 75<br />
Permits Bought:<br />
Permits Sold:<br />
Total Permits Held After Trading:<br />
A. Fill in the remainder of the table assuming that firms do not respond to regulation by producing less<br />
output (<strong>and</strong> thus pollute less). At what price do permits trade<br />
B. What would have been the cost of reducing pollution to 300 units if the government had not used<br />
pollution permits but rather required each firm to produce at most 75 units of pollution What is the<br />
cost of reducing pollution to 300 units under the permit scheme<br />
35
EXAM #1 – ECON 210: INTERMEDIATE MICRO<br />
Professor Lemke<br />
February 14, 2011<br />
1. Consider the market for cranberry juice. The market starts in equilibrium. Then it is discovered that<br />
cranberries contain antioxidants, which help in improving one’s health. In response to the news that<br />
cranberries contain antioxidants:<br />
a. How will the dem<strong>and</strong> for cranberry juice change Why<br />
b. How will the supply of cranberry juice change Why<br />
c. How will the equilibrium price <strong>and</strong> quantity of cranberry juice change Provide a graph of<br />
the changes. (Let 0 denote the original equilibrium, <strong>and</strong> let 1 denote the new equilibrium.)<br />
2. On February 2, Jewel/Osco predicted that its dem<strong>and</strong> for snow shovels was Q D = 200 – 10p.<br />
a. What is the inverse dem<strong>and</strong> equation<br />
b. What is the elasticity of dem<strong>and</strong> if Jewel sets the price to $12 per shovel<br />
3. The yearly market for bottles of glue in the <strong>Lake</strong> <strong>Forest</strong> <strong>College</strong> Bookstore can be described with the<br />
following dem<strong>and</strong> <strong>and</strong> supply functions: Q D = 1,000 – 200p <strong>and</strong> Q S = 200p – 200.<br />
a. What is the market equilibrium (Price <strong>and</strong> quantity.)<br />
b. At the market equilibrium, it can be shown that the price elasticity of dem<strong>and</strong> is –1.5 <strong>and</strong> that<br />
the price elasticity of supply is +1.5. Suppose <strong>Lake</strong> <strong>Forest</strong> <strong>College</strong> decides to fund a new<br />
program by imposing a $2 excise tax on each bottle of glue sold in the bookstore.<br />
i. What price will students now pay for a bottle of glue<br />
ii. What price will the bookstore now receive, net of the tax, for a bottle of glue<br />
iii. How much revenue will the college collect because of the excise tax on glue<br />
4. Jeff is taking a group of 8-year-olds to the movies. The tickets were free, <strong>and</strong> Jeff has $60 to spend<br />
on popcorn <strong>and</strong> soda. Each bag of popcorn costs $4 <strong>and</strong> each soda costs $3. Graph Jeff’s budget line.<br />
(Put popcorn on the x-axis.) What is the marginal rate of transformation that Jeff faces<br />
5. A big-box store sells two products – plastic crap <strong>and</strong> junky trinkets. The store offers two pricing<br />
schemes. Under scheme A, each unit of plastic crap <strong>and</strong> each junky trinket costs $2. Under scheme<br />
B, a customer can pay a $50 membership fee, the benefit of which is that the prices of both goods are<br />
reduced to $1.<br />
a. On one graph, provide three budget lines for scheme A when income is $80, $100, <strong>and</strong> $120.<br />
b. On one graph, provide three budget lines for scheme B when income is $80, $100, <strong>and</strong> $120.<br />
c. When will a consumer pay the membership fee<br />
6. A person values books (x 1 ) <strong>and</strong> movies (x 2 ) as perfect substitutes whereby each book takes on the<br />
same value as three movies.<br />
a. Provide a utility function capturing these preferences.<br />
b. Graph some indifference curves.<br />
c. What is the person’s marginal rate of substitution (of books in terms of movies) when<br />
consuming 20 books <strong>and</strong> 21 movies<br />
7. A person values gallons of paint (x 1 ) <strong>and</strong> paint brushes (x 2 ) as perfect complements whereby 5 gallons<br />
of paint are consumed in t<strong>and</strong>em with every 2 paint brushes.<br />
a. Provide a utility function capturing these preferences.<br />
b. Graph some indifference curves.<br />
c. What is the person’s marginal rate of substitution (of gallons of paint in terms of paint<br />
brushes) when consuming 30 gallons of paint <strong>and</strong> 10 paint brushes.<br />
36
EXAM #1 ANSWERS<br />
Professor Lemke<br />
February 14, 2011<br />
1. Consider the market for cranberry juice. The market starts in equilibrium. Then it is discovered that<br />
cranberries contain antioxidants, which help in improving one’s health. In response to the news that<br />
cranberries contain antioxidants:<br />
a. How will the dem<strong>and</strong> for cranberry juice change Why<br />
The new information regarding cranberries will increase (shift out) the dem<strong>and</strong> for cranberry<br />
juice, because people will have a greater preference for cranberry juice.<br />
b. How will the supply of cranberry juice change Why<br />
The supply of cranberry juice will not change. The supply of any product only depends on<br />
the production costs of the good. As the health benefits of cranberry juice do not affect the<br />
production cost of cranberry juice, the new information has no effect on the supply of<br />
cranberry juice.<br />
c. How will the equilibrium price <strong>and</strong> quantity of cranberry juice change Provide a graph of<br />
the changes. (Let 0 denote the original equilibrium, <strong>and</strong> let 1 denote the new equilibrium.)<br />
As dem<strong>and</strong> increases but supply remains the same, the new equilibrium in the market for<br />
cranberry juice will result in a higher price (P 1 > P 0 ) <strong>and</strong> more cranberry juice being sold (Q 1<br />
> Q 0 ) . See the graph below.<br />
Price<br />
D 0 D 1 S 0<br />
P 1<br />
P 0<br />
Q 0 Q 1 Cranberry Juice<br />
2. On February 2, Jewel/Osco predicted that its dem<strong>and</strong> for snow shovels was Q D = 200 – 10p.<br />
a. What is the inverse dem<strong>and</strong> equation<br />
Q D = 200 – 10p → 10p = Q D – 200 → p = 0.1Q D – 20 (Inverse Dem<strong>and</strong>)<br />
b. What is the elasticity of dem<strong>and</strong> if Jewel sets the price to $12 per shovel<br />
At a price of $12, Q D = 200 – 10(12) = 120 = 80. From the dem<strong>and</strong> equation, we also have<br />
that ∂Q D / ∂p = –10. The elasticity of dem<strong>and</strong> is now straightforward to calculate:<br />
⎛<br />
⎜<br />
∂Q<br />
ε =<br />
⎝ ∂p<br />
D<br />
⎞⎛<br />
⎟⎜<br />
p<br />
⎠⎝<br />
Q<br />
D<br />
⎞<br />
⎟ =<br />
⎠<br />
⎛ 12 ⎞<br />
⎜ ⎟<br />
⎝ 80 ⎠<br />
( −10) = −1.5.<br />
37
3. The yearly market for bottles of glue in the <strong>Lake</strong> <strong>Forest</strong> <strong>College</strong> Bookstore can be described with the<br />
following dem<strong>and</strong> <strong>and</strong> supply functions: Q D = 1,000 – 200p <strong>and</strong> Q S = 200p – 200.<br />
a. What is the market equilibrium (Price <strong>and</strong> quantity.)<br />
Q D = Q S<br />
1,000 – 200p = 200p – 200<br />
400p = 1,200<br />
p* = $3<br />
Q* = 1,000 – 200(3) = 200(3) – 200 = 400 bottles of glue.<br />
b. At the market equilibrium, it can be shown that the price elasticity of dem<strong>and</strong> is –1.5 <strong>and</strong> that<br />
the price elasticity of supply is +1.5. Suppose <strong>Lake</strong> <strong>Forest</strong> <strong>College</strong> decides to fund a new<br />
program by imposing a $2 excise tax on each bottle of glue sold in the bookstore.<br />
i. What price will students now pay for a bottle of glue<br />
As dem<strong>and</strong> <strong>and</strong> supply are both linear, we know that<br />
⎛ η ⎞ ⎛ 1.5 ⎞ ⎛ 1 ⎞<br />
∆p<br />
= ⎜ ⎟ × ∆t<br />
= ⎜ ⎟ × 2 = ⎜ ⎟ × 2 = $1.<br />
⎝η<br />
− ε ⎠ ⎝1.5<br />
− ( −1.5)<br />
⎠ ⎝ 2 ⎠<br />
As price changes by $1, students pay $4 after the tax has been imposed.<br />
ii. What price will the bookstore now receive, net of the tax, for a bottle of glue<br />
As students now pay $4 per bottle of glue <strong>and</strong> the tax on each bottle is $2, the<br />
bookstore receives a net price of $4 – $2 = $2 per bottle of glue following the tax.<br />
iii. How much revenue will the college collect because of the excise tax on glue<br />
At the new consumer price of $4, we have that Q D = 1,000 – 200(4) = 200 bottles of<br />
glue are dem<strong>and</strong>ed. (Alternatively, at the new after-tax price of $2, Q S = 200(2) –<br />
200 = 200 bottles of glue are supplied.) With 200 bottles now being bought <strong>and</strong> sold,<br />
<strong>and</strong> given a $2 excise tax, total revenue collected from the tax is 200 × $2 = $400.<br />
4. Jeff is taking a group of 8-year-olds to the movies. The tickets were free, <strong>and</strong> Jeff has $60 to spend<br />
on popcorn <strong>and</strong> soda. Each bag of popcorn costs $4 <strong>and</strong> each soda costs $3. Graph Jeff’s budget line.<br />
(Put popcorn on the x-axis.) What is the marginal rate of transformation that Jeff faces<br />
With a $60 budget, the max popcorn that can be afforded is $60 ÷ $4 = 15 bags <strong>and</strong> the max soda is<br />
$60 ÷ $3 = 20 sodas. As prices never change, the budget line is a straight line with constant slope. In<br />
particular, the slope of the budget line is the MRT = –p popcorn ÷ p soda = –$4 ÷ $3 = –1.33.<br />
Soda<br />
20<br />
Slope = –1.33<br />
15 Popcorn<br />
38
5. A big-box store sells two products – plastic crap <strong>and</strong> junky trinkets. The store offers two pricing<br />
schemes. Under scheme A, each unit of plastic crap <strong>and</strong> each junky trinket costs $2. Under scheme<br />
B, a customer can pay a $50 membership fee, the benefit of which is that the prices of both goods are<br />
reduced to $1.<br />
a. On a single graph, provide three budget lines for scheme A when income is $80, $100, <strong>and</strong><br />
$120.<br />
As both prices are $2, the consumer can purchase a max of 40 of either good when having an<br />
$80 budget, 50 when having a $100 budget, <strong>and</strong> 60 when having an $120 budget.<br />
Trinkets<br />
60<br />
50<br />
40<br />
Budget Lines for Scheme A<br />
BL $80 BL $100 BL $120<br />
40 50 60 Crap<br />
b. On a single graph, provide three budget lines for scheme B when income is $80, $100, <strong>and</strong><br />
$120.<br />
As both prices are now $1 but one must pay the $50 membership fee, the consumer can<br />
purchase a max of 30 of either good when having an $80 budget, 50 when having a $100<br />
budget, <strong>and</strong> 70 when having an $120 budget.<br />
Trinkets 70 Budget Lines for Scheme B<br />
50<br />
30 BL $80 BL $100 BL $120<br />
c. When will a consumer pay the membership fee<br />
30 50 70 Crap<br />
Under Scheme A, both prices are $2. Therefore, the total number of units of goods that can<br />
be purchased (of either good or in some combination) is Y ÷ 2. Under Scheme B, both prices<br />
are $1, but the membership fee must be paid. Therefore, the total number of units of goods<br />
that can be purchased (of either good or in combination is (Y – 50) ÷ 1 = Y – 50. The<br />
consumer prefers Scheme B, therefore, if Y – 50 > Y ÷ 2, which reduces to<br />
Y – 50 > Y / 2 → 2Y – 100 > Y → Y > 100.<br />
Thus, the consumer prefers scheme B whenever her budget is greater than (or equal to) $100.<br />
39
6. A person values books (x 1 ) <strong>and</strong> movies (x 2 ) as perfect substitutes whereby each book takes on the<br />
same value as three movies.<br />
a. Provide a utility function capturing these preferences.<br />
As 1 book (x 1 ) always provides the same value as 3 movies (x 2 ), according to our notation in<br />
class we have that a = 1 <strong>and</strong> b = 3. Therefore, a valid utility function for these perfect<br />
substitute preferences is<br />
x2<br />
u ( x1,<br />
x2)<br />
= x1<br />
+ .<br />
3<br />
b. Graph some indifference curves.<br />
Movies 9<br />
6<br />
3<br />
1 2 3 Books<br />
c. What is the person’s marginal rate of substitution (of books in terms of movies) when<br />
consuming 20 books <strong>and</strong> 21 movies<br />
As all indifference curves has the same constant slope under perfect substitutes, the MRS at<br />
any bundle is always the same: MRS = –b / a = –3 / 1 = –3. Thus, when consuming 20<br />
books <strong>and</strong> 21 movies, the MRS is –3.<br />
40
7. A person values gallons of paint (x 1 ) <strong>and</strong> paint brushes (x 2 ) as perfect complements whereby 5 gallons<br />
of paint are consumed in t<strong>and</strong>em with every 2 paint brushes.<br />
a. Provide a utility function capturing these preferences.<br />
As 5 gallons of paint (x 1 ) is always consumed in t<strong>and</strong>em with 2 paint brushes (x 2 ), according<br />
to our notation in class we have that a = 5 <strong>and</strong> b = 2. Therefore, a valid utility function<br />
for these perfect complement preferences is<br />
b. Graph some indifference curves.<br />
⎧ x1<br />
x2<br />
⎫<br />
u ( x1,<br />
x2)<br />
= max⎨<br />
, ⎬ .<br />
⎩ 5 2 ⎭<br />
Paint Brushes<br />
6<br />
Ray of Slope b / a = 0.4<br />
4<br />
2<br />
5 10 15 Gallons of Paint<br />
c. What is the person’s marginal rate of substitution (of gallons of paint in terms of paint<br />
brushes) when consuming 30 gallons of paint <strong>and</strong> 10 paint brushes.<br />
Under perfect substitutes, the MRS is always negative infinity above the ray (i.e., having<br />
excess paint brushes) <strong>and</strong> is always 0 on <strong>and</strong> below the ray (i.e., having excess paint). As 10<br />
paint brushes can be used with 25 gallons of paint (i.e., [10 ÷ 2] × 5 = 25), the proposed<br />
bundle of 30 gallons of paint <strong>and</strong> 10 paint brushes is associated with excess paint. Therefore,<br />
the MRS at this bundle equals 0.<br />
41
EXAM #1 – ECON 210: INTERMEDIATE MICRO<br />
Professor Lemke<br />
February 20, 2012<br />
1. Explain how the following events affect the market equilibrium (both price <strong>and</strong> quantity). In your<br />
answer, explain in words <strong>and</strong> show with a graph what happens.<br />
a. Suppose a new, popular, <strong>and</strong> successful diet promotes eating low-carb foods. What happens<br />
to the equilibrium in the market for cheese For the record, cheese is a low-carb food.<br />
b. Suppose the price of aluminum falls by half due to the finding of new deposits. What<br />
happens to the equilibrium in the market for aluminum-coated frying pans For the record,<br />
the production of aluminum-coated frying pans requires considerable amounts of aluminum.<br />
2. Following natural disasters (such as hurricanes), the government frequently enacts “No Price<br />
Gauging” laws. For example, following a natural disaster when people need “recovery goods” such<br />
as power generators, clean water, or batteries, the government prohibits firms from selling these items<br />
at a price significantly higher than what these goods were selling at before the disaster. Consider an<br />
extremely devastating disaster for which the effects last for at least three months <strong>and</strong> therefore the No<br />
Price Gauging law remains in effect for at least three months as well. At the same time, though the<br />
devastation was severe, suppose the roads are opened relatively quickly so that during the three<br />
months of recovery, goods can still be shipped into the area at the same cost <strong>and</strong> as easily as they had<br />
been shipped into the area before the disaster.<br />
a. Using words <strong>and</strong> a graph, what would happen to the price of one of these “recovery” goods<br />
such as power generators, clean water, or batteries following the natural disaster if the<br />
government did not impose the No Price Gauging law<br />
b. During the three months of recovery, the No Price Gauging law would help some (potential)<br />
consumers. Explain why.<br />
c. During the three months of recovery, the No Price Gauging law would hurt some (potential)<br />
consumers. Explain why.<br />
3. Draw a budget line when income is $100, the price of good 1 is $10, <strong>and</strong> the price of good 2 is $5.<br />
Include both intercepts <strong>and</strong> the slope in your graph.<br />
4. Consider the budget line drawn in the graph below, <strong>and</strong> know that the price of Good 2 = $4.00.<br />
Budget Line<br />
Good 2<br />
Slope = –2<br />
10<br />
Good 1<br />
a. How much of Good 2 can the consumer afford if he buys none of Good 1<br />
b. How much income does the consumer have<br />
c. What is the price of Good 1<br />
42
5. Consider a situation with $100 of income <strong>and</strong> two goods – bottles of glue <strong>and</strong> all other goods. The<br />
price of all other goods is always $1 per unit. The Craft Store sells bottles of glue for $2 per bottle,<br />
unless the purchaser is willing to buy more than 40 bottles in which case the Craft Store charges $1<br />
per bottle for all of the bottles purchased (not just the bottles purchased after the 40 th ). Thus, among<br />
the infinite possibilities, the consumer could purchase 20 bottles at $2 per bottle, leaving $60 to be<br />
spent on all other goods. Alternatively, the consumer could purchase 70 bottles at $1 per bottle,<br />
leaving $30 to be spent on all other goods. Graph the consumer’s budget line. Be sure to include all<br />
intercepts, interesting points, <strong>and</strong> slopes.<br />
6. Consider a market for iPhones described by the following supply <strong>and</strong> dem<strong>and</strong> functions.<br />
Supply: Q S = 4P – 120<br />
Dem<strong>and</strong>: Q D = 480 – 2P<br />
a. Solve for the inverse supply function <strong>and</strong> the inverse dem<strong>and</strong> function.<br />
b. Solve for the market equilibrium.<br />
c. Suppose the government imposes a $30 excise tax on firms. What is the new market<br />
equilibrium, including the new price consumers pay for an iPhone, the new price firms<br />
receive for an iPhone after paying the tax, <strong>and</strong> the quantity of iPhones now bought <strong>and</strong> sold in<br />
equilibrium Moreover, what portion of the $30 excise tax do consumers bear What<br />
portion of the $30 excise tax do firms bear How much revenue does the tax generate for the<br />
government<br />
7. For Mylie, downloading 7 songs always yields the same amount of happiness as does downloading<br />
two episodes of The Office. Thus, for Mylie, song downloads <strong>and</strong> episodes of The Office are perfect<br />
substitutes.<br />
a. Graph several of Mylie’s indifference curves. (Put songs on the x-axis <strong>and</strong> episodes of The<br />
Office on the y-axis.)<br />
b. Provide a utility function representing Mylie’s preferences.<br />
c. What is Mylie’s MRS at the consumption bundle of 19 songs <strong>and</strong> 43 episodes of The Office<br />
8. Aramark, in planning for a party, expects guests to always want to consume 9 pieces of sushi with 2<br />
pieces of tempura. Thus, from Aramark’s perspective, sushi <strong>and</strong> tempura are perfect complements.<br />
a. If the price of each piece of sushi is $3, the price of each piece of tempura is $4, <strong>and</strong><br />
Aramark’s budget for the party is $700, how many pieces of sushi <strong>and</strong> how many pieces of<br />
tempura should Aramark purchase<br />
b. Provide a utility function representing Aramark’s preferences.<br />
c. What is the MRS for sushi (so sushi is graphed on the x-axis) at the consumption bundle of<br />
360 pieces of sushi <strong>and</strong> 60 pieces of tempura<br />
43
9. Arthur <strong>and</strong> Baxter both have well-behaved preferences for cake (x-axis good) <strong>and</strong> donuts (y-axis<br />
good), though they differ in their valuation of both goods. The graphs below include some of<br />
Arthur’s indifference curves <strong>and</strong> some of Baxter’s indifference curves. Both graphs are on the same<br />
scale, so they are comparable.<br />
Arthur’s Indifference Curves<br />
Baxter’s Indifference Curves<br />
Donuts<br />
Donuts<br />
Cakes<br />
Cakes<br />
According to the indifference curves graphed above, does Arthur place a greater value on cake than<br />
does Baxter or does Baxter place a greater value on cake than does Arthur Explain.<br />
44
EXAM #1 – ECON 210: INTERMEDIATE MICRO – ANSWERS<br />
Professor Lemke<br />
February 20, 2012<br />
1. Explain how the following events affect the market equilibrium (both price <strong>and</strong> quantity). In your<br />
answer, explain in words <strong>and</strong> show with a graph what happens.<br />
a. Suppose a new, popular, <strong>and</strong> successful diet promotes eating low-carb foods. What happens<br />
to the equilibrium in the market for cheese For the record, cheese is a low-carb food.<br />
The successful diet doesn’t affect the cost of producing cheese, so the supply curve is<br />
unaffected. On the other h<strong>and</strong>, the successful diet will increase the dem<strong>and</strong> for cheese as<br />
people are attracted to the diet <strong>and</strong> therefore have a greater preference for cheese. When<br />
supply stays fixed <strong>and</strong> dem<strong>and</strong> increases, the equilibrium price will increase <strong>and</strong> the<br />
equilibrium quantity will increase. Both of these changes are captured in the graph below.<br />
Price of Cheese<br />
The Market for Cheese<br />
S<br />
P 1<br />
P 0<br />
D 0<br />
D 1<br />
Q 0<br />
Q 1<br />
Quantity of Cheese<br />
b. Suppose the price of aluminum falls by half due to the finding of new deposits. What<br />
happens to the equilibrium in the market for aluminum-coated frying pans For the record,<br />
the production of aluminum-coated frying pans requires considerable amounts of aluminum.<br />
The fall in the price of aluminum doesn’t affect preferences for aluminum-covered pans or<br />
income or the price of other goods, so dem<strong>and</strong> does not change in response to this news.<br />
However, when the price of aluminum falls, the cost of making aluminum-coated pans falls<br />
as the price of an input fell. Thus, supply shifts out in response to the news. When dem<strong>and</strong><br />
stays fixed <strong>and</strong> supply increases, the equilibrium price for aluminum-coated pans falls <strong>and</strong> the<br />
equilibrium quantity of aluminum-coated pans increases. Both of these changes are captured<br />
in the graph below.<br />
45
Price of Aluminum-<br />
Coated Pans<br />
The Market for Aluminum-Coated Pans<br />
S 0<br />
P 0<br />
S 1<br />
P 1<br />
D<br />
Q 0<br />
Q 1<br />
Quantity of Aluminum-<br />
Coated Pans<br />
2. Following natural disasters (such as hurricanes), the government frequently enacts “No Price<br />
Gauging” laws. For example, following a natural disaster when people need “recovery goods” such<br />
as power generators, clean water, or batteries, the government prohibits firms from selling these items<br />
at a price significantly higher than what these goods were selling at before the disaster. Consider an<br />
extremely devastating disaster for which the effects last for at least three months <strong>and</strong> therefore the No<br />
Price Gauging law remains in effect for at least three months as well. At the same time, though the<br />
devastation was severe, suppose the roads are opened relatively quickly so that during the three<br />
months of recovery, goods can still be shipped into the area at the same cost <strong>and</strong> as easily as they had<br />
been shipped into the area before the disaster.<br />
a. Using words <strong>and</strong> a graph, what would happen to the price of one of these “recovery” goods<br />
such as power generators, clean water, or batteries following the natural disaster if the<br />
government did not impose the No Price Gauging law<br />
Following a natural disaster, dem<strong>and</strong> for recovery goods increases while supply is unaffected<br />
as the cost of shipping goods into the region has not changed. Thus, when dem<strong>and</strong> increases<br />
<strong>and</strong> supply remains unchanged, price will increase as will equilibrium quantity.<br />
Price of<br />
Recovery Good<br />
The Market for a Recover Good<br />
S<br />
P 1<br />
P 0<br />
D 0<br />
D 1<br />
Q 0<br />
Q 1<br />
Quantity of Recovery Good<br />
46
. During the three months of recovery, the No Price Gauging law would help some (potential)<br />
consumers. Explain why.<br />
Given the new equilibrium in part (a), notice that a No Price Gauging law is simply a price<br />
ceiling imposed on a market. Therefore, the (potential) consumers who benefit from the No<br />
Price Gauging law are those who actually purchase the good at the artificially low price.<br />
c. During the three months of recovery, the No Price Gauging law would hurt some (potential)<br />
consumers. Explain why.<br />
The problem with price ceilings is that they lead to shortages. In this case, more consumers<br />
want power generators, clean water, batteries, etc. than are being supplied to the market by<br />
firms. Thus, the (potential) consumers who are hurt by the No Price Gauging law are those<br />
consumers who are willing to pay an even higher price for the good but can’t do so <strong>and</strong> thus<br />
can’t buy the good as firms do not supply enough to meet dem<strong>and</strong>.<br />
3. Draw a budget line when income is $100, the price of good 1 is $10, <strong>and</strong> the price of good 2 is $5.<br />
Include both intercepts <strong>and</strong> the slope in your graph.<br />
The math should be relatively straightforward, so here I only draw the graphs.<br />
Good 2<br />
20<br />
Budget Line<br />
Slope = -2<br />
10<br />
Good 1<br />
47
4. Consider the budget line drawn in the graph below, <strong>and</strong> know that the price of Good 2 = $4.00.<br />
Budget Line<br />
Good 2<br />
Slope = –2<br />
10<br />
Good 1<br />
a. How much of Good 2 can the consumer afford if he buys none of Good 1<br />
As the slope is -2 <strong>and</strong> the x-axis intercept is 10, this means that the y-intercept is 10*(2) = 20.<br />
Thus, the consumer can purchase 20 units of Good 2 if he doesn’t buy any of Good 1.<br />
b. How much income does the consumer have<br />
As the price of Good 2 is $4.00 per unit <strong>and</strong> the consumer can afford to purchase 20 units of<br />
Good 2, the consumer has 20*($4) = $80 of income.<br />
c. What is the price of Good 1<br />
As the slope is -2, the price of Good 2 = $4, <strong>and</strong> the slope equals –P 1 /P 2 , we can solve -2 = -<br />
P 1 /4 to find that the price of Good 1 is $8.<br />
5. Consider a situation with $100 of income <strong>and</strong> two goods – bottles of glue <strong>and</strong> all other goods. The<br />
price of all other goods is always $1 per unit. The Craft Store sells bottles of glue for $2 per bottle,<br />
unless the purchaser is willing to buy more than 40 bottles in which case the Craft Store charges $1<br />
per bottle for all of the bottles purchased (not just the bottles purchased after the 40 th ). Thus, among<br />
the infinite possibilities, the consumer could purchase 20 bottles at $2 per bottle, leaving $60 to be<br />
spent on all other goods. Alternatively, the consumer could purchase 70 bottles at $1 per bottle,<br />
leaving $30 to be spent on all other goods. Graph the consumer’s budget line. Be sure to include all<br />
intercepts, interesting points, <strong>and</strong> slopes.<br />
This is not a kink problem, but rather price depends on quantity. The first 40 bottles of glue cost 40 x<br />
$2 = $80, leaving $20 for all other goods. At the other extreme, one could buy no glue <strong>and</strong> spend all<br />
$100 on all other goods. On this portion of the budget line, the slope = -2.<br />
When buying more than 40 bottles of glue, the consumer can buy 100 bottles of glue (<strong>and</strong> no other<br />
good) or 40 + ε bottles of glue, leaving $60 – ε for spending on all other goods. On this portion of the<br />
budget line, the slope = -1.<br />
See the graph on the next page.<br />
48
All Other Goods<br />
Budget Line<br />
100<br />
Slope = –2<br />
60<br />
Slope = –1<br />
20<br />
0<br />
0<br />
40<br />
100<br />
Bottles of Glue<br />
6. Consider a market for iPhones described by the following supply <strong>and</strong> dem<strong>and</strong> functions.<br />
Supply: Q S = 4P – 120<br />
Dem<strong>and</strong>: Q D = 480 – 2P<br />
a. Solve for the inverse supply function <strong>and</strong> the inverse dem<strong>and</strong> function.<br />
Inverse Supply: Q S = 4P – 120 Inverse Dem<strong>and</strong>: Q D = 480 – 2P<br />
4P = Q S + 120<br />
2P = 480 – Q D<br />
P = 0.25Q S + 30 P = 240 – 0.5Q D .<br />
b. Solve for the market equilibrium.<br />
Market Equilibrium: Q S = Q D<br />
4P – 120 = 480 – 2P<br />
6P = 600<br />
P* = $100 => Q* = 4(100) – 120 = 480 – 2(100) = 280 units.<br />
Thus, in equilibrium, 280 iPhones will be sold at a price of $100 per phone.<br />
c. Suppose the government imposes a $30 excise tax on firms. What is the new market<br />
equilibrium, including the new price consumers pay for an iPhone, the new price firms<br />
receive for an iPhone after paying the tax, <strong>and</strong> the quantity of iPhones now bought <strong>and</strong> sold in<br />
equilibrium Moreover, what portion of the $30 excise tax do consumers bear What<br />
portion of the $30 excise tax do firms bear How much revenue does the tax generate for the<br />
government<br />
Using the inverse supply curve, the new supply curve is P = 0.25Q S + 60 as it shifts up by the<br />
amount of the tax.<br />
New Market Equilibrium: 0.25Q S + 60 = 240 – 0.5Q D<br />
0.75Q = 180<br />
Q* = 240 => P* = 0.25(24) + 60 = 240 – 0.5(240) = $120.<br />
Thus, under the tax, 240 iPhones will be sold at a price of $120 per phone ($90 received by<br />
firms). From this, we have that consumers bear $20 ($120 - $100) of the $30 tax while firms<br />
bear the remaining $10 of the $30 tax. In the end, the tax generates 240 x $30 = $7,200 of tax<br />
revenue.<br />
49
7. For Mylie, downloading 7 songs always yields the same amount of happiness as does downloading<br />
two episodes of The Office. Thus, for Mylie, song downloads <strong>and</strong> episodes of The Office are perfect<br />
substitutes.<br />
a. Graph several of Mylie’s indifference curves. (Put songs on the x-axis <strong>and</strong> episodes of The<br />
Office on the y-axis.)<br />
Episodes of The Office<br />
8<br />
6<br />
4<br />
Slope = –2/7 for all Indifference Curves<br />
2<br />
7 14 21 28<br />
Song Downloads<br />
b. Provide a utility function representing Mylie’s preferences.<br />
Let x 1 be songs <strong>and</strong> x 2 be downloads of the Office. Then, as 7 songs always yields the same<br />
amount of happiness as 2 episodes, one utility function that represents these preferences is:<br />
x1<br />
x2<br />
u ( x1<br />
, x2<br />
) = + .<br />
7 2<br />
c. What is Mylie’s MRS at the consumption bundle of 19 songs <strong>and</strong> 43 episodes of The Office<br />
As Mylie treats song downloads <strong>and</strong> episodes of The Office as perfect substitutes, her MRS is<br />
always -2/7 regardless of consumption bundle. In particular, at the bundle of 19 songs <strong>and</strong> 43<br />
episodes of The Office, her value of another song, which is her MRS, is -2/7 th of an episode.<br />
50
8. Aramark, in planning for a party, expects guests to always want to consume 9 pieces of sushi with 2<br />
pieces of tempura. Thus, from Aramark’s perspective, sushi <strong>and</strong> tempura are perfect complements.<br />
a. If the price of each piece of sushi is $3, the price of each piece of tempura is $4, <strong>and</strong><br />
Aramark’s budget for the party is $700, how many pieces of sushi <strong>and</strong> how many pieces of<br />
tempura should Aramark purchase<br />
Consider a bundle to be 9 pieces of sushi <strong>and</strong> 2 pieces of tempura. The cost of a bundle is<br />
then 9 x $3 + 2 x $4 = $35. Given Aramark’s $700 budget, it can afford to purchase<br />
$700 ÷ $35 = 20 such bundles. Thus, Aramark should purchase 20 x 9 = 180 pieces of sushi<br />
<strong>and</strong> 20 x 2 = 40 pieces of tempura.<br />
b. Provide a utility function representing Aramark’s preferences.<br />
Let x 1 be pieces of sushi <strong>and</strong> x 2 be pieces of tempura. Then, party guests always want to<br />
consume 9 pieces of sushi with 2 pieces of tempura, one utility function that represents these<br />
preferences is:<br />
⎧ x1<br />
x2<br />
⎫<br />
u ( x1<br />
, x2<br />
) = min⎨<br />
, ⎬ .<br />
⎩ 9 2 ⎭<br />
c. What is the MRS for sushi (so sushi is graphed on the x-axis) at the consumption bundle of<br />
360 pieces of sushi <strong>and</strong> 60 pieces of tempura<br />
Given Aramarks preferences of 9 pieces of sushi to 2 pieces of tempura, providing 360 pieces<br />
of sushi should be accompanied with (360 ÷ 9) x 2 = 80 pieces of tempura. As the proposed<br />
bundle comes with 60 pieces of tempura, there is not enough tempura in the bundle (or there<br />
is excess sushi). Thus, Aramark would not be willing to trade any of its tempura for any<br />
amount of sushi. Thus, Aramark’s MRS for sushi is 0 at the proposed bundle.<br />
51
9. Arthur <strong>and</strong> Baxter both have well-behaved preferences for cake (x-axis good) <strong>and</strong> donuts (y-axis<br />
good), though they differ in their valuation of both goods. The graphs below include some of<br />
Arthur’s indifference curves <strong>and</strong> some of Baxter’s indifference curves. Both graphs are on the same<br />
scale, so they are comparable.<br />
Arthur’s Indifference Curves<br />
Baxter’s Indifference Curves<br />
Donuts<br />
Donuts<br />
Cakes<br />
Cakes<br />
According to the indifference curves graphed above, does Arthur place a greater value on cake than<br />
does Baxter or does Baxter place a greater value on cake than does Arthur Explain.<br />
Notice that Arthur’s indifference curves are more steeply sloped at any bundle compared to Baxter’s<br />
indifference curves. In particular, if one graphs both indifference curves on the same graph, at any<br />
bundle A, we would have the following.<br />
Donuts<br />
Arthur’s IC<br />
A<br />
Baxter’s IC<br />
Cakes<br />
At bundle A, Arthur’s indifference curve is more steeply sloped than is Baxter’s. This means that<br />
Arthur’s MRS is greater than Baxter’s. This means that Arthur always places a greater value on<br />
cakes than does Baxter.<br />
52
EXAM #2 – ECON 210: INTERMEDIATE MICRO<br />
Professor Lemke<br />
March 18, 2011<br />
1. Marian’s preferences for flowers (x) <strong>and</strong> jewelry (y) can be expressed as v(x, y) = 2x 4 y 36 . Each flower<br />
costs $2.50 <strong>and</strong> each unit of jewelry costs $20.<br />
a. Transform Marian’s preferences into u(x, y) = x α y 1–α where 0 < α < 1.<br />
b. What is Marian’s marginal utility for flowers under the transformed utility function when<br />
consuming 10 units of flowers <strong>and</strong> 40 units of jewelry<br />
c. What is Marian’s marginal rate of substitution of flowers in terms of jewelry when<br />
consuming 10 units of flowers <strong>and</strong> 40 units of jewelry<br />
d. What is Marian’s marginal rate of transformation of flowers in terms of jewelry when<br />
consuming 10 units of flowers <strong>and</strong> 40 units of jewelry<br />
e. Suppose Marian’s significant other knows Marian’s preferences <strong>and</strong> chooses to spend $200<br />
on flowers <strong>and</strong> jewelry for Marian. How many flowers <strong>and</strong> how much jewelry will Marian’s<br />
significant other purchase for her<br />
2. Scott has $72 <strong>and</strong> faces prices of p 1 = $5 <strong>and</strong> p 2 = $6. Scott’s preferences can be written as:<br />
⎧ x1<br />
⎫<br />
u ( x1,<br />
x2<br />
) = min⎨<br />
, 3x2<br />
⎬ .<br />
⎩ 2 ⎭<br />
What is Scott’s optimal consumption bundle<br />
3. Lori always places the same value on 1 piece of cake as she does on 4 donuts. Lori has $9 to spend,<br />
<strong>and</strong> the price of each piece of cake is $3 while the price of each donut is $0.60.<br />
a. Given Lori’s preferences, income, <strong>and</strong> the above prices, what is Lori’s optimal consumption<br />
bundle<br />
b. Suppose the price of donuts increases but Lori doesn’t change her consumption decision.<br />
What can be said about the new price of donuts<br />
4. Consider a st<strong>and</strong>ard two-good consumption model for beer <strong>and</strong> pretzels. Norm <strong>and</strong> Cliff, two<br />
friendly bar patrons, who have identical incomes <strong>and</strong> face the same prices, both have well-behaved<br />
preferences. Norm’s preference for beer, however, is stronger than Cliff’s preference for beer at all<br />
possible consumption bundles.<br />
a. You are told that one of the barmates optimally chooses to consume 5 beers <strong>and</strong> 2 bowls of<br />
pretzels while the other chooses to consume 7 beers <strong>and</strong> 1 bowls of pretzels. Which person is<br />
associated with the consumption bundle of 5 beers <strong>and</strong> 2 bowls of pretzels Explain.<br />
b. You are told that Cliff’s MRS (in absolute value) is always greater than Norm’s MRS (in<br />
absolute value). Under this characterization, which good – beer or pretzels – is being graphed<br />
on the x-axis Explain.<br />
c. On a single graph, provide some indifference curves for Cliff <strong>and</strong> some indifference curves<br />
for Norm (labeled clearly) that incorporate the information given in part b.<br />
53
5. Consider a st<strong>and</strong>ard two-good model. Bruce’s optimal dem<strong>and</strong> for good 1 is<br />
x 1 = Y<br />
10 p p<br />
.<br />
For the record, you should notice that this is not the optimal dem<strong>and</strong> that comes about from having<br />
preferences according to Cobb-Douglas, perfect complements, or perfect substitutes. For each of the<br />
questions below, be sure to explain your answer clearly <strong>and</strong> completely.<br />
a. Does Bruce treat the two goods (x 1 <strong>and</strong> x 2 ) as complements or substitutes<br />
b. Graph Bruce’s dem<strong>and</strong> curve for good 1 assuming that Y = $500 <strong>and</strong> p 2 = $5. Does Bruce’s<br />
dem<strong>and</strong> for good 1 satisfy the law of dem<strong>and</strong><br />
c. Graph Bruce’s Engel curve for good 1 assuming p 1 = $2 <strong>and</strong> p 2 = $5. Does Bruce consider<br />
good 1 to be a normal or inferior good<br />
6. Consider the st<strong>and</strong>ard Consumption Today – Consumption Tomorrow model with an income<br />
endowment of Y 0 today <strong>and</strong> no income endowment tomorrow. Thus, consumption tomorrow is<br />
financed completely out of consumption today, <strong>and</strong> borrowing is not allowed. Let i be the real<br />
interest rate between the two periods, t be the capital gains tax rate, <strong>and</strong> r be the real after-tax interest<br />
rate between the two periods.<br />
a. What is it specifically in the first sentence above that leads the second sentence to conclude<br />
that “borrowing is not allowed”<br />
b. State r as a function of i <strong>and</strong> t. State p 1 , the price of consumption tomorrow (period 1), as a<br />
function of r. How do r <strong>and</strong> p 1 change when the capital gains tax rate is increased Do these<br />
relationships make intuitive sense<br />
c. What are the mathematical relationships between endowed income (Y 0 ), consumption today<br />
(C 0 ), consumption tomorrow (C 1 ), savings (S), <strong>and</strong> the after-tax rate of return (r) Hint: You<br />
can answer this by providing two mathematical equations.<br />
d. Assuming consumption today is an inferior good, use income <strong>and</strong> substitution effects to<br />
demonstrate potential changes in consumption today (C 0 ), consumption tomorrow (C 1 ), <strong>and</strong><br />
savings (S) when the capital gains tax rate is increased.<br />
7. For each part below, draw a budget line for our st<strong>and</strong>ard consumption – leisure model that reflects the<br />
general conditions given. Thus, you will draw a budget line for part A, <strong>and</strong> you will draw a second<br />
budget line on a separate graph for part B. Label all aspects of your graphs as much as possible.<br />
a. Draw a typical weekly budget line assuming a person earns a higher wage when working<br />
overtime. That is, the first 40 hours of work is paid at one wage while all hours worked past<br />
40 hours are paid a higher wage. Assume there are 98 hours each week that can be divided<br />
between work <strong>and</strong> leisure.<br />
b. Draw a typical budget line for an hourly worker in the United States who faces a progressive<br />
marginal income tax schedule. Assume the worker has 5,000 hours each year to be divided<br />
between work <strong>and</strong> leisure. Recall that a progressive tax system raises marginal tax rates with<br />
income. For simplicity, assume there are three marginal tax rates <strong>and</strong> that a worker who<br />
works 5,000 hours each year would earn enough money to pay at least some tax at the highest<br />
marginal rate.<br />
1<br />
2<br />
54
EXAM #2 ANSWERS<br />
Professor Lemke<br />
March 18, 2011<br />
1. Marian’s preferences for flowers (x) <strong>and</strong> jewelry (y) can be expressed as v(x, y) = 2x 4 y 36 . Each flower<br />
costs $2.50 <strong>and</strong> each unit of jewelry costs $20.<br />
a. Transform Marian’s preferences into u(x, y) = x α y 1–α where 0 < α < 1.<br />
From class we know that α = 4 ÷ (4 + 36) = 0.1. Therefore, u(x, y) = x 0.1 y 0.9 .<br />
b. What is Marian’s marginal utility for flowers under the transformed utility function when<br />
consuming 10 units of flowers <strong>and</strong> 40 units of jewelry<br />
1−α<br />
⎛ y ⎞ ⎛ 40 ⎞<br />
Flowers = x, <strong>and</strong> so MU x = α⎜<br />
⎟ = 0.1⎜<br />
⎟ ≈ 0. 3482 .<br />
⎝ x ⎠ ⎝ 10 ⎠<br />
c. What is Marian’s marginal rate of substitution of flowers in terms of jewelry when<br />
consuming 10 units of flowers <strong>and</strong> 40 units of jewelry<br />
⎛ α ⎞⎛<br />
y ⎞ ⎛ 0.1⎞⎛<br />
40 ⎞<br />
MRS = −⎜<br />
⎟⎜<br />
⎟ = −⎜<br />
⎟⎜<br />
⎟ ≈ −0.444<br />
.<br />
⎝1−<br />
α ⎠⎝<br />
x ⎠ ⎝ 0.9 ⎠⎝<br />
10 ⎠<br />
d. What is Marian’s marginal rate of transformation of flowers in terms of jewelry when<br />
consuming 10 units of flowers <strong>and</strong> 40 units of jewelry<br />
0.9<br />
⎛ ⎞<br />
⎜<br />
px<br />
⎛ $2.50 ⎞<br />
MRT = − ⎟ = −⎜<br />
⎟ = −0.125<br />
.<br />
⎝<br />
p y ⎠ ⎝ $20 ⎠<br />
e. Suppose Marian’s significant other knows Marian’s preferences <strong>and</strong> chooses to spend $200<br />
on flowers <strong>and</strong> jewelry for Marian. How many flowers <strong>and</strong> how much jewelry will Marian’s<br />
significant other purchase for her<br />
αY<br />
(0.1)($200)<br />
x* = =<br />
= 8<br />
$2.50<br />
p x<br />
(1 − α)<br />
Y (0.9)($200)<br />
<strong>and</strong> y* = =<br />
= 9 .<br />
$20<br />
p y<br />
Therefore, the optimal bundle is 8 flowers <strong>and</strong> 9 units of jewelry.<br />
2. Scott has $72 <strong>and</strong> faces prices of p 1 = $5 <strong>and</strong> p 2 = $6. Scott’s preferences can be written as:<br />
⎧ x1<br />
⎫<br />
u ( x1,<br />
x2<br />
) = min⎨<br />
, 3x2<br />
⎬ .<br />
⎩ 2 ⎭<br />
What is Scott’s optimal consumption bundle<br />
Scott’s preferences are perfect complements, with 2 units of x 1 always being consumed with ⅓ units<br />
of x 2 . The price of this bundle is 2p 1 + (⅓)p 2 = 2($5) + (⅓)($6) = $12. The income level of $72<br />
allows $72 ÷ $12 = 6 such bundles being consumed. Therefore Scott consumes 6 × 2 = 12 units of<br />
good 1 <strong>and</strong> 6 × ⅓ = 2 units of good 2.<br />
55
3. Lori always places the same value on 1 piece of cake as she does on 4 donuts. Lori has $9 to spend,<br />
<strong>and</strong> the price of each piece of cake is $3 while the price of each donut is $0.60.<br />
a. Given Lori’s preferences, income, <strong>and</strong> the above prices, what is Lori’s optimal consumption<br />
bundle<br />
Lori’s preferences are perfect substitutes. The market cost of 1 piece of cake is $3. The<br />
market cost of 4 donuts is 4 × $0.60 = $2.40. As $2.40 < $3, Lori spends all of her money on<br />
donuts <strong>and</strong> none of it on cake. Lori consumes 0 pieces of cake <strong>and</strong> $9 ÷ $0.60 = 15 donuts.<br />
b. Suppose the price of donuts increases but Lori doesn’t change her consumption decision.<br />
What can be said about the new price of donuts<br />
As Lori doesn’t change her consumption decision, the cost of 4 donuts must remain less than<br />
the cost of 1 piece of cake. That is, 4p d < $3, which requires p d < $0.75. Therefore, we know<br />
that the new price of donuts is above $0.60 <strong>and</strong> is less than $0.75.<br />
4. Consider a st<strong>and</strong>ard two-good consumption model for beer <strong>and</strong> pretzels. Norm <strong>and</strong> Cliff, two<br />
friendly bar patrons, who have identical incomes <strong>and</strong> face the same prices, both have well-behaved<br />
preferences. Norm’s preference for beer, however, is stronger than Cliff’s preference for beer at all<br />
possible consumption bundles.<br />
a. You are told that one of the barmates optimally chooses to consume 5 beers <strong>and</strong> 2 bowls of<br />
pretzels while the other chooses to consume 7 beers <strong>and</strong> 1 bowls of pretzels. Which person is<br />
associated with the consumption bundle of 5 beers <strong>and</strong> 2 bowls of pretzels Explain.<br />
As the two bar patrons have well-behaved preferences, identical incomes, <strong>and</strong> face the same<br />
prices, Norm’s optimal consumption bundle will always include as much or more beer than<br />
Cliff’s optimal consumption bundle. Therefore, we know that Cliff’s optimal bundle is 5<br />
beers <strong>and</strong> 2 bowls of pretzels (<strong>and</strong> Norm’s bundle is 7 beers <strong>and</strong> 1 bowl of pretzels).<br />
b. You are told that Cliff’s MRS (in absolute value) is always greater than Norm’s MRS. Under<br />
this characterization, which good – beer or pretzels – is being graphed on the x-axis<br />
As Cliff’s MRS is greater than Norm’s MRS for the x-axis good, Cliff’s marginal value of the<br />
x-axis good exceeds Norm’s valuation at all possible consumption bundles. As we are told<br />
that Norm always has a stronger preference for beer, the x-axis good must be pretzels.<br />
c. On a single graph, provide some indifference curves for Cliff <strong>and</strong> some indifference curves<br />
for Norm (labeled clearly) that incorporate the information given in part b.<br />
Beer<br />
IC 1<br />
Cliff<br />
IC2 Cliff<br />
IC 3Cliff<br />
IC 3<br />
Norm<br />
IC 2<br />
Norm<br />
IC 1<br />
Norm<br />
Pretzels<br />
56
5. Consider a st<strong>and</strong>ard two-good model. Bruce’s optimal dem<strong>and</strong> for good 1 is<br />
x 1 = Y<br />
10 p p<br />
.<br />
For the record, you should notice that this is not the optimal dem<strong>and</strong> that comes about from having<br />
preferences according to Cobb-Douglas, perfect complements, or perfect substitutes. For each of the<br />
questions below, be sure to explain your answer clearly <strong>and</strong> completely.<br />
a. Does Bruce treat the two goods (x 1 <strong>and</strong> x 2 ) as complements or substitutes<br />
1<br />
As the price of good 2 increases, the optimal value of x 1 falls. (Plug in some numbers if you<br />
don’t see this directly: if Y = 10 <strong>and</strong> p 1 = 1, then p 2 = $0.50 → x 1 = 2 <strong>and</strong> p 2 = $1.00 → x 1 =<br />
1.) Moreover, if x 1 falls when p 2 increases, x 1 <strong>and</strong> x 2 are, by definition, complements.<br />
b. Graph Bruce’s dem<strong>and</strong> curve for good 1 assuming that Y = $500 <strong>and</strong> p 2 = $5. Does Bruce’s<br />
dem<strong>and</strong> for good 1 satisfy the law of dem<strong>and</strong><br />
Substituting: x 1 = 500/(10 × $5 × p 1 ) = 10/p 1 . Rearranging: p 1 = 10/x 1 .<br />
Price of good 1<br />
5<br />
Dem<strong>and</strong> Curve<br />
2<br />
2 Good 1<br />
c. Graph Bruce’s Engel curve for good 1 assuming p 1 = $2 <strong>and</strong> p 2 = $5. Does Bruce consider<br />
good 1 to be a normal or inferior good<br />
Substituting: x 1 = Y/(10 × $2 × $5) = Y/100. Rearranging: Y = 100x 1 .<br />
Income<br />
Engel Curve<br />
Slope =100<br />
Good 1<br />
As the Engel curve has a positive slope, Bruce considers Good 1 to be normal.<br />
57
6. Consider the st<strong>and</strong>ard Consumption Today – Consumption Tomorrow model with an income<br />
endowment of Y 0 today <strong>and</strong> no income endowment tomorrow. Thus, consumption tomorrow is<br />
financed completely out of consumption today, <strong>and</strong> borrowing is not allowed. Let i be the real<br />
interest rate between the two periods, t be the capital gains tax rate, <strong>and</strong> r be the real after-tax interest<br />
rate between the two periods.<br />
a. What is it specifically in the first sentence above that leads the second sentence to conclude<br />
that “borrowing is not allowed”<br />
As there is no endowment income in the second period (tomorrow), the agent has nothing to<br />
borrow against (i.e., the agent has no assets in the second period with which to repay a loan<br />
from the first period). Therefore, there cannot be any borrowing.<br />
b. State r as a function of i <strong>and</strong> t. State p 1 , the price of consumption tomorrow (period 1), as a<br />
function of r. How do r <strong>and</strong> p 1 change when the capital gains tax rate is increased Do these<br />
relationships make intuitive sense<br />
Let S be savings. Without taxes, S grows by iS from the first period to the second. If the<br />
agent pays a capital gains tax rate of t, the net growth is iS – iSt = (1 – t)iS. Therefore, r = (1<br />
– t)i.<br />
Given r, p 1 = 1/(1 + r) = 1/(1 + (1 – t)i).<br />
When t↑ → r↓ → p 1 ↑. These relationships make intuitive sense. When the tax rate goes up,<br />
the real rate of return (r) falls. And when the real rate of return falls, consumption tomorrow<br />
gets more expensive, which means that p 1 must increase.<br />
c. What are the mathematical relationships between endowed income (Y 0 ), consumption today<br />
(C 0 ), consumption tomorrow (C 1 ), savings (S), <strong>and</strong> the after-tax rate of return (r) Hint: You<br />
can answer this by providing two mathematical equations.<br />
S = Y 0 – C 0 <strong>and</strong> C 1 = (1 + r)S = (1 + r)(Y 0 – C 0 ).<br />
d. Assuming consumption today is an inferior good, use income <strong>and</strong> substitution effects to<br />
demonstrate potential changes in consumption today (C 0 ), consumption tomorrow (C 1 ), <strong>and</strong><br />
savings (S) when the capital gains tax rate is increased.<br />
First note that consumption tomorrow must be normal as consumption today is inferior.<br />
(IE) t ↑ → p 1 ↑ → Real Income ↓ → C 1 ↓ (normal), C 0 ↑ (inferior) → S ↓<br />
(SE) t ↑ → p 1 ↑ → C 1 ↓, C 0 ↑ → S ↓.<br />
Taking the IE <strong>and</strong> SE together, we see that when consumption today is inferior, an increase in<br />
the capital gains tax rate is predicted to lower consumption tomorrow, increase consumption<br />
today, <strong>and</strong> lower savings. There is no ambiguity in any of the three variables in this case.<br />
58
7. For each part below, draw a budget line for our st<strong>and</strong>ard consumption – leisure model that reflects the<br />
general conditions given. Thus, you will draw a budget line for part A, <strong>and</strong> you will draw a second<br />
budget line on a separate graph for part B. Label all aspects of your graphs as much as possible.<br />
a. Draw a typical weekly budget line assuming a person earns a higher wage when working<br />
overtime. That is, the first 40 hours of work is paid at one wage while all hours worked past<br />
40 hours are paid a higher wage. Assume there are 98 hours each week that can be divided<br />
between work <strong>and</strong> leisure.<br />
Consumption<br />
Weekly Budget Line<br />
|slope| > w<br />
|slope| = w<br />
58 98 Leisure<br />
b. Draw a typical budget line for an hourly worker in the United States who faces a progressive<br />
marginal income tax schedule. Assume the worker has 5,000 hours each year to be divided<br />
between work <strong>and</strong> leisure. Recall that a progressive tax system raises marginal tax rates with<br />
income. For simplicity, assume there are three marginal tax rates <strong>and</strong> that a worker who<br />
works 5,000 hours each year would earn enough money to pay at least some tax at the highest<br />
marginal rate.<br />
Yearly Budget Line<br />
Consumption<br />
|slope| = (1 – t 2 )w<br />
|slope| = (1 – t1)w<br />
|slope| = w<br />
5,000 Leisure<br />
The graph above assumes that the lowest tax rate is t 0 = 0, in which range the worker earns an<br />
after-tax hourly wage of w. Once enough money is earned, the worker pays a marginal tax<br />
rate of t 1 > 0, in which range the worker’s after-tax wage is (1 – t 1 )w. Finally, if the worker<br />
continues to earn enough money (by working enough hours), he will eventually face a<br />
marginal tax rate of t 2 where t 2 > t 1 . In this range the worker’s after-tax wage is (1 – t 2 )w.<br />
59
EXAM #2 – ECON 210: INTERMEDIATE MICRO<br />
Professor Lemke<br />
March 9, 2012<br />
1. Consider the Cobb-Douglas utility function: u ( x1,<br />
x2<br />
) = x1<br />
x2<br />
. The price of good 1 is $15, while<br />
the price of good 2 is $10. The consumer has a budget of $300.<br />
a. What is the marginal rate of substitution of good 1 for good 2 at the consumption bundle (8,<br />
6)<br />
b. What is the marginal rate of transformation of good 1 for good 2 at the consumption bundle<br />
(8, 6)<br />
c. What is the optimal consumption bundle<br />
2. Consider a consumer whose preference can be described by the following utility function:<br />
2 / 5<br />
{ 3x<br />
}<br />
1 , x 2 ) min 1 ,<br />
2<br />
3/ 5<br />
u ( x = x .<br />
a. Write the optimal dem<strong>and</strong> for x 1 <strong>and</strong> x 2 as a function of prices <strong>and</strong> income.<br />
b. Assume the price of good 1 is $30 <strong>and</strong> income is $60. Provide <strong>and</strong> graph the inverse dem<strong>and</strong><br />
function for good 2.<br />
c. Assume the price of good 1 is $30 <strong>and</strong> the price of good 2 is $5. Provide <strong>and</strong> graph the Engel<br />
curve for good 2.<br />
3. When shopping for her family, Claire treats kiwis (k) <strong>and</strong> mangos (m) as perfect substitutes, where<br />
five kiwis can substitute for two mangos (<strong>and</strong> likewise, two mangos can substitute for five kiwis).<br />
Thus, one utility function that represents Claire’s preferences is<br />
u(k, m) = 0.2k + 0.5m.<br />
a. What is Claire’s dem<strong>and</strong> function for kiwis when her budget is $30 <strong>and</strong> the price of each<br />
mango is $0.80. Graph this dem<strong>and</strong> function.<br />
b. What is Claire’s Engel curve for kiwis when the price of each kiwi is $0.20 <strong>and</strong> the price of<br />
each mango is $0.80. Graph this Engel curve.<br />
c. What is the Claire’s optimal dem<strong>and</strong> when her budget is $20, the price of each kiwi is $0.20,<br />
<strong>and</strong> the price of each mango is $0.80.<br />
4. When asked why she supported exp<strong>and</strong>ing the Earned Income Tax Credit (EITC) but did not support<br />
offering a lump-sum transfer as policy to help the poor, a famous economist responded “Because the<br />
lump-sum transfer is not associated with a substitution effect, but the EITC is.” Explain what the<br />
economist meant by this <strong>and</strong> why this led her to have a policy preference for the EITC but not for the<br />
lump-sum transfer.<br />
5. Assuming consumption today <strong>and</strong> consumption tomorrow are both normal goods, we showed in class<br />
that a reduction in the capital gains tax rate could result in greater or less savings today. Explain or<br />
reproduce this result. Be thorough <strong>and</strong> careful.<br />
60
6. The following graph shows optimal choice following an increase in the price of good 1. All items<br />
before the price increase are labeled with a superscript 0, while all items following the price increase<br />
are labeled with a superscript 1. All items are labeled as we labeled them in class.<br />
Good 2<br />
IC 1<br />
IC 0 BL 1<br />
●<br />
●<br />
BL 0<br />
Good 1<br />
a. On the graph, draw in the hypothetical budget line <strong>and</strong> clearly label the substitution, income,<br />
<strong>and</strong> total effects for good 1 from the price increase.<br />
b. According to your graph, is good 1 normal, inferior but not Giffen, or Giffen Explain.<br />
c. According to your graph, are goods 1 <strong>and</strong> 2 complements or substitutes Explain.<br />
61
7. Below are nine graphs, <strong>and</strong> ten descriptions of the graphs. There is only one way to uniquely map all<br />
nine graphs into all ten descriptions, which is the task at h<strong>and</strong>.<br />
Good 2<br />
PANEL 1<br />
Income<br />
PANEL 2<br />
Price of<br />
Good 1<br />
PANEL 3<br />
Good 1<br />
Good 1<br />
Good 1<br />
Price of<br />
Good 1<br />
PANEL 4<br />
Good 2<br />
PANEL 5<br />
Income<br />
PANEL 6<br />
Good 1<br />
Good 1<br />
Good 1<br />
PANEL 7<br />
PANEL 8<br />
Income Price of<br />
Good 2<br />
Good 1<br />
PANEL 9<br />
Good 1<br />
Good 1<br />
Good 1<br />
Circle the number of the graph that corresponds with the descriptions below.<br />
A st<strong>and</strong>ard budget line…………………………….. 1 2 3 4 5 6 7 8 9 None<br />
A price-consumption curve for normal goods……. 1 2 3 4 5 6 7 8 9 None<br />
An income-consumption curve for normal goods… 1 2 3 4 5 6 7 8 9 None<br />
A dem<strong>and</strong> curve under Cobb-Douglas preferences… 1 2 3 4 5 6 7 8 9 None<br />
A dem<strong>and</strong> curve under perfect complements……… 1 2 3 4 5 6 7 8 9 None<br />
A dem<strong>and</strong> curve under perfect substitutes………… 1 2 3 4 5 6 7 8 9 None<br />
A dem<strong>and</strong> curve for a Giffen good………………… 1 2 3 4 5 6 7 8 9 None<br />
An Engel curve for a necessity……………………. 1 2 3 4 5 6 7 8 9 None<br />
An Engel curve for a normal good………………… 1 2 3 4 5 6 7 8 9 None<br />
An Engel curve for an inferior good………………. 1 2 3 4 5 6 7 8 9 None<br />
62
EXAM #2 – ECON 210: INTERMEDIATE MICRO -- ANSWERS<br />
Professor Lemke<br />
March 9, 2010<br />
1. Consider the Cobb-Douglas utility function: u ( x1,<br />
x2<br />
) = x1<br />
x2<br />
. The price of good 1 is fixed at<br />
$15, while the price of good 2 is fixed at $10. The consumer has a budget of $300.<br />
a. What is the marginal rate of substitution of good 1 for good 2 at the consumption bundle (8, 6)<br />
⎛<br />
MRS = −⎜<br />
⎝<br />
α ⎞⎛<br />
x<br />
2<br />
⎟<br />
1 ⎜<br />
− α ⎠ x1<br />
⎝<br />
⎞ ⎛ 2 / 5 ⎞⎛<br />
6 ⎞<br />
⎟ = −⎜<br />
⎟⎜<br />
⎟ = −<br />
⎠ ⎝ 3 / 5 ⎠⎝<br />
8 ⎠<br />
1<br />
.<br />
2<br />
2 / 5<br />
3/ 5<br />
b. What is the marginal rate of transformation of good 1 for good 2 at the consumption bundle (8,<br />
6)<br />
MRT = −<br />
p<br />
p<br />
1<br />
2<br />
15<br />
= − = −1.5.<br />
10<br />
c. What is the optimal consumption bundle<br />
x<br />
αY<br />
(2 / 5)(300)<br />
= = p 15<br />
*<br />
1 =<br />
1<br />
8.<br />
x<br />
(1 − α)<br />
Y<br />
=<br />
p<br />
(3 / 5)(300)<br />
=<br />
10<br />
*<br />
2 =<br />
2<br />
18.<br />
2. Consider a consumer whose preference can be described by the following utility function:<br />
{ 3x<br />
}<br />
u ( x = x .<br />
1 , x 2 ) min 1 ,<br />
a. Write the optimal dem<strong>and</strong> for x 1 <strong>and</strong> x 2 as a function of prices <strong>and</strong> income.<br />
Given the utility function, a = 1/3 <strong>and</strong> b = 1 meaning that the consumer must consume onethird<br />
unit of good 1 with one unit of good 2. Optimal dem<strong>and</strong>s, therefore, are:<br />
x<br />
*<br />
1<br />
aY Y / 3 Y<br />
= =<br />
= <strong>and</strong><br />
ap + bp ( p / 3) + p p + 3p<br />
1<br />
1<br />
2<br />
2<br />
1<br />
* bY Y 3Y<br />
x2<br />
= =<br />
= .<br />
ap + bp ( p / 3) + p p + 3p<br />
1<br />
2<br />
2<br />
2<br />
1<br />
1<br />
2<br />
2<br />
63
. Assume the price of good 1 is $30 <strong>and</strong> income is $60. Provide <strong>and</strong> graph the inverse dem<strong>and</strong><br />
function for good 2.<br />
Given p 1 = 30 <strong>and</strong> Y = 60, dem<strong>and</strong> for good 2 is<br />
x<br />
*<br />
2<br />
= 3(60)<br />
30 + 3p<br />
. Solving this for p yields 2<br />
2<br />
60<br />
p 2 = −10<br />
. x<br />
Graphing the inverse dem<strong>and</strong> curve for good 2, we have:<br />
Price of<br />
Good 2<br />
Dem<strong>and</strong> Curve for Good 2<br />
2<br />
6 Good 2<br />
c. Assume the price of good 1 is $30 <strong>and</strong> the price of good 2 is $5. Provide <strong>and</strong> graph the Engel<br />
curve for good 2.<br />
* 3Y<br />
3Y<br />
Y<br />
Given p 1 = 30 <strong>and</strong> p 2 = 5, dem<strong>and</strong> for good 2 is x 2 = = = . Solving this for Y<br />
30 + 3(5) 45 15<br />
yields Y = 15x 2 . Graphing the Engel curve for good 2, we have:<br />
Income<br />
Engel Curve for Good 2<br />
Slope = 15<br />
Good 2<br />
64
3. When shopping for her family, Claire treats kiwis (k) <strong>and</strong> mangos (m) as perfect substitutes, where<br />
five kiwis can substitute for two mangos (<strong>and</strong> likewise, two mangos can substitute for five kiwis).<br />
Thus, one utility function that represents Claire’s preferences is<br />
u(k, m) = 0.2k + 0.5m.<br />
a. What is Claire’s dem<strong>and</strong> function for kiwis when her budget is $30 <strong>and</strong> the price of each mango<br />
is $0.80. Graph this dem<strong>and</strong> function.<br />
Dem<strong>and</strong> depends on relative prices. Five kiwis cost 5p k . Two mangos cost 2p m = 2 × $0.80 =<br />
$1.60. Therefore, Claire spends all of her budget on kiwis as long as 5p k < 1.60, which requires<br />
p k < $0.32. If the price of each kiwi is greater than $0.32, Claire will not buy any kiwis.<br />
Therefore, her dem<strong>and</strong> curve for kiwis is:<br />
Graphing this function, we have:<br />
⎧ 30<br />
⎪ if<br />
p<br />
⎪<br />
k<br />
k * = ⎨<br />
⎪ 0 if<br />
⎪<br />
⎩<br />
pk<br />
< 0.32<br />
p > 0.32<br />
Dem<strong>and</strong> Curve for Kiwis<br />
k<br />
Price of<br />
Kiwis<br />
$0.32<br />
Kiwis<br />
b. What is Claire’s Engel curve for kiwis when the price of each kiwi is $0.20 <strong>and</strong> the price of each<br />
mango is $0.80. Graph this Engel curve.<br />
As p k = $0.20, which is less than $0.32, Claire spends her entire budget on kiwis. Therefore, k* =<br />
Y/p k = Y/0.20 = 5Y. Solving for Y we have Y = 0.20k. Graphing this:<br />
Income<br />
Engel Curve for Kiwi<br />
Slope = $0.20<br />
Kiwi<br />
65
c. What is the Claire’s optimal dem<strong>and</strong> when her budget is $20, the price of each kiwi is $0.20, <strong>and</strong><br />
the price of each mango is $0.80.<br />
As the price of kiwis is less than $0.32, Claire spends her entire budget on kiwis. Therefore,<br />
with a budget of $20, Claire buys k* = 20/0.2 = 100 kiwis <strong>and</strong> m* = 0 mangos.<br />
4. When asked why she supported exp<strong>and</strong>ing the Earned Income Tax Credit (EITC) but did not support<br />
offering a lump-sum transfer as policy to help the poor, a famous economist responded “Because the<br />
lump-sum transfer is not associated with a substitution effect, but the EITC is.” Explain what the<br />
economist meant by this <strong>and</strong> why this led her to have a policy preference for the EITC but not for the<br />
lump-sum transfer.<br />
A substitution effect, in terms of labor supply, only occurs when the price of leisure (i.e., the wage<br />
rate) changes. As a lump-sum transfer doesn’t affect the wage rate, it cannot be associated with a<br />
substitution effect. As a result, a lump-sum transfer is only associated with an income effect, which<br />
would lead a person to want to leisure more (<strong>and</strong> work less). Alternatively, the EITC is associated<br />
with a 40% wage subsidy, which essentially increases one’s wage by 40%. Thus, the EITC is<br />
associated with a substitution effect. In particular:<br />
↑ wage subsidy → ↑ wage rate → ↑ price of leisure → ↓ leisure (& ↑ hours worked).<br />
Ultimately, the economist prefers exp<strong>and</strong>ing the EITC over offering a lump-sum transfer, because<br />
exp<strong>and</strong>ing the EITC may encourage more people to start working while offering a lump-sum transfer<br />
will never have a positive effect on employment.<br />
5. Assuming consumption today <strong>and</strong> consumption tomorrow are both normal goods, we showed in class<br />
that a reduction in the capital gains tax rate could result in greater or less savings today. Explain or<br />
reproduce this result. Be thorough <strong>and</strong> careful.<br />
The tax change has the following effects:<br />
↓ capital gains tax rate → ↑ real interest rate → ↓ price of consumption tomorrow.<br />
Given the decrease in the price of consumption tomorrow, we have:<br />
(SE) ↓ price of consumption tomorrow → ↓ consumption today, ↑ consumption tomorrow.<br />
(IE) ↓ price of consumption tomorrow → ↑ consumption today <strong>and</strong> ↑ consumption tomorrow as both<br />
are normal goods.<br />
Now, one must look at consumption today to see what happens to savings. According to the<br />
substitution effect, consumption today falls, so savings increases. However, according to the income<br />
effect, consumption today increases, so savings decreases. Thus, as the effect on saving is<br />
ambiguous, it is unclear whether a lowering of the capital gains tax rate would increase or decrease<br />
savings.<br />
66
6. The following graph shows optimal choice following an increase in the price of good 1. All items<br />
before the price increase are labeled with a superscript 0, while all items following the price increase<br />
are labeled with a superscript 1. All items are labeled as we labeled them in class.<br />
Good 2<br />
IC 1<br />
1<br />
x 2<br />
SE<br />
x 2<br />
●<br />
●<br />
x 2<br />
0<br />
●<br />
TE<br />
IC 0 BL 1<br />
IE<br />
SE<br />
BL H<br />
BL 0<br />
x 1<br />
1<br />
x 1<br />
SE<br />
x 1<br />
0<br />
Good 1<br />
a. On the graph, draw in the hypothetical budget line <strong>and</strong> clearly label the substitution, income,<br />
<strong>and</strong> total effects for good 1 from the price increase.<br />
The optimal point on the hypothetical budget line ( x 1 ) must be on IC 0 up <strong>and</strong> to the left<br />
from the original optimal bundle. From there, the substitution effect is from the origin al<br />
0 SE<br />
point, x 1 , to x 1 . The income effect if from x SE 1 to x 1 1 .<br />
b. According to your graph, is good 1 normal, inferior but not Giffen, or Giffen Explain.<br />
As drawn above (<strong>and</strong> as it would be drawn by almost anyone), good 1 is normal because the<br />
SE 1<br />
income effect goes in the same direction as the substitution effect. That is, from x 1 to x 1 ,<br />
all that is happening is that income is being reduced, <strong>and</strong> optimal dem<strong>and</strong> for good 1 is also<br />
falling. This is what is required for a good to be normal.<br />
c. According to your graph, are goods 1 <strong>and</strong> 2 complements or substitutes Explain.<br />
According to the graph, quantity dem<strong>and</strong>ed of good 2 increased when the price of good 1<br />
increased. This is the definition of goods 1 <strong>and</strong> 2 being substitutes.<br />
SE<br />
67
7. Below are nine graphs, <strong>and</strong> ten descriptions of the graphs. There is only one way to uniquely map all<br />
nine graphs into all ten descriptions, which is the task at h<strong>and</strong>.<br />
Good 2<br />
PANEL 1<br />
Income<br />
PANEL 2<br />
Price of<br />
Good 1<br />
PANEL 3<br />
Good 1<br />
Good 1<br />
Good 1<br />
Price of<br />
Good 1<br />
PANEL 4<br />
Good 2<br />
PANEL 5<br />
Income<br />
PANEL 6<br />
Good 1<br />
Good 1<br />
Good 1<br />
PANEL 7<br />
PANEL 8<br />
Income Price of<br />
Good 2<br />
Good 1<br />
PANEL 9<br />
Good 1<br />
Good 1<br />
Good 1<br />
a. A st<strong>and</strong>ard budget line…………………………….. 1 2 3 4 5 6 7 8 9 None<br />
b. A price-consumption curve for normal goods……. 1 2 3 4 5 6 7 8 9 None<br />
c. An income-consumption curve for normal goods… 1 2 3 4 5 6 7 8 9 None<br />
d. A dem<strong>and</strong> curve under Cobb-Douglas preferences… 1 2 3 4 5 6 7 8 9 None<br />
e. A dem<strong>and</strong> curve under perfect complements……… 1 2 3 4 5 6 7 8 9 None<br />
f. A dem<strong>and</strong> curve under perfect substitutes………… 1 2 3 4 5 6 7 8 9 None<br />
g. A dem<strong>and</strong> curve for a Giffen good………………… 1 2 3 4 5 6 7 8 9 None<br />
h. An Engel curve for a necessity……………………. 1 2 3 4 5 6 7 8 9 None<br />
i. An Engel curve for a normal good………………… 1 2 3 4 5 6 7 8 9 None<br />
j. An Engel curve for an inferior good……………. 1 2 3 4 5 6 7 8 9 None<br />
68
EXAM #3 – ECON 210: INTERMEDIATE MICRO<br />
Professor Lemke<br />
April 15, 2011<br />
1. A firm’s production function is f(K, L) = 20K 1/4 L 5/4 . Each unit of capital costs the firm $2,000, while<br />
each unit of labor costs the firm $24,000.<br />
a. Does the firm experience increasing, constant, or decreasing returns to scale How do you know<br />
b. In terms of K <strong>and</strong> L, what is the firm’s marginal rate of technical substitution<br />
c. Graph the firm’s $60,000 isocost line.<br />
d. If the firm maximizes profit by employing capital to the point where the marginal product of<br />
capital is 480, what is the marginal product of the optimal amount of labor the firm employs<br />
2. VisCom Industrial, better known as VCI, sells color printer cartridges in a perfectly competitive<br />
market. Presently the price of color printer cartridges is $45 per cartridge. VCI’s cost function is<br />
C(q) = 25,000 + 5q + 0.02q 2 where q is the number of cartridges that VCI manufactures. How many<br />
cartridges should VCI manufacture <strong>and</strong> sell in order to maximize its short run profits (Provide a<br />
complete answer!)<br />
3. Market dem<strong>and</strong> for a good is Q = 1,200 – 5p.<br />
a. When the industry is controlled be a monopolist, the cost function is C(q) = 4,000 + 0.1q 2 . What<br />
is the firm’s marginal cost function<br />
b. The monopolist chooses its output to maximize profits. How much output will the monopolist<br />
choose to sell At what price will it sell each unit of output How much profit will the<br />
monopolist earn each period<br />
c. Suppose instead that the market is perfectly competitive. (Assume the monopolist’s marginal<br />
cost function is the now the industry supply curve.) How many units of output will be produced<br />
in the entire industry under perfect competition At what price will each unit of output sell<br />
d. How much dead-weight loss is associated with monopoly (part b) compared to perfect<br />
competition (part c) for this industry<br />
4. Consider a market with no externalities. According to our statement of the First Welfare Theorem,<br />
therefore, we are considering a market in which consumers <strong>and</strong> firms “take into account all social<br />
costs <strong>and</strong> benefits when valuing the consumption <strong>and</strong> production of goods.”<br />
a. Draw a picture of an efficient market, labeling consumer surplus <strong>and</strong> producer surplus. What is it<br />
about this picture (in particular, what is missing from this picture) that indicates the market is<br />
efficient<br />
b. Draw a picture of a market with a price floor. Indicate all of the important welfare concepts.<br />
What is it about this picture that indicates the market is inefficient<br />
c. The picture you drew in part b looks very much like the picture one draws for monopoly.<br />
However, in class it was claimed that producer surplus under a price floor may or may not be<br />
greater than producer surplus under competition but that producer surplus under a monopolistic<br />
market had to be greater than producer surplus under a competitive market. Explain this claim.<br />
69
5. Soybeans are sold in a perfectly competitive industry. The industry is presently in long-run<br />
equilibrium. In the present equilibrium, the following hold (along with the variable representation):<br />
the price of soybeans is $5 per bushel (p = $5), there are 5,000 soybean farmers (N = 5,000), each<br />
soybean farmer produces 40,000 bushels (q = 40,000), 200 million bushels of soybeans are produced<br />
in total (Q = 200 million), <strong>and</strong> each firm receives $0 profits (π = $0).<br />
a. A negative finding regarding the health risks of soybeans then leads to an immediate <strong>and</strong><br />
permanent decrease in the market dem<strong>and</strong> for soybeans. For each of the five variables, indicate<br />
(by circling your answer) which value might come about in the short run in response to the<br />
negative dem<strong>and</strong> shock. (Circle only one value per variable.)<br />
Short-Run Variable Values<br />
Price = p $4 $5 $6<br />
Number of Firms = N 4,000 5,000 6,000<br />
Firm quantity = q 38,000 40,000 42,000<br />
Industry quantity = Q 190 million 200 million 210 million<br />
Firm profits = π –$12,000 $0 $12,000<br />
b. For each of the five variables, indicate (by circling your answer) which value might come about<br />
in the long run following the dem<strong>and</strong> shock. (Circle only one value per variable.)<br />
Long-Run Variable Values<br />
Price = p $4 $5 $6<br />
Number of Firms = N 4,000 5,000 6,000<br />
Firm quantity = q 38,000 40,000 42,000<br />
Industry quantity = Q 160 million 200 million 240 million<br />
Firm profits = π –$12,000 $0 $12,000<br />
c. Following the eventual return to long-run equilibrium, another shock occurs, <strong>and</strong> after the market<br />
for soybeans works through that shock, long-run equilibrium is once again obtained. This time,<br />
however, the price of a bushel of soybeans is now $2 per bushel. Which of the following shocks<br />
could have caused this long-run change, <strong>and</strong> why: an increase in the dem<strong>and</strong> for soybeans; an<br />
increase in the price of soybean seeds; a decrease in the cost of farm workers; a technological<br />
advancement in the fertility of soybean seeds<br />
70
EXAM #3 ANSWERS<br />
Professor Lemke<br />
April 15, 2011<br />
1. A firm’s production function is f(K, L) = 20K 1/4 L 5/4 . Each unit of capital costs the firm $2,000, while<br />
each unit of labor costs the firm $24,000.<br />
a. Does the firm experience increasing, constant, or decreasing returns to scale How do you know<br />
The firm experiences increasing returns to scale because the production function is a Cobb-<br />
Douglas production function in which the exponents sum to greater than 1. In particular, the<br />
exponents are 1/4 <strong>and</strong> 5/4, which sum to 1.5.<br />
b. In terms of K <strong>and</strong> L, what is the firm’s marginal rate of technical substitution<br />
We know from the notes that for a Cobb Douglass production function f(K, L) = AK α L β is :<br />
βK<br />
MRTS = − α L<br />
c. Graph the firm’s $60,000 isocost line.<br />
⎛ 5K<br />
⎞<br />
⎜ ⎟<br />
4 5K<br />
= −<br />
⎝ ⎠<br />
= −<br />
⎛1L<br />
⎞ L<br />
⎜ ⎟<br />
⎝ 4 ⎠<br />
.<br />
As $60,000 can purchase 2.5 = $60,000/$24,000 units of labor or 30 = $60,000/$2,000 units of<br />
capital, the $60,000 isocost line is:<br />
Capital<br />
30<br />
$60,000 Isocost Line<br />
2.5 Labor<br />
d. If the firm maximizes profit by employing capital to the point where the marginal product of<br />
capital is 480, what is the marginal product of the optimal amount of labor the firm employs<br />
Profit maximization requires<br />
MP<br />
w<br />
L<br />
MPk<br />
MPL<br />
480<br />
= ⇒ = ⇒ MPL<br />
r 24,000 2,000<br />
= 5,760 .<br />
Thus, at these factor prices, if the firm employs capital to the point where the marginal product of<br />
capital is 480, it will employ labor to the point where the marginal product of labor is 5,760.<br />
71
2. VisCom Industrial, better known as VCI, sells color printer cartridges in a perfectly competitive<br />
market. Presently the price of color printer cartridges is $45 per cartridge. VCI’s cost function is<br />
C(q) = 25,000 + 5q + 0.02q 2 where q is the number of cartridges that VCI manufactures. How many<br />
cartridges should VCI manufacture <strong>and</strong> sell in order to maximize its short run profits (Provide a<br />
complete answer!)<br />
As it is a perfectly competitive industry <strong>and</strong> price equals $45, VCI’s marginal revenue equals $45. As<br />
VCI’s cost function is C(q) = 25,000 + 5q + 0.02q 2 , its marginal cost function is MC(q) = 5 + 0.04q.<br />
So now, to maximize profits:<br />
Step 1. Set MR = MC to solve for q*.<br />
MR = MC<br />
45 = 5 + 0.04q<br />
0.04q = 40<br />
q* = 1,000 cartridges.<br />
Step 2. Because the market is perfectly competitive, we know that p* = $45 per cartridge.<br />
Step 3. At q* = 1,000 <strong>and</strong> p* = $45, VCI’s revenues are R(1,000) = 1,000 × $45 = $45,000. At<br />
the same time, VCI’s total costs are C(1,000) = 25,000 + 5(1,000) + 0.02(1,000) 2 =<br />
$50,000. Therefore VCI’s profits, when it produces 1,000 color printer cartridges is<br />
π(1,000) = R(1,000) – C(1,000) = $45,000 – $50,000 = –$5,000.<br />
Step 4.<br />
As profit is negative, the shut-down rule must be checked. If the firm stays open, it will<br />
produce 1,000 cartridges <strong>and</strong> lose $5,000 in profit. If the firm shuts down, it produces 0<br />
cartridges <strong>and</strong> loses its fixed costs of $25,000. As VCI would rather lose $5,000 than<br />
lose $25,000, VCI will opt to remain open, produce 1,000 cartridges, <strong>and</strong> earn –$5,000 in<br />
profit.<br />
72
3. Market dem<strong>and</strong> for a good is Q = 1,200 – 5p.<br />
a. When the industry is controlled be a monopolist, the cost function is C(q) = 4,000 + 0.1q 2 . What<br />
is the firm’s marginal cost function<br />
The firm’s marginal cost function is MC(q) = 0.2q.<br />
b. The monopolist chooses its output to maximize profits. How much output will the monopolist<br />
choose to sell At what price will it sell each unit of output How much profit will the<br />
monopolist earn each period<br />
The monopolist faces market dem<strong>and</strong>, so 5p = 1,200 – q so that p = 240 – 0.2q. Therefore the<br />
monopolist’s marginal revenue is MR = 240 – 0.4q.<br />
Setting MR = MC to find Q* MON :<br />
240 – 0.4q = 0.2q<br />
0.6q = 240<br />
Q* MON = q* = 400.<br />
Therefore, p* MON = 240 – 0.2(400) = $160. The monopolist’s revenue is R(400) = 400 × $160 =<br />
$64,000. The monopolist’s costs are C(400) = 4,000 + 0.1(400) 2 = $20,000. Therefore, the<br />
monopolist’s profits each period are π(400) = R(400) – C(400) = $64,000 – $20,000 = $44,000.<br />
Note, for part d below, that the firm’s marginal cost when making 400 units of output is<br />
MC(400) = 0.2(400) = $80.<br />
c. Suppose instead that the market is perfectly competitive. (Assume the monopolist’s marginal<br />
cost function is the now the industry supply curve.) How many units of output will be produced<br />
in the entire industry under perfect competition At what price will each unit of output sell<br />
Under perfect competition, price equals marginal cost:<br />
At Q* PC = 600, p* PC = 240 – 0.2(600) = $120.<br />
p = MC<br />
240 – 0.2Q = 0.2Q<br />
0.4Q = 240<br />
Q* PC = 600<br />
d. How much dead-weight loss is associated with monopoly (part b) compared to perfect<br />
competition (part c) for this industry<br />
Given the above results, we have:<br />
DWL = (½)(p* MON – MC(Q* MON ))(Q* PC – Q* MON ) = (½)($160 – $80)(600 – 400) = $8,000.<br />
73
4. Consider a market with no externalities. According to our statement of the First Welfare Theorem,<br />
therefore, we are considering a market in which consumers <strong>and</strong> firms “take into account all social<br />
costs <strong>and</strong> benefits when valuing the consumption <strong>and</strong> production of goods.”<br />
a. Draw a picture of an efficient market, labeling consumer surplus <strong>and</strong> producer surplus. What is it<br />
about this picture that indicates the market is efficient<br />
The market below is efficient because there is no dead-weight loss.<br />
Efficient Market<br />
$ Supply<br />
p*<br />
CS<br />
PS<br />
Q* Quantity<br />
Dem<strong>and</strong><br />
b. Draw a picture of a market with a price floor. Indicate all of the important welfare concepts.<br />
What is it about this picture that indicates the market is inefficient<br />
The market below is inefficient because of the existence of dead-weight loss.<br />
Price Floor<br />
$ Supply<br />
DWL<br />
CS<br />
Price Floor<br />
p Floor<br />
PS<br />
Dem<strong>and</strong><br />
Q Floor Q*<br />
Quantity<br />
c. The picture you drew in part b looks very much like the picture one draws for monopoly.<br />
However, in class it was claimed that producer surplus under a price floor may or may not be<br />
greater than producer surplus under competition but that producer surplus under a monopolistic<br />
market had to be greater than producer surplus under a competitive market. Explain this claim.<br />
When the government imposes a price floor, it does not necessarily do it in such a way that helps<br />
firms. (Think if it set the price floor of a gallon of milk to $5,000. This certainly would not help<br />
dairy farmers.) However, when the market is controlled by a monopolist, the monopolist chooses<br />
the price that maximizes its profits. Therefore it must be that profits are greater under the<br />
monopoly price than under the competitive price. Moreover, we showed in class that maximizing<br />
profits is the same as maximizing producer surplus, so as we know that profits are maximized<br />
under the monopoly price, producer surplus must also be maximized under that price. Therefore<br />
we know that producer surplus is greater under monopoly than under competition.<br />
74
5. Soybeans are sold in a perfectly competitive industry. The industry is presently in long-run<br />
equilibrium. In the present equilibrium, the following hold (along with the variable representation):<br />
the price of soybeans is $5 per bushel (p = $5), there are 5,000 soybean farmers (N = 5,000), each<br />
soybean farmer produces 40,000 bushels (q = 40,000), 200 million bushels of soybeans are produced<br />
in total (Q = 200 million), <strong>and</strong> each firm receives $0 profits (π = $0).<br />
a. A negative finding regarding the health risks of soybeans then leads to an immediate <strong>and</strong><br />
permanent decrease in the market dem<strong>and</strong> for soybeans.<br />
Short-Run Variable Values<br />
Price = p $4 $5 $6 Price falls due to the negative dem<strong>and</strong> shock.<br />
Number of Firms = N 4,000 5,000 6,000 Firms cannot exit (or enter) in the short run.<br />
Firm quantity = q 38,000 40,000 42,000 Existing firms produce less when the price falls.<br />
Industry quantity = Q 190 mil 200 mil 210 mil<br />
Less is produced in the industry, because each firm<br />
produces less.<br />
Firm profits = π –$12,000 $0 $12,000<br />
Firms lose money in the short run because price<br />
falls.<br />
b. Return to the long run following the dem<strong>and</strong> shock.<br />
Long-Run Variable Values<br />
Price = p $4 $5 $6<br />
Following a dem<strong>and</strong> shock, the long-run price<br />
returns to the original long-run price.<br />
Number of Firms = N 4,000 5,000 6,000 Firms exit in the long run due to short-run neg π.<br />
Firm quantity = q 38,000 40,000 42,000 Firm quantity returns to the original q MES output.<br />
Industry quantity = Q 160 mil 200 mil 240 mil Total industry output falls b/c some firms exited.<br />
Firm profits = π –$12,000 $0 $12,000 Perf. Comp. firm profits always equal $0 in the LR.<br />
c. Following the eventual return to long-run equilibrium, another shock occurs, <strong>and</strong> after the market<br />
for soybeans works through that shock, long-run equilibrium is once again obtained. This time,<br />
however, the price of a bushel of soybeans is now $2 per bushel. Which of the following shocks<br />
could have caused this long-run change, <strong>and</strong> why: an increase in the dem<strong>and</strong> for soybeans; an<br />
increase in the price of soybean seeds; a decrease in the cost of farm workers; a technological<br />
advancement in the fertility of soybean seeds<br />
A decrease in the long-run competitive price cannot come about from a dem<strong>and</strong> shock (ruling out the<br />
first). An increase in a factor price would increase, not decrease, the long-run price (ruling out the<br />
second). The third is a possibility – when the price of a factor of production falls, the cost function falls<br />
<strong>and</strong> in particular the minimum average cost must fall. As long-run price equals the minimum average<br />
cost, such a change could cause a decrease in the long-run price (making the third shock a possibility).<br />
The fourth is also a possibility – a technological advancement is reflected by an improved cost function,<br />
<strong>and</strong> in particular by a lower minimum average cost. As long-run price equals the minimum average cost,<br />
such advancement could cause a decrease in the long-run price (making the fourth shock a possibility).<br />
75
EXAM #3 – ECON 210: INTERMEDIATE MICRO<br />
Professor Lemke<br />
April 16, 2011<br />
1. A firm’s production function is f(K, L) = 20K 1/4 L 5/4 . Each unit of capital costs the firm $2,000, while<br />
each unit of labor costs the firm $24,000.<br />
a. Does the firm experience increasing, constant, or decreasing returns to scale How do you know<br />
b. In terms of K <strong>and</strong> L, what is the firm’s marginal rate of technical substitution<br />
c. Graph the firm’s $60,000 isocost line.<br />
d. If the firm maximizes profit by employing capital to the point where the marginal product of<br />
capital is 480, what is the marginal product of the optimal amount of labor the firm employs<br />
Hint: There is an easy way <strong>and</strong> a hard way to get this answer. I would suggest doing it the easy<br />
way, but if you don’t see that way, the hard way with brute force mathematics will work.<br />
2. VisCom Industrial, better known as VCI, sells color printer cartridges in a perfectly competitive<br />
market. Presently the price of color printer cartridges is $45 per cartridge. VCI’s cost function is<br />
C(q) = 28,800 + 5q + 0.02q 2 where q is the number of cartridges that VCI manufactures.<br />
a. How many cartridges should VCI manufacture <strong>and</strong> sell in order to maximize its short run<br />
profits Provide a complete answer!<br />
b. What will be the long-run price of color printer cartridges <strong>and</strong> how many cartridges will each<br />
firm produce Hint: This takes a bit of thinking <strong>and</strong> math to figure out.<br />
3. A firm faces an inverse dem<strong>and</strong> function of p = 240 – 0.2q. The firm’s cost function is<br />
C(q) = 4,000 + 0.1q 2 . How much output will the firm choose to sell in the short run in order to<br />
maximize its profits At what price will it sell each unit of output How much profit will the firm<br />
earn in the short run<br />
4. In class, we drew a picture that represented the “Gains to Trade” from having free trade when the<br />
domestic country would be a net importer of the good.<br />
a. Draw a similar graph of the domestic market under free trade when the domestic country<br />
would be a net exporter of the good. Indicate the areas associated with consumer surplus,<br />
producer surplus, <strong>and</strong> gains to trade. (Hint: I am willing to give you a hint on this problem<br />
for 2 points. Call me over or come to my desk for the hint.)<br />
b. Draw a new graph (similar to part a) of the domestic market assuming the domestic<br />
government taxes domestic producers t for each unit of the good that they export. Indicate<br />
the areas associated with consumer surplus, producer surplus, tax revenue, <strong>and</strong> dead-weight<br />
loss.<br />
5. A firm’s production function is f(K, L) = min{ 4K, 0.2L}. What is the firm’s cost function if the price<br />
of each unit of capital is $40 <strong>and</strong> the price of each unit of labor is $12<br />
6. A firm’s cost function is C(q) = 5q + 3q 2 .<br />
a. Algebraically solve for F, VC(q), AC(q), AVC(q), <strong>and</strong> MC(q).<br />
b. Graph AC(q), AVC(q), <strong>and</strong> MC(q) as accurately as possible on the same graph.<br />
c. Given this cost function, under what condition(s) on price will the firm shut down in the short<br />
run Under what condition(s) on price will the firm exit in the long run<br />
76
7. Soybeans are sold in a perfectly competitive industry. The industry is presently in long-run<br />
equilibrium. In the present equilibrium, the following hold:<br />
• The price of soybeans is $5 per bushel: p = $5.<br />
• There are 5,000 soybean farmers: N = 5,000.<br />
• Each soybean farmer produces 40,000 bushels: q = 40,000.<br />
• Total production equals 200 million bushels of soybeans: Q = 200 million.<br />
• Each firm receives $0 profits: π = $0.<br />
Then suppose a negative finding regarding the health risks of soybeans leads to an immediate <strong>and</strong><br />
permanent decrease in the market dem<strong>and</strong> for soybeans.<br />
To answer the questions below, you can draw a graph if you want though a graph is not required <strong>and</strong><br />
a graph by itself is not sufficient to answer the question. You need to explain in words how things<br />
change.<br />
a. Indicate how each of the variables listed above changes (if at all) in the short run. When possible,<br />
give a precise number for the variable. For example, in a situation in which the price of soybeans<br />
doesn’t change, you could write, “The price of soybeans is unaffected by the dem<strong>and</strong> shock, so p<br />
= $5.” Of course, if the price of soybeans increases to an unknown price, you would write “The<br />
price of soybeans increases because of the dem<strong>and</strong> shock, so p > $5.”<br />
b. Indicate the long-run value for each of the five variables indicated above in relation to the original<br />
long-run equilibrium. Again, if possible, specify the actual number the variable will take on.<br />
c. Following the eventual return to long-run equilibrium, another shock occurs, <strong>and</strong> after the market<br />
for soybeans works through that shock, long-run equilibrium is once again obtained. This time,<br />
however, the price of a bushel of soybeans is now $2 per bushel. Which of the following shocks<br />
could <strong>and</strong> could not have caused this long-run change, <strong>and</strong> why:<br />
i. A decrease in the cost of farm workers.<br />
ii. An increase in the dem<strong>and</strong> for soybeans<br />
iii. An increase in the price of soybean seeds.<br />
iv. A technological advancement in the fertility of soybean seeds.<br />
77
EXAM #3 ANSWERS – ECON 210: INTERMEDIATE MICRO<br />
Professor Lemke<br />
April 16, 2012<br />
1. A firm’s production function is f(K, L) = 20K 1/4 L 5/4 . Each unit of capital costs the firm $2,000, while<br />
each unit of labor costs the firm $24,000.<br />
a. Does the firm experience increasing, constant, or decreasing returns to scale How do you know<br />
The firm experiences increasing returns to scale because the production function is a Cobb-<br />
Douglas production function in which the exponents sum to greater than 1. In particular, the<br />
exponents are 1/4 <strong>and</strong> 5/4, which sum to 1.5.<br />
b. In terms of K <strong>and</strong> L, what is the firm’s marginal rate of technical substitution<br />
We know from the notes that for a Cobb Douglass production function f(K, L) = AK α L β is :<br />
βK<br />
MRTS = − α L<br />
c. Graph the firm’s $60,000 isocost line.<br />
⎛ 5K<br />
⎞<br />
⎜ ⎟<br />
4 5K<br />
= −<br />
⎝ ⎠<br />
= −<br />
⎛1L<br />
⎞ L<br />
⎜ ⎟<br />
⎝ 4 ⎠<br />
.<br />
As $60,000 can purchase 2.5 = $60,000/$24,000 units of labor or 30 = $60,000/$2,000 units of<br />
capital, the $60,000 isocost line is:<br />
Capital<br />
30<br />
$60,000 Isocost Line<br />
2.5 Labor<br />
d. If the firm maximizes profit by employing capital to the point where the marginal product of<br />
capital is 480, what is the marginal product of the optimal amount of labor the firm employs<br />
Profit maximization requires<br />
MP<br />
w<br />
L<br />
MPk<br />
MPL<br />
480<br />
= ⇒ = ⇒ MPL<br />
r 24,000 2,000<br />
= 5,760 .<br />
Thus, at these factor prices, if the firm employs capital to the point where the marginal product of<br />
capital is 480, it will employ labor to the point where the marginal product of labor is 5,760.<br />
78
2. VisCom Industrial, better known as VCI, sells color printer cartridges in a perfectly competitive<br />
market. Presently the price of color printer cartridges is $45 per cartridge. VCI’s cost function is<br />
C(q) = 28,800 + 5q + 0.02q 2 where q is the number of cartridges that VCI manufactures.<br />
a. How many cartridges should VCI manufacture <strong>and</strong> sell in order to maximize its short run<br />
profits Provide a complete answer!<br />
As it is a perfectly competitive industry <strong>and</strong> price equals $45, VCI’s marginal revenue equals<br />
$45. As VCI’s cost function is C(q) = 28,800 + 5q + 0.02q 2 , its marginal cost function is<br />
MC(q) = 5 + 0.04q. So now, to maximize profits:<br />
Step 1. Set MR = MC to solve for q*.<br />
MR = MC<br />
45 = 5 + 0.04q<br />
0.04q = 40<br />
q* = 1,000 cartridges.<br />
Step 2. Because the market is perfectly competitive, we know that p* = $45 per cartridge.<br />
Step 3. At q* = 1,000 <strong>and</strong> p* = $45, VCI’s revenues are R(1,000) = 1,000 × $45 = $45,000. At<br />
the same time, VCI’s total costs are C(1,000) = 28,800 + 5(1,000) + 0.02(1,000) 2 =<br />
$53,800. Therefore VCI’s profits, when it produces 1,000 color printer cartridges is<br />
π(1,000) = R(1,000) – C(1,000) = $45,000 – $53,800 = –$8,800.<br />
Step 4.<br />
As profit is negative, the shut-down rule must be checked. If the firm stays open, it will<br />
produce 1,000 cartridges <strong>and</strong> lose $8,800 in profit. If the firm shuts down, it produces 0<br />
cartridges <strong>and</strong> loses its fixed costs of $28,800. As VCI would rather lose $8,800 than<br />
lose $28,800, VCI will opt to remain open, produce 1,000 cartridges, <strong>and</strong> earn –$8,800.<br />
b. What will be the long-run price of color printer cartridges <strong>and</strong> how many cartridges will each<br />
firm produce Hint: this takes a bit of math to figure out.<br />
In the long run, we know that a perfectly competitive industry results in p = MC = min AC.<br />
We already have that MC = 5 + 0.04q. Using the cost function, we see that<br />
C(<br />
q)<br />
28,<br />
800 5q<br />
0.<br />
02q<br />
28,<br />
800<br />
AC = = + + = + 5 + 0.<br />
02q<br />
.<br />
q q q q q<br />
28,<br />
800<br />
Setting these two equations equal to one another yields + 5 + 0.<br />
02q<br />
= 5 + 0.<br />
04q<br />
.<br />
q<br />
Grouping <strong>and</strong> isolating q yields 0.02q 2 = 28,800. Thus, q 2 = 1,440,000, or q* = 1,200. At a<br />
quantity of 1,200, the firm’s marginal cost is 5 + 0.04(1,200) = $53. Finally, we have the<br />
answer: the long-run price for a bushel of soybeans is $53, at which price each soybean<br />
farmer makes 1,200 bushels of soybeans.<br />
2<br />
79
3. A firm faces an inverse dem<strong>and</strong> function of p = 240 – 0.2q. The firm’s cost function is<br />
C(q) = 4,000 + 0.1q 2 . How much output will the firm choose to sell in the short run to maximize its<br />
profits At what price will it sell each unit of output How much profit will the firm earn in the short<br />
run<br />
The firm’s marginal revenue is MR = 240 – 0.4q. The firm’s marginal cost curve is also easily<br />
determined: MC(q) = 0.2q. Setting MR = MC to find q*:<br />
240 – 0.4q = 0.2q<br />
0.6q = 240<br />
q* = 400.<br />
Therefore, p* = 240 – 0.2(400) = $160. The firm’s revenue is R(400) = 400 × $160 = $64,000. The<br />
firm’s costs are C(400) = 4,000 + 0.1(400) 2 = $20,000. Therefore, the firm’s profits each period are<br />
π(400) = R(400) – C(400) = $64,000 – $20,000 = $44,000.<br />
4. In class, we drew a picture that represented the “Gains to Trade” from having free trade when the<br />
domestic country would be a net importer of the good.<br />
a. Draw a similar graph of the domestic market under free trade when the domestic country<br />
would be a net exporter of the good. Indicate the areas associated with consumer surplus,<br />
producer surplus, <strong>and</strong> gains to trade.<br />
The graph is too difficult to draw in Word.<br />
b. Draw a graph of the domestic market assuming the domestic government taxes domestic<br />
producers t for each unit of the good that they export. Indicate the areas associated with<br />
consumer surplus, producer surplus, tax revenue, <strong>and</strong> dead-weight loss.<br />
The graph is too difficult to draw in Word.<br />
5. A firm’s production function is f(K, L) = min{ 4K, 0.2L}. What is the firm’s cost function if the price<br />
of each unit of capital is $40 <strong>and</strong> the price of each unit of labor is $12<br />
As this production function represents fixed factors, we know that there will be a constant marginal<br />
cost for all units of production. We will figure out this marginal cost in two different ways.<br />
One unit of output requires 0.25 units of capital as 4 × 0.25 = 1 <strong>and</strong> 5 units of labor as 0.2 × 5 = 1.<br />
The cost of these inputs is 0.25 × r + 5 × w = 0.25 × $40 + 5 × $12 = $70. Therefore, the cost<br />
function is C(q) = 70q.<br />
Alternatively, notice that making 20 units of output requires 5 units of capital (as 4 × 5 = 20) <strong>and</strong> 100<br />
units of capital (as 0.2 × 100 = 20). The cost of 20 units of output, therefore, is 5×$40 + 100×$12 =<br />
$1,400. Therefore, each unit itself costs $1,400 ÷ 20 = $70. Therefore the cost function is<br />
C(q) = 70q.<br />
80
6. A firm’s cost function is C(q) = 5q + 3q 2 .<br />
a. Algebraically solve for F, VC(q), AC(q), AVC(q), <strong>and</strong> MC(q).<br />
F = 0<br />
VC(q) = 5q + 3q 2 .<br />
AC(q) = C(q) ÷ q = 5 + 3q.<br />
AVC(q) = VC(q) ÷ q = 5 + 3q. (So notice that AC = AVC.)<br />
MC(q) = 5 + 6q.<br />
b. Graph AC(q), AVC(q), <strong>and</strong> MC(q) as accurately as possible on the same graph.<br />
$<br />
MC = 5 + 6q<br />
AC = AVC = 5 + 3q<br />
5<br />
quantity<br />
c. Given this cost function, under what condition(s) on price will the firm shut down in the short<br />
run Under what condition(s) on price will the firm exit in the long run<br />
Notice that minimum AC equals minimum AVC as AC equals AVC. Therefore, the shutdown<br />
rule (which uses minimum AVC) is the same as the exit rule (which uses minimum AC). In<br />
particular:<br />
• Shut down in the short run if price is less than $5.<br />
• Exit in the long run if price is less than $5.<br />
81
7. Soybeans are sold in a perfectly competitive industry. The industry is presently in long-run<br />
equilibrium. In the present equilibrium, the following hold:<br />
• The price of soybeans is $5 per bushel: p = $5.<br />
• There are 5,000 soybean farmers: N = 5,000.<br />
• Each soybean farmer produces 40,000 bushels: q = 40,000.<br />
• Total production equals 200 million bushels of soybeans: Q = 200 million.<br />
• Each firm receives $0 profits: π = $0.<br />
Then suppose a negative finding regarding the health risks of soybeans leads to an immediate <strong>and</strong><br />
permanent decrease in the market dem<strong>and</strong> for soybeans.<br />
a. Indicate how each of the variables listed above changes (if at all) in the short run. When possible,<br />
give a precise number for the variable. For example, in a situation in which the price of soybeans<br />
doesn’t change, you could write, “The price of soybeans is unaffected by the dem<strong>and</strong> shock, so p<br />
= $5.” Of course, if the price of soybeans increases to an unknown price, you would write “The<br />
price of soybeans increases because of the dem<strong>and</strong> shock, so p > $5.”<br />
A permanent decrease in dem<strong>and</strong> (in the short run) leads to:<br />
• A fall in price below $5.<br />
• N = 5,000 as entry <strong>and</strong> exit is not allowed in the short run.<br />
• Each firm’s quantity, q, falls below 40,000 bushels in the short run as the marginal bushel<br />
is less profitable as prices have fallen.<br />
• Total industry quantity, Q falls in the short run as all firms produce less; i.e., Q SR < 200<br />
million bushels.<br />
• Firm profits fall as prices <strong>and</strong> quantities have fallen: π SR < $0.<br />
b. Indicate the long-run value for each of the five variables indicated above in relation to the original<br />
long-run equilibrium. Again, if possible, specify the actual number the variable will take on.<br />
For the market to return to long run equilibrium after the permanent negative dem<strong>and</strong> shock <strong>and</strong><br />
negative short run profits, some firms exit the industry, shifting industry supply in. This drives<br />
price up <strong>and</strong> returns the industry to zero profits. Specifically, returning to long run equilibrium:<br />
• Price returns to $5.<br />
• N < 5,000 as firms exit in the long run.<br />
• Each firm’s quantity, q, returns to 40,000 bushels in the long run.<br />
• Total industry quantity, Q falls even more in the long run because of exiting firms; i.e.,<br />
Q LR < Q SR < 200 million bushels.<br />
• Firm profits return to $0: π LR = $0.<br />
82
c. Following the eventual return to long-run equilibrium, another shock occurs, <strong>and</strong> after the market<br />
for soybeans works through that shock, long-run equilibrium is once again obtained. This time,<br />
however, the price of a bushel of soybeans is now $2 per bushel. Which of the following shocks<br />
could <strong>and</strong> could not have caused this long-run change, <strong>and</strong> why:<br />
i. A decrease in the cost of farm workers.<br />
This is a possible reason long-run price fell. Specifically, when the price of a factor<br />
of production falls, the cost function falls <strong>and</strong> in particular the minimum average cost<br />
must fall. As long-run price equals the minimum average cost, such a change could<br />
cause a decrease in the long-run price (making the third shock a possibility).<br />
ii. An increase in the dem<strong>and</strong> for soybeans<br />
A decrease in the long-run competitive price cannot come about from a dem<strong>and</strong><br />
shock (ruling out this explanation).<br />
iii. An increase in the price of soybean seeds.<br />
An increase in a factor price would increase, not decrease, the long-run price (ruling<br />
out this explanation).<br />
iv. A technological advancement in the fertility of soybean seeds.<br />
A technological advancement is reflected by an improved cost function, <strong>and</strong> in<br />
particular by a lower minimum average cost. As long-run price equals the minimum<br />
average cost, such advancement could cause a decrease in the long-run price (making<br />
this explanation a possibility).<br />
83