Ambient Air Measurement for Practical Users
Ambient Air Measurement for Practical Users
Ambient Air Measurement for Practical Users

You also want an ePaper? Increase the reach of your titles
YUMPU automatically turns print PDFs into web optimized ePapers that Google loves.
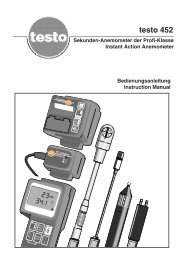
testo<br />
<strong>Ambient</strong> <strong>Air</strong> <strong>Measurement</strong> <strong>for</strong><br />
<strong>Practical</strong> <strong>Users</strong><br />
testo 2 a edición<br />
testo<br />
testo<br />
0638.1445<br />
testo<br />
1st edition<br />
°C<br />
% rF<br />
td<br />
g/kg<br />
hPa<br />
m/s<br />
m 3 /h<br />
ppm<br />
CO<br />
ppm<br />
CO 2<br />
rpm<br />
mA<br />
mV
Foreword<br />
This handbook entitled "<strong>Ambient</strong> <strong>Air</strong> <strong>Measurement</strong> <strong>for</strong> <strong>Practical</strong> <strong>Users</strong>" was produced<br />
as the result of many discussions with our customers. It is intended primarily <strong>for</strong> air<br />
conditioning and ventilating plant acceptance and service technicians. The aim is not<br />
so much to show the experienced measurement technician when, why and what he<br />
should be measuring, but rather to identify the problems encountered in practice on<br />
location with temperature, humidity and air velocity measuring equipment.<br />
In this handbook you will find valuable hints on avoiding measuring errors on location;<br />
the best and most efficient way to use sensors, probes and measuring instruments<br />
and what marginal conditions you should take into account in order to interpret measurement<br />
results correctly.<br />
This handbook was produced under the overall control of our long-serving Product<br />
Manager and Project Innovation Manager, Manfred Streicher. Scientific knowledge<br />
was contributed by Professor Dr. Ing. S. Hesslinger. We should like to take this opportunity<br />
to thank them both very much <strong>for</strong> their valuable work, which Testo customers<br />
will be able to make use of.<br />
We would welcome further suggestions, which we would be pleased to incorporate<br />
into a new edition. If you have any questions or suggestions, please contact the Testo<br />
<strong>Ambient</strong> <strong>Air</strong> Measuring Engineering project team, the members of which are Product<br />
Manager Dipl.-Ing. (FH) Thomas Schwarzer and, with responsibility <strong>for</strong> innovation and<br />
project management, Dipl.-Ing. (FH), Physicist (bac) Manfred Streicher.<br />
The Management: Burkart Knospe<br />
Lothar Walleser<br />
3
Contents<br />
INTRODUCTION................................................................................................................6<br />
GENERAL PRINCIPLES OF MAKING MEASUREMENTS<br />
Measured Values in <strong>Ambient</strong> <strong>Air</strong> Engineering..............................................7<br />
Logging .....................................................................................................8<br />
TEMPERATURE MEASUREMENT<br />
Measuring <strong>Air</strong> Temperatures........................................................................12<br />
Measuring Errors When Measuring in the Unsteady State ............13<br />
Measuring Errors Due to Radiation .....................................................14<br />
Measuring Errors Due to Stratification ................................................15<br />
Surface Temperature <strong>Measurement</strong> ............................................................17<br />
Surface Temperature <strong>Measurement</strong>s on Insulation<br />
and Poor Conductors (Wood, Glass, etc.).................................18<br />
Surface Temperature <strong>Measurement</strong> on Walls ......................................18<br />
<strong>Measurement</strong> on Pipes ........................................................................18<br />
HUMIDITY MEASUREMENT ..................................................................................................<br />
General ...................................................................................................20<br />
Measuring Relative Humidity in Rooms......................................................23<br />
Example ...............................................................................................25<br />
Measuring Relative and Absolute Humidity in Ducts ................................26<br />
AIR FLOW MEASUREMENT<br />
General ...................................................................................................29<br />
Planning Measuring Points..........................................................................33<br />
<strong>Air</strong> Flow <strong>Measurement</strong> in Ducts ..................................................................35<br />
Measuring Errors in <strong>Air</strong> Flow <strong>Measurement</strong> .........................................36<br />
Errors Due to <strong>Measurement</strong>s at the Lower End of the<br />
Measuring Range.................................................................................37<br />
Errors Due to Sources of Disturbance..................................................39<br />
Obstruction of the Flow Section<br />
by the Probe ..............................................................................41<br />
Backflow Effects ........................................................................43<br />
Hints on Using Pitot Tubes ..........................................................................44<br />
<strong>Air</strong> Flow <strong>Measurement</strong>s at <strong>Air</strong> Vents ..........................................................45<br />
<strong>Measurement</strong> at Suction Apertures .....................................................50<br />
Volume Flow Determination by the Fan Characteristic ............................52<br />
Measuring Room <strong>Air</strong> Velocity ......................................................................53<br />
4
PREPARING FOR AND CARRYING OUT MEASUREMENTS......................................................53<br />
PRESSURE MEASUREMENT ............................................................................................54<br />
CO 2 MEASUREMENT AS A MEANS OF ASSESSING ROOM AIR CONDITIONS..........................55<br />
GENERAL HINTS ON USING MEASURING INSTRUMENTS .....................................................57<br />
Using Probes and Sensors ..........................................................................58<br />
PRESENTING TESTO MEASURING INSTRUMENTS ...............................................................60<br />
Probe Specifications ....................................................................................63<br />
SOURCES AND BIBLIOGRAPHY........................................................................................68<br />
5
Introduction<br />
The 3 most important measured values in buildings or air conditioning and ventilating<br />
plants are temperature, relative humidity and air velocity. Essentially the requirement<br />
is to create a particular climate in a room, with temperature, humidity and air velocity<br />
controlled within a range of tolerance (e.g. the com<strong>for</strong>t range). At the same time,<br />
energy consumption to produce this result should be as low as possible.<br />
In any building there are four measuring locations with marginal conditions that are<br />
different in principle:<br />
6<br />
1. The external air,<br />
with extreme states:<br />
Winter (cold, high relative humidity, but low absolute<br />
humidity) and<br />
Summer (hot, high absolute humidity in some cases and<br />
average relative humidity as a rule)<br />
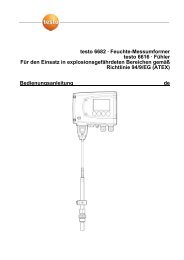
2. The plant room<br />
This houses the plant and<br />
equipment used to treat the<br />
external air drawn in:<br />
Drier, humidifier, filter, heating<br />
and cooling elements and fans<br />
and also the monitoring, control<br />
and adjusting units.<br />
Fig. 1: testo 454 in use in a plant room<br />
3. Ducting systems<br />
serving the room to be air conditioned.<br />
These comprise pipes (outward and return flow), air shafts (fresh air<br />
and ambient air), with branches and fixed measuring points.<br />
4. Contact with the room to be air conditioned:<br />
<strong>Air</strong> grilles, extractors and heat exchangers and radiators.<br />
. 5. The room itself, including walls, ceiling, doors and windows.
At all of these locations there are fixed measuring points with specified measured<br />
values (within permitted ranges of tolerance) <strong>for</strong> both acceptance and service<br />
purposes. The main marginal conditions are also indicated.<br />
If measurements are then made to confirm or check these measured values, the basic<br />
requirement is to obtain the same measured values at the same measuring points at<br />
different times but under the same marginal conditions. This calls <strong>for</strong> totally accurate<br />
measuring instruments which will produce the same measured values relatively independently<br />
of the marginal conditions. Otherwise, the measuring technician on location<br />
would have to ask himself every time what is the right measuring method, the correct<br />
sensor, and the best way to carry out the measurement (measurement duration,<br />
adjustment time, whether to take an average of several measuring points or an average<br />
over a period of time).<br />
To ensure measuring instruments are used correctly, it is important both to check the<br />
measuring equipment regularly and also to consider how best to use it on location.<br />
Ultimately, to be of value, measurement data need to be consistently and clearly<br />
recorded. A figure and a unit do not constitute a measured value. The measured<br />
value can only be interpreted and used as a representative measured value if it is<br />
accompanied by all the necessary in<strong>for</strong>mation that makes it possible to repeat the<br />
measurement result under comparable conditions.<br />
General Principles of<br />
Making <strong>Measurement</strong>s<br />
Measured Values in <strong>Ambient</strong> <strong>Air</strong> Engineering<br />
As part of the procedures <strong>for</strong> acceptance of a system, an expert checks whether the<br />
plant as built meets the contractual specifications. Any further measurements have to<br />
be agreed separately between the client (owner) and the contractor.<br />
At acceptance of an air conditioning plant, the measured values shown in Table 1 are<br />
determined as a rule.<br />
7
Table 1: Measured Values to be Determined in an <strong>Air</strong> Conditioning System as<br />
part of Functional <strong>Measurement</strong><br />
Logging<br />
Logging the measurement results and marginal conditions<br />
<strong>for</strong>ms part of every (acceptance) measurement.<br />
The data which have to be logged vary from one country<br />
to another.<br />
8<br />
<strong>Measurement</strong>s <strong>Measurement</strong>s<br />
Measured Values at the Plant in the<br />
Unit Room<br />
Fan motor current consumption<br />
X -----<br />
<strong>Air</strong> flow<br />
<strong>Air</strong> temperature<br />
Humidity<br />
Prressure drop at filter<br />
Sound pressure level<br />
<strong>Ambient</strong> air velocity<br />
• Date/Time<br />
These are added directly to printouts made<br />
using Testo professional measuring equipment.<br />
It is advisable to do a short check printout<br />
immediately be<strong>for</strong>e measuring.<br />
• Name<br />
Often, despite taking all due care, not all of<br />
the marginal conditions are noted down.<br />
The name of the person making the measurement<br />
should there<strong>for</strong>e be recorded<br />
<strong>for</strong> any queries.<br />
X X<br />
X X<br />
X X<br />
X -----<br />
----- X<br />
----- X
• Equipment Specification<br />
For subsequent maintenance and servicing it has to be ensured<br />
that important plant specifications have not changed since the last<br />
measurement (e.g. more powerful fan).<br />
• Plant Operation<br />
This covers data in respect of desired values set, plant operation under<br />
full load, etc.<br />
• Measuring point<br />
It must be possible to assign the measured values to the measuring point<br />
accurately (e.g. on a drawing of the plant).<br />
• Measuring Equipment<br />
Details of the measuring equipment used and the sensor. The marginal<br />
parameters set on the measuring instrument may also be included, e.g.<br />
absolute pressure at the measuring point, atmospheric density set or<br />
details of other parameters used to compensate <strong>for</strong> measured values<br />
in the measuring equipment (temperature, humidity, etc.)<br />
• Measuring Range Set<br />
This is important in the case of measuring equipment with a choice of measuring<br />
ranges, because a different accuracy is assigned to each measuring<br />
range. For Testo measuring instruments it is not relevant, because they<br />
automatically select the appropriate range when the correct sensor <strong>for</strong> the<br />
purpose is selected and fitted.<br />
• Desired Value<br />
The value that should be obtained under specified conditions.<br />
• Actual Value<br />
The measured value read off or printed out.<br />
• Variance<br />
• Notes on the Measuring point<br />
Note down everything that could have affected the measurement, such<br />
as maintenance work, measurements be<strong>for</strong>e or after changing filters,<br />
velocity measurements with vent grilles removed, doors and windows<br />
open or closed, etc.<br />
• Weather Conditions<br />
Barometric pressure, wind velocity, wind direction or external air<br />
temperature and humidity.<br />
9
Fig. 2: Example of a correct log of an air flow measurement using the<br />
centroidal axis method<br />
Further examples on the next page are a printout of a log made on location with<br />
measuring equipment and a diagram produced on the PC to document the behaviour<br />
of the temperature of a radiator over time.<br />
10
Fig. 3: Documentation using Testo testo 454 printing <strong>for</strong>mat<br />
Com<strong>for</strong>t software 0554.0171 in conjunction with 0554.0345<br />
infrared printer<br />
If the measuring point is not clearly shown on the drawings, a sketch should be made<br />
of the measurement environment and the measuring points marked on it with dimensions.<br />
Dimensions should be taken from the fixed points of the building (e.g. pillars).<br />
5000<br />
3000<br />
Graphic Printout<br />
Conditions: Outward / Return Flow Temperature<br />
Notes Building: Maienstraße 8<br />
Maier, Mr. Armbruster<br />
Room 3, radiator below central window<br />
Valve closed and room ventilated be<strong>for</strong>e<br />
start of measurement<br />
TITLE: Sketch <strong>for</strong> <strong>Measurement</strong> Log 2 DATE: ...........................<br />
MEASURING POINT: Office 2 NAME:...........................<br />
Desk<br />
Measuring<br />
Point<br />
x<br />
Window<br />
Fresh <strong>Air</strong><br />
Exhaust <strong>Air</strong><br />
Title:10_ROOM<br />
GROUND PLAN<br />
2000<br />
Door<br />
2000<br />
4000<br />
4000<br />
Fig. 4 is an example of a sketch showing the measuring points <strong>for</strong><br />
temperature stratification measurement in a room.<br />
Page<br />
ROOM<br />
ROOM<br />
3000<br />
Desk<br />
Room<br />
<strong>Air</strong> Vents<br />
MP 3<br />
MP 2<br />
MP 1<br />
100<br />
SECTION<br />
1300<br />
1800<br />
11
Temperature <strong>Measurement</strong><br />
Measuring <strong>Air</strong> Temperatures<br />
Temperature measurements are made as part of acceptance measurements at the<br />
central unit of the air conditioning plant, in the fresh air and in the air conditioned<br />
rooms.<br />
New requirements have been laid down <strong>for</strong> room temperatures in connection with<br />
com<strong>for</strong>table temperatures <strong>for</strong> human beings.<br />
Limits apply to the following temperatures:<br />
12<br />
• <strong>Ambient</strong> <strong>Air</strong> Temperature<br />
<strong>Ambient</strong> air temperature should be measured with a radiation-protected<br />
thermometer. All Testo temperature probes with stainless steel tubes are<br />
suitable <strong>for</strong> the purpose. In Germany, <strong>for</strong> example, the vertical temperature<br />
gradient of the ambient air must not exceed 2 K/m.<br />
• Operating Temperature (or sensation temperature)<br />
This is measured using a globe thermometer. According to Glück [4], when<br />
using a globe thermometer with a diameter of 150 mm (see Testo globe<br />
thermometer probes), the measured operating temperature coincides with<br />
the human sensation temperature at ± 0.41 K.<br />
Calculating the operating temperature from the measured values <strong>for</strong> ambient air<br />
temperature and the surface temperature of the surrounding surfaces of the room,<br />
weighted by the insolation factors, involves a great deal of time and calculation and<br />
will there<strong>for</strong>e not be discussed in greater detail here. Moreover, using the Testo<br />
globe thermometer means that this method no longer need be used.<br />
When using globe thermometers it is important to ensure that the globe is not exposed<br />
to direct sun or light rays, because only the radiation temperatures of the surrounding<br />
surfaces should be taken into account in the temperature measured, i.e. either select<br />
the measuring point accordingly or, if this is not possible, shade the globe at as great<br />
a distance as possible. Allowance should be made <strong>for</strong> the inertia of the thermometer<br />
by measuring over a suitably long period (until a constant value is displayed - at least<br />
20 to 30 minutes).
Temperature measurements in the room (air temperature and operating temperature)<br />
should be made at the same point and under identical marginal conditions, as should<br />
ambient air velocity measurements.<br />
Measuring Errors When Measuring in the Unsteady State<br />
Measuring and recording marches of temperature requires temperature probes to be<br />
used, the time constant of which needs to be matched to the rate of change of the<br />
temperature of the medium.<br />
The time constant depends on heat transfer to the probe surface, the thermal conductivity<br />
of the probe material and the heat-storage properties (mass, density, thermal<br />
capacity) of the probe.<br />
Probe temperature<br />
Temperature of the medium<br />
➀ Temperature probe 0600.9794 (NiCr-Ni)<br />
② Temperature probe 0610.9714 (NTC)<br />
100 %<br />
63%<br />
T 1<br />
T 2<br />
1<br />
2<br />
(T probe time constant)<br />
Time<br />
Fig. 5:<br />
Step responses of two<br />
temperature probes with<br />
different time constants<br />
(T2 = 2T1)<br />
The type of probe to be used depends on the application. We recommend<br />
probe ➁ in situations where the conditions change slowly but a high level of<br />
system accuracy is called <strong>for</strong> (measurements in rooms, com<strong>for</strong>t, system<br />
accuracy > 0.5°C).<br />
13
Probe ➀ should be chosen <strong>for</strong> measurements in the duct (e.g. when rapid temperature<br />
changes take place following a sudden change in the proportion of ambient air).<br />
Fig. 6 shows in quality terms the temperature difference between the temperature of<br />
the medium and the temperature display. The temperature of the medium is assumed<br />
to rise at a constant rate.<br />
Fig. 6:<br />
Illustration of reading<br />
error at a constantly<br />
rising medium temperatu-<br />
Temperature difference<br />
14<br />
T<br />
Temperature of the medium<br />
Probe temperature<br />
( T Probe time constant)<br />
Reading<br />
error<br />
re due to the inertia of the<br />
temperature probe<br />
A slow probe (no. 2 in Fig. 5) leads to measuring errors in dynamic processes despite<br />
being highly accurate at equilibrium. The faster the probe, the more realistic is the<br />
measured value displayed.<br />
The probe t 99 time should be at least twice as fast as the expected change in the<br />
temperature of the medium.<br />
Measuring Errors due to the Influence of Radiation<br />
The heat exchange due to radiation between the temperature probe and the surrounding<br />
surfaces should be taken into account to ensure accuracy of air temperature<br />
measurements. Considerable deviations from the actual air temperature can occur<br />
because of the temperature difference between the probe and the surface and the<br />
distance between them.<br />
Time
Fig. 7 shows an air temperature measurement using a thermometer not protected<br />
against radiation behind an air heater. The measuring error (too high temperature)<br />
would be even greater with a low convective heat transfer (due to low air velocities).<br />
<strong>Air</strong><br />
Heater<br />
Surface temp. = 50 ° C<br />
<strong>Air</strong> temperature = 20 ° C<br />
Probe temperature = 21 ° C<br />
Probe<br />
10 cm<br />
Fig. 7:<br />
<strong>Air</strong> temperature measurement<br />
using a thermometer<br />
not protected<br />
against radiation<br />
In this example, the temperature measurement using a probe without radiation protection<br />
produces a measuring error of 1 K.<br />
In practice, avoid measuring air temperatures in the immediate vicinity<br />
of surfaces the temperature of which differs greatly from the air temperature.<br />
If this cannot be avoided, screen the probe from incident radiation<br />
by means <strong>for</strong> example of a metallic bright aluminium sheet between the<br />
radiation source and the probe.<br />
Measuring Errors due to Stratification<br />
When measuring air temperature in ducts and at the central unit, in many cases only<br />
single-point measurements are carried out. Such measurements are only representative<br />
of the total air flow if the mean temperature and mean velocity of flow of the section<br />
are recorded at the measuring point. Fig. 8 shows an example where these conditions<br />
cannot be met.<br />
15
16<br />
a) Qualitative mixing sequence at V um/V a = 1/1<br />
b) Characteristic velocity profile at measuring plane III<br />
c) Temperature gradient over the height of the chamber<br />
Fig. 8:<br />
Mixing chamber <strong>for</strong> air<br />
with temperature stratification<br />
and backflow areas<br />
Temperature stratification can occur if air flows at different temperatures are mixed or<br />
after passing through heat exchangers, especially if the surface temperature varies<br />
greatly across the exchanger section (often in case of part load).<br />
If an almost completely mixed flow is not available at the measuring point (comparable<br />
with air flow measurement), a grid measurement should be made (see also page 31).<br />
The number of measuring points is determined by the irregularity of the temperature<br />
profile.<br />
The temperatures measured have to be weighted by the associated velocities in order<br />
to determine the mean temperature of the total air flow accurately.
Measuring Surface Temperatures<br />
The primary reason <strong>for</strong> measuring surface temperatures is to establish marginal conditions<br />
accurately. This applies to possible pronouncements as to the operation of<br />
heat exchangers, either <strong>for</strong> air heating or cooling in ducts or on radiators in rooms.<br />
Fig. 9:<br />
Measuring the surface<br />
temperature of a radiator<br />
using magnetic probe<br />
0600.4893<br />
Surface temperatures also play a part in thermal balances or in the evaluation of<br />
systems (e.g. air ducts carrying hot air or pipes containing coolant).<br />
Another area where surface temperatures play an important role is that of com<strong>for</strong>t,<br />
where the influence of the surfaces enclosing the room, such as windows or walls,<br />
has to be assessed.<br />
Condensation phenomena depend on surface temperatures, particularly in the case<br />
of relative humidity measurements (see Fig. 14, page 25).<br />
The condition of large motors, fans or pumps can be more accurately gauged by<br />
measuring the surface temperature of the housing or bearings.<br />
The easiest measurements to make are those on large metal parts (large mass)<br />
with a flat, smooth surface. The good thermal conductivity of metals guarantees<br />
efficient heat transport from the core of the surface to be measured to the actual<br />
measuring probe. The heat transmission from the surface to the probe (the critical<br />
factor <strong>for</strong> accurate measurement) can be markedly improved by using heat paste<br />
(part no. 0554.0004).<br />
17
Another source of error is reading off the value too soon without allowing <strong>for</strong> the<br />
probe temperature adjustment time and the temperature drop on the surface caused<br />
by contact with the temperature probe. This varies according to the model.<br />
18<br />
Tip <strong>for</strong> practical measurements:<br />
place the probe in position vertically and<br />
wait <strong>for</strong> the measured value to stabilise<br />
(temperature adjustment time).<br />
When making surface measurements,<br />
the maximum measured value displayed<br />
is closest to the true measured value<br />
( → maximum value display on the<br />
measuring instrument).<br />
;;;<br />
;;;<br />
Surface measurements on insulation and poor conductors<br />
(foam, wood, glass, etc.):<br />
In this case, stick-on thermocouples the surface of which can be connected to the surface<br />
via heat paste are the best type. The low mass of these sensors means as little<br />
heat as possible is drawn out of the surface, while virtually no heat is removed via the<br />
connecting wires. The ideal method is to attach the sensor to the surface with heat<br />
paste and fasten it in place with generous quantities of insulating tape, including part<br />
of the connecting cable as well.<br />
Wall surface temperature measurement:<br />
The best instrument <strong>for</strong> this application is the contactless infrared surface temperature<br />
probe, particularly because they measure integrally over a large area of the wall at a<br />
corresponding distance, i.e. a mean across these areas is produced automatically.<br />
Their practical use is rather problematic, however, because the potential error source<br />
(incorrect allowance <strong>for</strong> the emission level) is difficult to control. Experience values<br />
and comparative measures with contact thermometers can help overcome this, however.<br />
<strong>Measurement</strong>s on pipes<br />
Flat surface probes should not be used to measure curved surfaces. Look <strong>for</strong> a flat<br />
measuring surface (flange, union nuts) or use the specially designed pipe surface probes.<br />
These ensure the sensor is correctly positioned,
particularly when making measurement over a longer period.<br />
Fig.<br />
10: testo 454 in use<br />
with pipe surface<br />
probe 0600.4593<br />
Important when making differential measurements:<br />
Because of the probe tolerances, 2 probes placed immediately next to<br />
one another on a pipe will not necessarily show a differential temperature of<br />
0 °C. Carry out this test be<strong>for</strong>e trying to measure differential temperature<br />
using different probes on pipes of different temperatures. In case of<br />
devia tions, a subsequent correction should be made to the measurement<br />
result if necessary.<br />
To sum up, correct temperature measurements are made as follows:<br />
Any measuring instrument measures the sensor temperature directly, and the temperature<br />
of the medium or object only indirectly. Testo optimises the transition from one<br />
application to another through different probe designs.<br />
The user should select the appropriate type of probe and use it correctly:<br />
e. g. • <strong>Measurement</strong> on flat metal surfaces - rugged - 0600.9993<br />
• <strong>Measurement</strong> on curved surfaces - fast - 0600.0194<br />
• <strong>Measurement</strong> on pipes - self-attaching probe - 0600.4593<br />
• Long-term measurements on radiators - magnetic probe - 0600.4793<br />
• <strong>Measurement</strong> on surfaces which are poor heat conductors -<br />
stick-on thermocouple- 0644.1607<br />
19
Humidity <strong>Measurement</strong><br />
General<br />
Controlling atmospheric humidity is important wherever people or humidity-sensitive<br />
substances are in a room <strong>for</strong> a comparatively long period. A humidity exchange takes<br />
place between the ambient air and the people or substances in the rooms.<br />
Hygroscopic substances release humidity into the environment or absorb moisture<br />
from it. In doing so, they are seeking a balance between their humidity content and<br />
the environment. This means that where the air has a low relative humidity content,<br />
hygroscopic substances dry out slowly; if the relative humidity is high, materials<br />
enrich themselves with water.<br />
To give an example: in low atmospheric humidity, materials become brittle and crack<br />
(especially when heating is on during the winter). At high relative atmospheric humidity<br />
and partly cool surfaces, materials start to swell. Condensation <strong>for</strong>ms, and in some<br />
cases mould fungus may grow.<br />
The driving <strong>for</strong>ce behind this is the degree of relative atmospheric humidity. An optimum<br />
relative humidity range can be defined <strong>for</strong> people and hygroscopic materials.<br />
In the case of human beings, this is called the com<strong>for</strong>t range. In buildings, this can<br />
also be transferred to other things such as wood, materials, wallpaper, paper, etc.<br />
As long as the condition of the air remains within this range, it may be assumed that<br />
excess moisture transport will not take place and there will be no essential change to<br />
the properties of substances or materials.<br />
20
Tempperature° C<br />
Fig. 11: Com<strong>for</strong>t range<br />
Standard<br />
atmosphere<br />
The relative humidity value always refers to a temperature. This is due to the<br />
definition of relative humidity:<br />
Relative humidity is calculated from the existing (absolute) humidity in relation<br />
to the maximum possible (absolute) humidity at the prevailing temperature.<br />
When the maximum possible humidity is reached, this is referred to as the<br />
temperature of dew point and the relative humidity is 100% RH: condensation<br />
water or mist <strong>for</strong>ms, and the air is saturated with moisture.<br />
As a rule, humidity measuring instruments are specified with<br />
an accuracy of ± 2% RH. In most cases, however, the values are<br />
only valid <strong>for</strong> a narrow temperature range (18 - 25 °C).<br />
Testo compensates <strong>for</strong> this dependence by means of an<br />
additional temperature measurement.<br />
21
Testo humidity probes are generally fitted with humidity and temperature sensors.<br />
This gives you the two corresponding values, temperature and humidity, at a glance.<br />
The temperature of dew point calculated from these values can also be displayed if<br />
required.<br />
Capacitive humidity probes to measure relative atmospheric humidity are generally<br />
maintenance-free. It is recommended that they be checked with a testing and calibration<br />
set from time to time.<br />
Velocity of flow also plays a part in surface moisture exchange. As the air speed<br />
increases, the processes are accelerated, because a local equilibrium, a limit air layer<br />
in the vicinity of the surface, cannot be reached.<br />
22
Measuring Relative Humidity in Rooms<br />
Essentially, the same rules apply as <strong>for</strong> temperature measurement. At constant<br />
absolute humidity, relative humidity is a function of temperature. There is a risk of<br />
stratification and sizeable changes in humidity in the vicinity of surfaces the<br />
temperature of which differs greatly from the air temperature.<br />
The minimum distance from the wall is reached when despite altering the distance,<br />
the humidity and temperature values displayed no longer change.<br />
;<br />
;<br />
;<br />
;<br />
;<br />
;<br />
;<br />
;<br />
70 % RH<br />
T OF = 15 ° C<br />
T Room = 25 ° C<br />
50 % RH<br />
Minimum distance wall/measuring point <strong>for</strong> representative<br />
atmospheric environment measurement<br />
Two main types of measurement are made in the room:<br />
Fig. 12:<br />
Relative humidity in<br />
rooms<br />
• the spot check measurement:<br />
A rapid check measurement is most useful if a strong or sudden exchange<br />
of air takes place, i.e. in the case of air conditioning plants with a large<br />
change of air, frequent opening of windows or doors, major humidity<br />
sources in the room itself, as in the case of kitchens and bathrooms, etc.<br />
Make sure the humidity probe takes the same temperature as the air to<br />
be measured. Move the probe around if you are measuring in<br />
stagnant air (the adjustment times can be shortened).<br />
Avoid exposure to the direct rays of the sun. Even a few tenths of a<br />
degree of a temperature difference between the probe tube and the<br />
ambient air can distort the measurement result.<br />
23
24<br />
• the long-term measurement <strong>for</strong> observation<br />
The best way to investigate the effects of humidity in the vicinity of surfaces<br />
is with data storage equipment over a long period, because more than one<br />
influence may occur simultaneously (effect of the air conditioning plant, wall<br />
temperature, periodic fluctuations: day and night, lower temperature at<br />
weekends, etc.)<br />
Fig. 13:<br />
Long-term<br />
measurement<br />
with the testo<br />
171-2 Data Logger<br />
This produces data which can be interpreted from a number of points of view, and<br />
can also be used in complex processes.
Illustrative example of a boiling kettle in a kitchen:<br />
In this simple yet very illustrative example, the air temperature remains constant<br />
at just over 20 °C even after the hotplate has been switched on, as does the<br />
somewhat cooler metal surface of the sink. The surface temperature of the window<br />
rises slightly after condensation starts to <strong>for</strong>m. The absolute atmospheric humidity<br />
(dew point) rises sharply as the water boils. Condensation <strong>for</strong>ms on the window<br />
after only a short time.<br />
No condensation <strong>for</strong>ms on the sink because its surface temperature is higher than the<br />
temperature of dew point, even at the maximum of absolute humidity.<br />
Conditions<br />
Notes<br />
<strong>Air</strong> temperature<br />
Sink temperature<br />
Window<br />
temperature<br />
Graphic Printout<br />
Steam Formation in a Kitchen<br />
Name:<br />
Streicher on 4.3.1995<br />
Illustrated: Development of<br />
absolute humidity after the<br />
kettle is switched on.<br />
Atmospheric humidity, dew point<br />
Title: 2_KITCHEN<br />
KITCHEN<br />
KITCHEN<br />
KITCHEN<br />
KITCHEN<br />
Fig. 14: Diagram as a log; illustration of development through time<br />
Page<br />
25
Measuring Relative and Absolute Humidity in Ducts<br />
The prime consideration when measuring humidity in ducts is the absolute humidity.<br />
<strong>Measurement</strong>s are made upstream and downstream of components relevant to humidity<br />
(drier, humidifier) or at points in the system where air flows of different absolute<br />
humidities are mixed (ambient air / external air).<br />
The absolute humidity measured may be assumed to remain constant over long stretches<br />
of duct, provided there is no additional drying or humidifying en route (or condensation<br />
<strong>for</strong>mation on cold surfaces).<br />
One simple method <strong>for</strong> roughly estimating the conditions starts from the assumption<br />
that the air directly behind a washer may be considered saturated with moisture. The<br />
temperature is measured at this point. This temperature may be assumed to be approximately<br />
equivalent to the temperature of dew point. This applies analogously to<br />
efficient condensate traps.<br />
If the temperature in the air conditioned room is then measured, the relative humidity<br />
in situ can be calculated from tables.<br />
In practice, however, only humidity measurement using a humidity meter provides<br />
usable values which can then be used in calculations, because measurements also<br />
have to be made at humidifiers with a level of humidity < 100% (e.g. only 80% RH<br />
downstream of the humidifier).<br />
The basis <strong>for</strong> drawing up humidity balances with the associated energy consumption<br />
picture is the MOLLIER diagram. This diagram is used in practice because working<br />
with <strong>for</strong>mulae on location is awkward. The MOLLIER diagram consists of superimposed<br />
families of curves, each curve representing a constant value.<br />
There are thus straight lines <strong>for</strong> constant temperature ( ϑ ), lines <strong>for</strong> constant relative<br />
humidity (ϕ), lines <strong>for</strong> constant absolute humidity ( x ) and lines <strong>for</strong> constant caloric<br />
content or enthalpy ( h ).<br />
26
const<br />
const<br />
const<br />
const<br />
satuvation<br />
Fig. 15:<br />
Structural principle of a MOLLIER diagram<br />
The state of the moist air is clearly defined in terms<br />
of two of these values. The other two parameters<br />
may be read from the diagram, i.e. with a humidity<br />
and temperature measurement you can allocate a<br />
point on the diagram to the air at the measurement<br />
point.<br />
All technical changes (heating, cooling, drying,<br />
humidifying) to this air correspond to a movement<br />
within the diagram.<br />
Structure of a MOLLIER diagram<br />
h Caloric content kJ/kg dry air<br />
x Water content g/kg dry air<br />
ϑ <strong>Air</strong> temperature °C<br />
ϕ Relative atmospheric humidity %RH<br />
Hints <strong>for</strong> practical measurement:<br />
Do not use electronic humidity probes to measure dew points higher<br />
than the probe temperature, because the ensuing condensation<br />
- saturates the sensory mechanism <strong>for</strong> a certain time, or even<br />
- condensation <strong>for</strong>ms on the electronics, impairing the function<br />
of the probe (until it dries out).<br />
For some simple examples, see overleaf the changes of state of the moist<br />
air caused by an air heater or air washer.<br />
27
Fig.16: Change of air state in Fig. 17: Change of air state in<br />
an air heater an air washer<br />
e State of air on entry e State of air on entry<br />
a State of air on exit, at (e.g. prewarmed external/<br />
∆ h = 15 kJ/kg heat supply ambient air mixture)<br />
a State of air on exit <strong>for</strong><br />
If e and a are swapped, the diagram humidity µ=0.76.<br />
is also valid <strong>for</strong> air coolers with a<br />
dry surface<br />
The air heater is characterised by heat supply at constant absolute humidity. This<br />
leads to an increase in temperature in conjunction with a drop in relative atmospheric<br />
humidity.<br />
In the air washer, water is added to the air at constant caloric content. The addition<br />
of water in conjunction with the cooling of the moistened air increases the relative<br />
humidity.<br />
This illustration using air will help you to understand the steps in the diagram from<br />
the point of view of air conditioning and gives you the relevant parameters at a glance<br />
to determine humidity, temperature and the energy balance in air conditioning plants.<br />
This gives you the necessary energy consumption <strong>for</strong> every change of state of the air.<br />
28
<strong>Air</strong> Flow <strong>Measurement</strong><br />
General<br />
Keeping air flows at the desired level is crucial to the operation of the plant. If air<br />
flows are smaller than planned, the loads from the room (heating, cooling and<br />
substance loads) may in some cases not be removed. This makes measuring air<br />
flows as accurately as possible very important.<br />
Choose the right probe to suit local conditions be<strong>for</strong>e making the measurement.<br />
Suitable probes (according to type) <strong>for</strong> the following applications are:<br />
→ low velocities of flow:<br />
thermal probes<br />
→ medium velocities of flow, particularly in ducts:<br />
vane probes with the smallest possible diameters,<br />
→ measurements at extractor grilles and vents:<br />
large-diameter vane probes<br />
(60 or 100 mm)<br />
or<br />
→ measurements at high velocities,<br />
in heavily contaminated flows with a high proportion of particles:<br />
Pitot tubes<br />
29
100 m/s<br />
60 m/s<br />
40 m/s<br />
20 m/s<br />
10 m/s<br />
30<br />
Velocity of Flow up to + 500° C<br />
Pitot tube 0635.2245<br />
Ø 4 mm, l = 300 mm<br />
(not shown)<br />
up to + 350° C<br />
Pitot tube<br />
up to +140 ° C<br />
0635.9540<br />
Ø 16 mm<br />
up to + 60 ° C<br />
0635.9449<br />
Ø 60 mm<br />
0635.9349<br />
Ø 100 mm<br />
up to + 50 ° C<br />
0635.1042<br />
Ø 10 mm<br />
up to + 140 ° C<br />
0635.9640<br />
Ø 25 mm<br />
up to + 100 ° C<br />
0635.9443<br />
Ø 12 mm<br />
up to + 70 ° C<br />
0635.1549<br />
Ø 4 mm<br />
0635.1049<br />
(with telescope)<br />
Ø 4 mm<br />
0635.2045<br />
Ø 7 mm,<br />
l = 500 mm<br />
(not shown)<br />
up to + 350 ° C<br />
0635.6045<br />
Ø 25 mm<br />
Fig. 18:<br />
Choose the best<br />
velocity probe <strong>for</strong><br />
your application<br />
0635.2145<br />
Ø 7 mm,<br />
l = 350 mm<br />
(not shown)<br />
In conjunction<br />
with a pressure<br />
probe in each<br />
case
When making acceptance measurements, indirect measuring methods (grid<br />
measurements) are used to determine air flows.<br />
The following methods are suggested:<br />
• Trivial method <strong>for</strong> making grid measurements in rectangular sections<br />
With this method, no particular assumptions are made regarding the velocity<br />
profile. The velocity field inside the rectangular duct section is divided into<br />
measuring areas of equal size, with the actual measuring point lying in the<br />
centre of each measuring area.<br />
Fig. 19:<br />
Grid measurement diagram<br />
With a constant velocity profile, only a few measuring points yield a<br />
representative measuring result.<br />
However, if sizeable differences of flow velocity are noted across the<br />
section, the number of measuring points should be increased. The<br />
number of measuring points is sufficient if the measured value of any<br />
area is representative of its immediate vicinity, i.e. if it can be regarded<br />
as a true mean <strong>for</strong> its part area.<br />
• Centroidal axis method <strong>for</strong> grid measurements in circular sections 1<br />
With this method, the circular duct section is divided into annuli of equal<br />
area, the measuring point lying on the centroidal axis of the annulus<br />
(not on its centre line).<br />
Velocity v<br />
Fig. 20:<br />
Centroidal axis method<br />
Here again, the measurement is evaluated<br />
by taking the arithmetic mean of the individual<br />
measured values.<br />
31
32<br />
• Log-linear method <strong>for</strong> making grid measurements in circular sections<br />
This method is used where there is a turbulent limit layer profile, something<br />
only rarely encountered in practice. In this method, the measuring points are<br />
distributed over at least 2 diameters perpendicular to each other, the<br />
distance from the measuring points to the edge decreasing logarithmically.<br />
Fig. 21:<br />
Log-linear method<br />
The mean velocity of flow can be calculated from the individual velocity measured<br />
values and from that, the air volume flow.<br />
•V = volume flow in m 3<br />
/h<br />
v = mean velocity of flow in m/s<br />
A = flow section in m 2<br />
Example: For a section A of 0.5 m 2<br />
and a measured mean velocity of 4 m/s,<br />
the volume flow is 7,200 m 3<br />
/h<br />
Fig. 22 shows ideal flow profiles in the duct. On the left is a marked laminar flow with<br />
a clear maximum at the centre of the duct. The mean velocity of flow is around<br />
one-third of the duct diameter. On the right is a turbulent limit layer profile (no swirls)<br />
with a largely constant flow at the centre of the duct and a drastic drop at the walls.<br />
Between these two ideal <strong>for</strong>ms, any intermediate <strong>for</strong>ms can occur, making grid<br />
measurement essential as a rule.
laminar<br />
Fig. 22:<br />
Ideal velocity profiles<br />
in the duct<br />
<strong>Air</strong> flows are often measured at individual air vents as part of adjustment work. Since<br />
such measurements take a lot of time and are also associated with considerable<br />
errors (see pages 45 onwards), it is advisable to make the adjustment on the basis of<br />
the results of the duct grid calculation and then check that the vents are equally exposed<br />
(<strong>for</strong> instance by carrying out smoke tests). In this case, only the main air flows<br />
need be measured. Appropriate measuring points should be selected, and this in turn<br />
calls <strong>for</strong> proper measuring point planning.<br />
Measuring Point Planning<br />
turbulent<br />
The most important condition <strong>for</strong> accurate measurement is the correct choice of measuring<br />
point. This is particularly true when making air flow measurements in ducts.<br />
Accordingly, the plant designer should mark the measuring points on the execution<br />
drawing (project drawing). The following criteria apply:<br />
• <strong>Air</strong> flow measuring points should be incorporated into all the main ducts<br />
and on the supply pipes to the rooms with strict requirements.<br />
• Minimum distances from sources of disturbance should be observed<br />
(see also the section entitled Errors due to Sources of Disturbance on<br />
page 39). A distance of not less than 6 times the hydraulic diameter<br />
D h = 4A/U (A = duct section, U = duct circumference) should be observed<br />
from upstream points of disturbance. A distance of 2 D h from downstream<br />
points of disturbance is sufficient.<br />
33
34<br />
Orifice plates Valves<br />
Zero<br />
Elbow<br />
Fig. 23:<br />
Problematic measuring<br />
points<br />
Hints <strong>for</strong> practical measurements:<br />
These measuring points cause problems because the velocity<br />
profile can change sharply in their vicinity. The maximum flow<br />
is no longer at the centre of the duct: areas with no velocity of<br />
flow and areas of backflow can occur.<br />
• The measuring point must be accessible.<br />
• There must be enough room to use the measuring instrument.<br />
• It should be checked that the duct was constructed as planned, including<br />
the measuring points.<br />
• The measuring points should be identically<br />
marked on the drawings and on the plant itself<br />
(see also notes on logging, page 8 onwards).<br />
The marking should include:<br />
- plant identification (e.g. conference<br />
room, 1st floor)<br />
- measuring point (e.g. fresh air)<br />
- desired and actual volume flow<br />
- measuring instrument and measuring<br />
principle (e.g. vane anemometer)<br />
- date<br />
- name of company or person responsible<br />
<strong>for</strong> measurement<br />
Max
<strong>Air</strong> Flow <strong>Measurement</strong> in Ducts<br />
Be<strong>for</strong>e starting to make measurements, the logs should be prepared (see<br />
also "Logging", page 8 onwards), taking the desired values from the inspection<br />
drawings, <strong>for</strong> example. The plant operating mode should be checked and noted<br />
in the log. It must be ensured that the operating mode does not alter during<br />
measuring (e.g. due to adjustments).<br />
<strong>Measurement</strong>s should start at the central unit of the air conditioning plant in order<br />
to avoid unnecessary measurements on individual branches if the total air quantity<br />
in the main duct is insufficient.<br />
On completion of each measurement, the measurement results should be evaluated<br />
immediately. The best measuring instruments are those which print out the individual<br />
measured value and the arithmetic mean calculated.<br />
Log<br />
FRESH AIR<br />
Fig. 24:<br />
testo 454 printout<br />
File this printout with the measurement log. Be sure to enter the main marginal<br />
parameters (in this case: company, name of person responsible, date, measuring<br />
point, measuring method, result of measurement, deviation from desired value, air<br />
temperature and - in the case of Pitot tube measurement - the air density used in t<br />
he calculation and associated absolute pressure and relative humidity).<br />
35
Measuring Errors in <strong>Air</strong> Flow <strong>Measurement</strong><br />
A distinction is made in the theory of measurement engineering between random and<br />
systematic errors.<br />
Random errors can be computed by error calculations. Uncertainties due to the set-up<br />
of measuring instruments, measuring method, measuring equipment and readings are<br />
combined to give a total uncertainty.<br />
The figure below shows an example of an error calculation.<br />
Measuring section a • b in mm 2<br />
Uncertainty of meas. point τU in %<br />
Number of meas. points n Uncertainty of anemometer τG in % v.E.<br />
Relative distance from Uncertainty of reading<br />
source of disturbance a/Dh (where display changes) δv in m/s<br />
Velocity = reading value v in m/s Anemometer meas. range vE in m/s<br />
Irregularity of profile U in % Uncertainty of side length δa, δb in mm<br />
Uncertainty:<br />
Fig. 25: Example of an error calculation<br />
δ a<br />
2<br />
τL = ± τ 2<br />
U + 100 + 100 2<br />
+ 100 2<br />
+ τG 2<br />
a b v v<br />
τL = ± 9 2 + 100 2<br />
+ 100 2<br />
+ 100 2<br />
+ 1 2<br />
For a = 1200 mm, b = 800 mm, n = 20, a/Dh = 3, v = 6 m/s, U = 24 % (see Fig. 28), τU = 9 %<br />
(see Table 2), τG = ± 1 % v. E. (Table 2) δv = 0,2 m/s, vE = 40 m/s, δa = δb = 1,5 mm<br />
the following is true:<br />
1,5 1,5 0,2 40<br />
1200 800 6 6<br />
36<br />
= ± 11,69 %<br />
δ b<br />
v = 1,2 m • 0,8 m• (6,0 ± 0,7) m/s = (5,76 ± 0,7) m3/s = 20880 ± 2520 m3/h Result v = 6m/s<br />
Uncertainty τ = ±11,69 % = ± 0,7 m/s<br />
There<strong>for</strong>e the result <strong>for</strong> the volume flow is:<br />
δ v<br />
v E
It is acknowledged that the errors due to the use of the measuring instrument at the<br />
lower end of the measuring range and the irregularity (distortion) of the flow profile<br />
are particularly critical to the overall error. These major sources of error will there<strong>for</strong>e<br />
be discussed in greater detail later.<br />
Besides random errors, there are also what are called systematic errors. These are<br />
"hidden" errors which occur when the person making the measurement is unaware<br />
of various factors which can distort the measurement result.<br />
A good example is the measurement of air velocity in the backflow area of a curve<br />
using a measuring instrument which displays positive values irrespective of the direction<br />
of flow (see section on Backflow Effects, page 43).<br />
Errors due to measurements at the lower end of the measuring range<br />
Depending on the measuring method, flow sensors show a varying error characteristic<br />
which can adversely affect the measurement result, according to the measuring range<br />
selected.<br />
For example, thermal velocity probes have a very small intrinsic error (in the ± 2-5<br />
cm/s range), to which has to be added a sensitivity error as a percentage of the<br />
measured value (2.5 - 5% of the measured value). This means that thermal probes<br />
are mainly suitable <strong>for</strong> the measurement of low air velocities, as the uncertainty of<br />
measurement increases linearly as the air velocity rises.<br />
In the case of vane probes, in contrast, the uncertainty of measurement is normally<br />
given as a percentage of the final value. Vane probes thus have a constant mea<br />
suring error right across their measuring range. As a result, vane probes are most<br />
suitable <strong>for</strong> use in the top half of the measuring range. It can be said as a rule that<br />
thermal anemometers are preferable up to 5 m/s and vane probes over 5 m/s.<br />
37
Fig. 26: Measuring errors due to the use of a vane probe (dia. 16 mm) in<br />
conjunction with a testo 452 at the lower end of the measuring range<br />
The measuring point has a very uni<strong>for</strong>m flow profile (distance from the "fan" source of<br />
disturbance approximately 12 D h), and the inaccuracy of measurement is there<strong>for</strong>e<br />
essentially attributable to the use of the vane probe at the lower end of the measuring<br />
range. In measurement series 2, with a higher air velocity (4 m/s), the uncertainty of<br />
measurement drops from to 19.5% down to 8.2%.<br />
The error characteristic is even better with Pitot tube measurement at average and<br />
high air velocities. Due to root calculation when computing the air velocity from the<br />
dynamic pressure, the measuring error decreases sharply as the air velocity increases<br />
(despite a constant intrinsic error in the pressure measurement).<br />
38<br />
SECTION A-A<br />
57 170<br />
59<br />
178<br />
296<br />
415<br />
Meas.Values (m/s) and Results of Meas. Series 1<br />
Reference Volume Flow 478 m 3 /h<br />
Dimension<br />
57 170 Mean velocity<br />
1.5 m/s<br />
Duct section<br />
0.106 m 2<br />
Volume flow<br />
571 m 3<br />
59 1.4 1,5<br />
178 1.5 1,6<br />
296 1.5 1,5<br />
/h<br />
Deviation from<br />
415 1.5 1,5<br />
reference value<br />
+19,5 %<br />
A<br />
A<br />
MEASURING PLANE<br />
3700<br />
RECTANGULAR DUCT 225 X 475<br />
FAN<br />
AIR<br />
INLET NOZZLE<br />
Meas.Values (m/s) and Results of Meas. Series 2<br />
Reference Volume Flow 1512 m 3 /h<br />
57 170 Mean velocity<br />
4.3 m/s<br />
Duct section<br />
0.106 m 2<br />
Volume flow<br />
1637 m 3<br />
Dimension<br />
59 3.9 3.9<br />
178 4.2 4.2<br />
296 4.5 4.5<br />
/h<br />
Deviation from<br />
415 4.3 4.3<br />
reference value<br />
+8,2 %
Errors due to Sources of Disturbance<br />
The measurement of air flows (air velocities and dynamic pressures) requires a flow<br />
which is free from swirl and backflow. The measuring point selected should there<strong>for</strong>e<br />
be sufficiently far from the source of disturbance. A swirl flow is stable and can continue<br />
over long distances in the duct system. In such cases, a flow rectifier should be<br />
fitted upstream of the measuring point.<br />
Backflows which may be caused by flaps and elbows or knees generally cease<br />
at a distance of twice the hydraulic diameter (2 D h; D h = 4 x A/U) from the source<br />
of disturbance. However, the flow profile is so distorted that a large number of<br />
measuring points are necessary in order to keep the uncertainty of measurement<br />
low. Fig. 27 shows flow profiles measured with a Prandtl Pitot tube after a bend<br />
<strong>for</strong> 3 different distances from the disturbance source.<br />
10 m/s<br />
5 m/s<br />
Distance<br />
7 x D h<br />
Balanced flow profile Distorted flow profile<br />
10 m/s<br />
5 m/s<br />
10 m/s<br />
Distance<br />
2 x D h<br />
5 m/s<br />
Distance<br />
1 x D h<br />
Flow profile<br />
with backflow<br />
Fig. 27:<br />
Decline in the irregularity<br />
of the flow profile as<br />
the distance from the<br />
disturbance source<br />
increases<br />
The horizontal<br />
velocity profiles<br />
were measured with<br />
a Prandtl Pitot tube.<br />
The number of measuring points to be selected in a section will be found in Table 2.<br />
The irregularity (distortion) of the flow profile should first be determined <strong>for</strong>m Fig. 28.<br />
D=250<br />
<strong>Air</strong><br />
39
Relative distance a/Dh of the measuring<br />
point from the disturbance source<br />
40<br />
10<br />
8<br />
7<br />
6<br />
5<br />
4<br />
3<br />
2<br />
Number of<br />
Measuring<br />
Points<br />
4<br />
5<br />
6<br />
8<br />
10<br />
20<br />
30<br />
50<br />
100<br />
200<br />
1<br />
4 5 6 7 8 10 20 30 40 %<br />
Irregularity of profile U<br />
Uncertainty of <strong>Measurement</strong> τU in %<br />
Irregularity of Profile U in %<br />
2 10 20 30 40<br />
6 12 20 28 36<br />
5 11 17 24 31<br />
5 10 15 21 27<br />
4 8 13 18 23<br />
3 7 12 16 20<br />
2 5 8 11 14<br />
2 4 7 9 11<br />
1 3 5 7 8<br />
1 2 3 5 6<br />
1 1 2 3 4<br />
Fig. 28:<br />
Empirical interrelationship<br />
between the irregularity<br />
of the flow profile and the<br />
relative distance a/D h from<br />
the disturbance source<br />
a = distance from disturban<br />
ce source<br />
D h = hydraulic diameter<br />
Table 2 :<br />
Uncertainty of measurement<br />
with approximately<br />
swirl-free flow as a function<br />
of the number of<br />
measuring points<br />
For example, a measuring point at a distance of 2 D h from the disturbance source<br />
would have a profile irregularity of around 40%. If the uncertainty at the measuring<br />
point is to be kept below 10%, more than 40 measuring points are necessary.<br />
From these examples you can see that the measuring errors in flow measurement are<br />
primarily due to the conditions at the measuring point, the choice of the correct probe<br />
and correct use. Instrument tolerances, on the other hand, may be disregarded.<br />
50<br />
42<br />
36<br />
32<br />
27<br />
24<br />
16<br />
14<br />
10<br />
7<br />
5
<strong>Measurement</strong>s with Vane Anemometers<br />
• Obstruction of the flow section by the probe<br />
The ideal vane probe <strong>for</strong> duct measurements is the 16 mm diameter combined<br />
flow/temperature probe. This probe may be regarded as a universal probe, because<br />
on the one hand the vane section is big enough <strong>for</strong> response effects and dirt from<br />
storage not to have too great an influence, while on the other hand the dimensions<br />
are small enough <strong>for</strong> the test aperture diameter to be within the bounds of possibility.<br />
This probe is particularly suitable <strong>for</strong> measurements in large air ducts in conjunction<br />
with a telescope. When making measurements in small duct sections, the influence<br />
of the vane section on the accuracy of measurement should not be disregarded,<br />
since it increases as the duct section decreases.<br />
The flow velocity measured increases as a function of the depth of penetration of<br />
the vane compared to the flow velocity upstream of the probe. This effect is caused<br />
by the restriction of the section of the clear flow section when the probe is inserted<br />
into the duct.<br />
Fig. 29:<br />
Restriction of section<br />
A1: Probe section in<br />
the flow path<br />
A2: Clear<br />
duct section<br />
• For an illustration of this effect, see the comparative measurement in Fig. 30<br />
between a 25 mm diameter vane probe in comparison with a Prandtl Pitot tube<br />
with an appreciably smaller section on a 250 mm diameter duct.<br />
41
42<br />
y = 0<br />
A<br />
A<br />
D=250<br />
x = 0<br />
Section A-A<br />
Distance = 7 x D<br />
Measured Values (m/s) and Results of Meas. Series<br />
with an Electronic Vane Probe (dia. 25 mm)<br />
Reference Volume Flow 1512 m 3 /h<br />
Dimension<br />
8<br />
26<br />
49<br />
81<br />
169<br />
202<br />
224<br />
242<br />
y x<br />
7..8<br />
9.5<br />
10.1<br />
10.7<br />
11.9<br />
12.5<br />
12.7<br />
12.0<br />
8.2<br />
9.6<br />
10.1<br />
10.9<br />
12.2<br />
12.5<br />
12.8<br />
11.8<br />
Reference volume flow= 1512 m 3 /h<br />
Mean velocity<br />
11,0 m/s<br />
Duct section<br />
0,0491 m 2<br />
Volume flow<br />
1937 m 3<br />
/h<br />
Deviation from<br />
reference value<br />
+28 %<br />
Fig. 30: Measuring errors due to the restriction of the clear flow section by a vane<br />
anemometer in comparison to Pitot tube measurements.<br />
The reference volume flow was determined by the inlet nozzle.<br />
• The measured values in the series of measurements with the vane anemometer<br />
increase with the depth of penetration (e.g. from 9.5 to 12.7 m/s in the vertical<br />
plane).<br />
Because of the section restriction by the vane anemometer, the mean of all the<br />
measuring points shows a higher value at around 9%. This corresponds to the<br />
theoretical volume flow increase. In fact, the measured volume flow deviates from<br />
the reference volume flow by + 28%. The additional measuring error is a systematic<br />
error associated with the strongly disturbed flow around the vane and the small<br />
depth of penetration into the duct.<br />
D=250<br />
INLET NOZZLE<br />
Measured Values (m/s) and Results of Meas. Series<br />
with a Prandtl Pitot Tube (Comparative <strong>Measurement</strong>)<br />
Reference Volume Flow 1512 m 3<br />
/h<br />
Dimension<br />
8<br />
26<br />
49<br />
81<br />
169<br />
202<br />
224<br />
242<br />
y x<br />
8.7<br />
9.1<br />
9.3<br />
9.4<br />
9.5<br />
9.7<br />
9.3<br />
8.9<br />
8.3<br />
9.2<br />
9.3<br />
9.6<br />
9.7<br />
9.7<br />
9.4<br />
8.8<br />
Mean velocity<br />
9,2 m/s<br />
Duct section<br />
0,0491 m 2<br />
Volume flow<br />
1633 m 3<br />
/h<br />
Deviation from<br />
reference value<br />
+8 %
• Backflow effects<br />
When using vane probes, the occurrence of backflow is not evident from the measured<br />
values, because all the values displayed are positive figures (the direction of<br />
rotation of the vane cannot be determined from the subsequent measuring technique).<br />
This interrelationship is also apparent from the comparative measurement<br />
illustrated in Fig. 31.<br />
•<br />
If severe backflows occur due to intrusions into the duct that are not visible from the<br />
outside (e.g. sound absorbers in a thermally insulated duct or objects left in the duct<br />
following assembly), too high air flows are measured as a rule.<br />
Recommendation: In such cases, directional display probes should be used, such<br />
as thermal probe 0635.1042 or Pitot tubes in conjunction with<br />
pressure probes.<br />
Increase in the Horizontal Velocity Profile with the<br />
Electronic Vane Anemometer (dia. 16 mm)<br />
A<br />
10 m/s<br />
5 m/s<br />
A<br />
1 D<br />
x = 0<br />
SECTION A-A<br />
D = 250<br />
AIR<br />
x (mm) y (m/s)<br />
8 3,9<br />
26 4,4<br />
49 4,6<br />
81 5,7<br />
169 8,5<br />
202 9,4<br />
224 10,5<br />
242 10,6<br />
Increase in the Horizontal Velocity Profile with the<br />
Prandtl Pitot Tube<br />
A<br />
Fig. 31: Comparison of the horizontal velocity profile measured with the vane<br />
anemometer (dia. 16 mm) and the Prandtl Pitot tube immediately after<br />
the bend. The backflow (swirl area, no defined direction of flow) is not<br />
picked up by the vane anemometer.<br />
10 m/s<br />
5 m/s<br />
A<br />
1 D<br />
x = 0<br />
SECTION A-A<br />
D = 250<br />
AIR<br />
x (mm) y (m/s)<br />
8 (-3,2)<br />
26 1,3<br />
49 7,0<br />
81 8,3<br />
169 10,1<br />
202 10,6<br />
224 11,5<br />
242 11,0<br />
43
Hints on Using Pitot Tubes<br />
• Using Pitot tubes carefully<br />
The Prandtl probe has two pressure-measuring points (static pressure and dynamic<br />
pressure). Plastic hoses are used to connect it to the differential pressure sensor.<br />
Care must be taken to ensure that the plastic hoses fit the connecting branches and<br />
any connectors used snugly. Otherwise, the difference in pressure with the<br />
environment will create disturbances in the probe and hose.<br />
The resulting pressure drop can severely distort the measurement signal. Errors of<br />
this type can also occur if the connecting hoses are damaged. Bearing this in mind,<br />
the hoses should be handled with care and checked <strong>for</strong> tightness be<strong>for</strong>e each measurement.<br />
Measuring errors are also frequently caused by the hoses being inadvertently<br />
compressed or bent.<br />
• Contamination<br />
If measurements are made of kitchen or industrial exhaust air, the dynamic pressure<br />
measurement aperture may be altered by the particles present in the air. It should be<br />
regularly visually inspected and cleaned.<br />
• Incorrect evaluation of measurement results<br />
The mean flow velocity in the duct section under test is calculated from the<br />
arithmetic mean of the individual velocities. This in turn is calculated from<br />
the dynamic pressure measured, as follows:<br />
44<br />
v = flow velocity in m/s<br />
ρ = air density in g/m 3<br />
p = differential pressure measured at the Pitot tube in hPa<br />
• Frequently, evaluation takes the <strong>for</strong>m of calculating the mean from the dynamic<br />
pressures measured and then calculating the mean flow velocity as shown above.<br />
This method is mathematically incorrect and leads to unacceptable deviations<br />
from the correctly determined value, especially with distorted flow profiles.
• Another error commonly arises from calculating with an average density of<br />
1200 g/m 3<br />
. When measuring external air flows, the actual air density can d<br />
eviate from this average by as much as ± 10%. This leads to an air flow uncertainty<br />
of up to ± 5%.<br />
This is where you can make use of the properties of the testo 452 or 454: by activating<br />
the automatic conversion of the dynamic pressure into flow velocity, the mean<br />
can be calculated directly from m/s values. The only thing to remember is that the<br />
correct air density must be entered in the configuration menu. This may be determined<br />
from tables, provided the local values <strong>for</strong> absolute pressure, temperature and<br />
if relevant the relevant humidity are known.<br />
It is advisable to record this air density value and the parameters used in calculating<br />
that value (temperature, absolute air pressure and humidity) in the log.<br />
Pitot tubes are the ideal sensors <strong>for</strong> flow measurement in the medium to high<br />
velocity range, at high temperatures or in polluted air. Below 5 m/s they have only<br />
a limited application, because the differential pressure is associated with too great<br />
errors at the lower end of the range.<br />
A usable pressure measurement can only be obtained with sensitive instruments<br />
and the greatest care. Instead, measurement with thermal or vane sensors is<br />
recommended below 5 m/s.<br />
<strong>Air</strong> flow measurement at vents<br />
As already described in the section on "Measuring errors in air flow measurement"<br />
(page 36), air flow measurements should not be made at vents, because the method<br />
used in practice is both very time-consuming and carries a high risk of error.<br />
The two frequently used methods, calculation of the mean and the loop method,<br />
are nevertheless described below.<br />
45
46<br />
LLaammiinnaarr ffllooww iinn tthhee<br />
cceennttrree ooff tthhee dduucctt<br />
Max. max. Werte value<br />
Min. min. Werte value<br />
Mean gemittelte values Werte<br />
Fig. 32:<br />
Integral measurement<br />
with a large vane or<br />
calculation of the<br />
mean with a dia. 16 mm<br />
vane probe.<br />
The air vent greatly changes the relatively uni<strong>for</strong>m flow inside the duct: areas of higher<br />
flow velocity are created at the free vent surfaces and areas of low flow velocity and<br />
swirl at the grilles. The flow profile steadies at a distance from the grille which<br />
depends on the grille design (approximately 20 cm). A flow profile which swells and<br />
declines at intervals remains.<br />
Fig. 33:<br />
Use of the testo 452<br />
Usable measurements generally require large vane diameters in this case<br />
(60 or 100 mm diameter), because with such large diameters the flow values<br />
are integrated and the mean calculated over a larger area.<br />
If small-diameter vanes are used (e.g. 16 mm), the mean has to be calculated at<br />
intervals with a corresponding number of measuring points.
When large vanes are used, looped examination of the grille section (in conjunction<br />
with mean calculation over time) is sufficient.<br />
<strong>Measurement</strong><br />
at intervals<br />
Mean value<br />
over time<br />
Fig. 34:<br />
Grille measurement<br />
at the duct exit<br />
Once the mean air velocity has been determined, the volume flow may be calculated<br />
by multiplying this value by the clear grille flow section.<br />
Example: V = 1 m/s x 0.8 x 0.2 m x 0.5 m<br />
where: 1 m/s measured velocity, 0.2 m x 0.5 m grille area;<br />
0.8 : 20 % of the grille area covered by fins.<br />
The following sources of error affect the measurement result:<br />
• Irregular vane guide speed<br />
To allow <strong>for</strong> this, several measurements should be made, e.g. once with the probe<br />
guided in vertical loops and once in horizontal loops. The mean obtained should<br />
be used in further calculations.<br />
• <strong>Air</strong> flow affected by the vane and the person making the measurement<br />
Avoid blocking the air exit unnecessarily, because any resistance to the flow will<br />
affect the measurement result. If possible, use a large vane with a telescope so<br />
that only the vane probe is in the flow profile to be measured.<br />
47
• Irregular grille exposure<br />
The exposure of the grille section depends on the air velocity in the duct upstream<br />
of the air vent. Fig. 35 shows an air duct with 3 grilles. The flow profile at the first<br />
grille is very irregular, because the greatest velocity of flow occurs in the duct<br />
upstream of this vent.<br />
In the right-hand part of the grille there is a backflow, i.e. ambient air is sucked into<br />
the duct. Moreover, the direction in which the fresh air is blown out deviates sharply<br />
from the vertical.<br />
48<br />
Grille 3 Grille 2<br />
<strong>Air</strong> duct without section reduction<br />
Grille 1<br />
Fig. 35: Schematic View (Simplified) of the Velocity Profile at the <strong>Air</strong> Vent to<br />
Illustrate the Irregular Exposure of the Grille Section<br />
• The distance from the vane to the air vent cannot be defined<br />
The air velocity increases between the vanes. Directly downstream, areas of swirl<br />
with no defined direction of flow occur, irrespective of the angle of deflection. The<br />
use of vanes is confined to directed flows with no marked velocity peaks.<br />
The vane should there<strong>for</strong>e be guided across the grille surface at a certain minimum<br />
distance (guide value 5 cm). As the distance from the air vent increases, the velocity<br />
profile does admittedly even out, but on the other hand the jet of air broadens as the<br />
distance increases and the mean velocity decreases. It is difficult to determine the<br />
section area to be used in the volume flow calculation - see below.
• The clear flow section to calculate the volume flow cannot be defined<br />
The area corresponding to the measured velocity can only be estimated. In the case<br />
of air grilles, the clear flow section is taken as a starting point. Determining the area<br />
in this way is only possible with straight lines (no deflection). In all other cases, the<br />
air flows are too high. The same applies to multi-part grilles (e.g. with quantity<br />
adjustment).<br />
In many cases the reduction in section due to the grille fittings is estimated after<br />
measurement in order to reach approximately the desired air flow.<br />
Summary<br />
<strong>Measurement</strong> of mean air velocity at air vents by the loop method only yields verifiable<br />
(repeatable) results if the entire grille section is evenly exposed and the vanes are<br />
straight (without deflection).<br />
Such a case only rarely occurs in practice, and the loop method is there<strong>for</strong>e of only<br />
limited use <strong>for</strong> acceptance measurements and should only be used <strong>for</strong> estimated<br />
measurements. This applies analogously to calculation of the mean at intervals<br />
using small-section probes.<br />
<strong>Measurement</strong> at air vents can be improved by using a high-resistance foam duct<br />
attachment or clamping plates, as shown in Fig. 36. At the end of the duct a grid<br />
measurement is made by the trivial method, e.g. using a Prandtl Pitot tube.The<br />
length of the duct must be at least 4 times the hydraulic diameter<br />
(4 D h; D h = 4 A/U, calculated from the grille section).<br />
With an irrotational flow and low pressure drop due to the duct attachment, this<br />
method yields sufficiently accurate results. In theory, however, the air flow measured<br />
is always too small.<br />
49
50<br />
Duct attachment<br />
Seal Measuring plane<br />
Fig. 36:<br />
Duct attachment with<br />
grid measurement<br />
(from the Manual of <strong>Air</strong><br />
Conditioning Engineering,<br />
Volume 3 [5])<br />
A tapered duct attachment is often used <strong>for</strong> adjustment work on smaller air vents, a<br />
vane being placed at its centre in the constrained flow. In this case the absolute value<br />
of the air flow is not significant, because all that is required is to balance the individual<br />
air vents. The total air flow in the duct is determined by grid measurements.<br />
The volume flow at air vents can be accurately measured by the zero method.<br />
Because of the large amount of apparatus required, however, this method is only<br />
exceptionally used in practice. Other methods (e.g. the airbag method, which<br />
are also cumbersome, however) are described in the Manual of <strong>Air</strong> Conditioning<br />
Engineering [8].<br />
<strong>Measurement</strong>s at Suction Apertures<br />
As already explained, measurement at outlet grilles (blowers) is critical, but nevertheless<br />
feasible within certain limits. While the flow profile is certainly influenced by the<br />
grille, it is still maintained even at some distance <strong>for</strong> the grille as a rule, and the<br />
velocity can there<strong>for</strong>e be measured.<br />
The conditions are different at apertures which extract air from the room. Even<br />
without the disturbing effects of a grille, the lines of flow are not directional and the<br />
flow profile is highly unhomogeneous.
Suction<br />
- <strong>Measurement</strong> using<br />
a funnel<br />
Blowing<br />
- <strong>Measurement</strong> using a<br />
large vane<br />
- Calculation of the mean<br />
at points/intervals<br />
Velocity probe<br />
Fig. 37: Lines of a flow at Fig. 38: Determining the volume flow<br />
suction apertures with a measuring funnel<br />
The reason is that the partial vacuum in the duct draws air out of the room in a funnel<br />
shape. At even a short distance from the aperture there is no defined area in the<br />
room over which a measurement could be made, <strong>for</strong> example a grid measurement<br />
with calculation of the mean, to determine the volume flow. Only the duct measurement<br />
yields reproducible results.<br />
Disk valves are a special case. The volume flow drawn off is adjusted by rotation of<br />
the valve. Here too, the clear flow section cannot be determined, being at the core of<br />
the valve (an annulus); nor can a velocity probe be placed at this point.<br />
Measuring funnels of various sizes are available <strong>for</strong> such applications. These create<br />
defined flow conditions at a distance from the disk valve with a fixed section. The<br />
velocity probe is positioned centrally here and fixed.<br />
The volume flow drawn off is calculated from the measured value of the velocity probe<br />
multiplied by the funnel factor (e.g. funnel factor 20).<br />
51
Determining volume flow by the fan characteristic<br />
Determining the volume flow at the central unit of the air conditioning plant by means<br />
of a differential pressure and speed measurement is permissible only if the equipment<br />
characteristic is available. This can either be taken on the manufacturer's test bench<br />
or in situ by calibration (see also draft DIN 4796 [7]).<br />
If the volume flow is taken from the fan characteristic (manufacturer's reference<br />
material), considerable deviations from the actual volume flow can occur depending<br />
on where the fan is fitted (see illustration in Fig. 39).<br />
The fan characteristic is determined on a standardised test bench. The upstream and<br />
downstream conditions may vary considerably from those at the central unit.<br />
52<br />
Differential pressure<br />
Meas.<br />
value<br />
➀ Conditions in situ<br />
➁ Theoretical fan characteristic<br />
1<br />
2<br />
Error<br />
Correct value Volume flow<br />
Fig. 39:<br />
Errors of interpretation<br />
when determining<br />
volume flow from the<br />
fan characteristic
Measuring the <strong>Ambient</strong> <strong>Air</strong> Velocity<br />
<strong>Ambient</strong> air velocity is a very important parameter in connection with thermal com<strong>for</strong>t<br />
of people in common rooms.<br />
Mean air velocity<br />
0,5<br />
0,45<br />
0,4<br />
0,35<br />
0,3<br />
0,25<br />
0,2<br />
0,15<br />
0,1<br />
0,05<br />
0<br />
20<br />
Degree of turbulence<br />
21 22 23 24 25 26 27 ° C<br />
Preparing <strong>for</strong> and Carrying out <strong>Measurement</strong>s<br />
Fig. 40:<br />
Mean air velocities as<br />
a function of temperature<br />
and degree of air<br />
turbulence in the<br />
com<strong>for</strong>t range<br />
In principle, measurements should be made in the room with all furniture and equipment<br />
in place, because furniture and items of equipment have a considerable influence<br />
on the flow in the room.<br />
Be<strong>for</strong>e starting to make measurements, the marginal conditions must be established<br />
and adjusted accordingly. In particular, the setting of the air vents and the difference<br />
between the fresh air and ambient air temperature should be checked, as these have<br />
the greatest influence on the air distribution and ambient air velocity in the common<br />
area.<br />
5 %<br />
20 %<br />
40 %<br />
<strong>Air</strong> temperature<br />
53
It must also be ensured that an undesired exchange of air is not taking place at the<br />
surfaces enclosing the room (windows and doors), as this can cause draught phenomena<br />
not attributable to the air conditioning system.<br />
Measuring points are normally selected only with the area used by people. Here<br />
the air flow from the adjacent air vent can be made visible by means of test smoke<br />
(N.B.: flow velocity probes should not be exposed to smoke!).<br />
If draughts are detected in the area of the ankles, a check should be made whether<br />
this is due to cold air downflow at windows. The mean ambient air velocity, (scalar)<br />
degree of turbulence and air temperature should then be determined at the critical<br />
points thus identified, preferably at heights of 0.1 m (ankle area), 1.3 m (head height<br />
when seated) and 1.8 m (head height when standing).<br />
Pressure <strong>Measurement</strong><br />
The difference in static pressures is measured as part of acceptance measurements<br />
to check the pressure drop caused by fittings (such as air filters). As Fig. 41 shows,<br />
the following points should be borne in mind when making measurement holes:<br />
54<br />
• No dynamic flow components should be allowed to affect the pressure measuring<br />
point. The flow must be parallel to the wall.<br />
• The measurement holes should be as small as possible (D= 1-2 mm) and<br />
must be burr-free. The pressure measuring connections should be attached<br />
to the outside of the duct, centred on the hole, to <strong>for</strong>m a tight seal.
WRONG WRONG RIGHT<br />
<strong>Air</strong> flow <strong>Air</strong> flow <strong>Air</strong> flow<br />
Duct<br />
Measuring hose<br />
Burr Ø 1to 2 mm<br />
Duct<br />
Pressure-measuring<br />
connection<br />
Measuring hose<br />
Fig. 41: Errors in making pressure measuring points on air ducts.<br />
The illustration on the right shows the correct way.<br />
When measuring static pressure against ambient pressure, the differences in height<br />
between the static pressure measuring point and the ambient pressure measuring<br />
point should be corrected on the measuring instrument. This problem can be avoided<br />
by having the two pressure measuring points (open inlet to the instrument and static<br />
pressure measuring point on the duct) at the same height.<br />
CO2 <strong>Measurement</strong> as a Means<br />
of Assessing Room <strong>Air</strong> Conditions<br />
In the German-speaking countries of Europe this is still in its infancy, whereas in<br />
Scandinavia, the US and Japan it is already firmly anchored in the consciousness of<br />
air conditioning and ventilating technicians and engineers and the subject of much<br />
discussion.The topic is CO 2 measurement as a basis <strong>for</strong> needs-oriented ventilation<br />
control.<br />
Why should a parameter virtually disregarded until now be introduced into everyday<br />
air conditioning and ventilation measuring engineering as a new parameter and that<br />
parameter made an established component of acceptance measurements along with<br />
temperature, humidity, air velocity and pressure?<br />
In large buildings and office complexes in particular, it is no longer possible today to<br />
adjust the fresh air supply quickly by opening windows when required. The job an air<br />
conditioning plant is required to do is precisely to deliver the optimum atmospheric<br />
conditions to the right room at the right time, having regard to an optimum sensation<br />
of com<strong>for</strong>t <strong>for</strong> the people spending time and working in the room.<br />
Duct<br />
Pressure-measuring<br />
connection<br />
Measuring hose<br />
55
And of course it must also operate in an energy-efficient way.<br />
How does this look in practice?<br />
On the one hand, saving energy may be the primary consideration, leading to an air<br />
conditioning plant oriented to a minimum exchange of air in the individual rooms and<br />
operating with a high proportion of ambient air. Here, naturally, draughts in the rooms<br />
are kept to a minimum.<br />
However, bottlenecks build up in the "fresh" air supply, particularly when more people<br />
than average are in the ventilated rooms. General discom<strong>for</strong>t sets in, accompanied by<br />
loss of concentration, lassitude and a drop in efficiency. All signs of the much-talkedabout<br />
"sick building syndrome".<br />
The other alternative is <strong>for</strong> the ventilation plant to be adjusted <strong>for</strong> the maximum number<br />
of people who can be in the rooms. In this case, while sufficient fresh air is certainly<br />
always available, the general sensation is an unpleasant one, and it is felt to be<br />
"draughty". A further effect of this is that more energy is consumed on average than<br />
the situation requires.<br />
The measured CO 2 value is in fact the ideal indicator of ambient air consumption, showing<br />
whether the proportion of fresh air in the air supply needs to be increased or may<br />
be decreased. In other words, the CO 2 content is regarded as the parameter that enables<br />
a direct decision to be taken on air quality.<br />
Unpolluted fresh air has a CO 2 content of around 350 ppm. If a person in a sedentary<br />
occupation is assumed to emit approximately 20 l/h CO 2, there is a high CO 2 concentration<br />
in a closed room despite the supply of external air.<br />
56
External <strong>Air</strong> Supply per Person CO2 Concentration<br />
[m 3 /h/person] [ppm]<br />
3,8 5000<br />
8,5 2500<br />
14,9 1500<br />
25,6 1000<br />
Table 3:<br />
Steady-state value of<br />
CO 2 concentration in<br />
a room as a function<br />
of external air supply<br />
Control engineering already takes these conditions into account, as more and more<br />
plants are being fitted with CO 2 measuring transducers to adjust the air supply to the<br />
conditions required at any one time.<br />
Although the limits to be observed have not yet been laid down by law <strong>for</strong> the various<br />
applications, there are nevertheless established experience values, which vary from<br />
1000 to 7000 ppm depending on the application.<br />
CO2 probes in conjunction with a data logger offer the best solution <strong>for</strong> adjustment<br />
work on air conditioning plants and control measurements in rooms with a constantly<br />
changing number of people. Random measurements can be carried out just as satisfactorily<br />
as observation over longer periods. See testo 454 with CO 2 probe.<br />
General Hints on Using Measuring Instruments<br />
• Measuring instruments should be checked and recalibrated if necessary well in<br />
advance of use. In the case of measurements under ISO 9000 in particular, the<br />
measuring instruments have to be recalibrated at specified intervals. Testo offers<br />
calibration certificates <strong>for</strong> the complete measuring system (i.e. display unit and<br />
probes <strong>for</strong> ISO 9000 certification). Testo is an approved DKD laboratory <strong>for</strong><br />
temperature and humidity.<br />
• Enough spare batteries should be carried when making measurements. Storage<br />
batteries should be fully charged and have enough available storage capacity.<br />
57
• When making the measurement, make sure that the ambient temperature lies within<br />
the range specified by Testo. When measuring instruments are carried about in cold<br />
winter weather (e.g. in a car boot), enough time must be allowed <strong>for</strong> the instruments<br />
to come up to their operating temperature. Measuring instruments should be left in<br />
the case while warming up to avoid condensation.<br />
• If the measured value displayed fluctuates greatly, it is advisable to calculate a<br />
mean, either by taking the mean of the displayed values over a period of time or by<br />
calculating the mean of a large number of different measuring points. The individual<br />
values used in calculating the mean should also be logged. This is essential <strong>for</strong> a<br />
clear understanding of the measurement results in subsequent checks.<br />
Handling Probes and Sensors<br />
• <strong>Air</strong> flow measurement probes should be compared with calibrated reference probes<br />
from time to time. The reference probes are not exposed to the wear and tear of<br />
everyday use and thus remain accurate over long periods.<br />
Neither a wind tunnel nor reference probes are needed <strong>for</strong> a simple routine check.<br />
Vanes need only be blown on gently. The vane will turn absolutely evenly with no<br />
incidental noise (slight rattle). A vane in perfect condition will turn evenly until it comes<br />
to a stop. If the vane wobbles be<strong>for</strong>e coming to a stop, this indicates that individual<br />
fins are warped. If vanes do not turn when blown on gently, but tend to run backwards<br />
when started up at higher flow velocities, the bearings are dirty and should be cleaned<br />
in accordance with the manufacturer's instructions.<br />
For thermal velocity probes, visual inspection is generally sufficient.<br />
Comparative measurements of different types of velocity probes, e.g. comparisons<br />
between a thermal probe and a vane, should only be made under ideal flow conditions.<br />
The flow conditions should be as close as possible to calibration conditions,<br />
i.e. measurement in laminar flow, measurement in the free jet (350 mm),<br />
not in the duct.<br />
Accurate comparative measurements take a great deal of time and require a lot of<br />
equipment (wind tunnel and reference system). In practice, the ambitious accuracies<br />
guaranteed in the reference material play only a subordinate role. In<br />
58
everyday use, the accuracy and meaningfulness of the measurement results is<br />
determined almost exclusively by the correct use of the measuring instruments<br />
and the choice of the right measuring point.<br />
• Visual inspection suffices <strong>for</strong> surface temperature probes.<br />
The band probe or pipe surface probe<br />
(with rolled sprung thermocouple bands)<br />
should be inspected <strong>for</strong> probe breakage<br />
from time to time.<br />
Fig. 42:<br />
Band Probe 0600.0194<br />
The accuracy of temperature probes <strong>for</strong> air and immersion measurements is not<br />
critical provided they are adjusted as specified by Testo.<br />
• Humidity probes are maintenance-free as a rule. An inspection and calibration set<br />
is available <strong>for</strong> occasional checking and adjustment.<br />
• Differential pressure probes should be calibrated at zero be<strong>for</strong>e each measurement<br />
(see instrument description). To avoid overload, the measurement should be started<br />
with a probe with a high measuring range. Precision probes with a small measuring<br />
range can then be used <strong>for</strong> more accurate measurements at a known pressure.<br />
59
Presenting Testo Measuring Instruments<br />
Testo portable hand-held measuring<br />
instruments come in three<br />
categories:<br />
1)Compact test instruments <strong>for</strong><br />
precise point measurements.<br />
The measurement data are<br />
not documented. Ask <strong>for</strong><br />
our measuring instrument<br />
catalogue.<br />
2)With professional system<br />
instruments, documenting the<br />
measured values is the main<br />
consideration: storage and<br />
printing out of data and processing<br />
using your PC.<br />
Tedious writing-up is a thing of<br />
the past, and reading and<br />
transfer errors are eliminated.<br />
Send <strong>for</strong> detailed in<strong>for</strong>mation<br />
or contact us to arrange a<br />
demonstration.<br />
3)Measured data storage units<br />
automatically measure and<br />
record measured data over<br />
long periods. Data loggers of<br />
this type are used to monitor<br />
air conditioning and refrigera<br />
tion plants, to make series of<br />
measurements <strong>for</strong> instance on<br />
test benches and as part of<br />
quality assurance in produc<br />
tion, storage and transport.<br />
The data stored are processed<br />
using the PC. Send <strong>for</strong> detailed<br />
in<strong>for</strong>mation or contact us to<br />
arrange a demonstration.<br />
60<br />
Measuring<br />
Instrument<br />
Measuring<br />
Infrared<br />
Printer<br />
Printing out<br />
PC-<br />
Software<br />
Processing<br />
measured data<br />
Recorder<br />
Printing out<br />
and storing
Our consistent system approach offers decisive advantages:<br />
• The recorder simply plugs in to turn the Testo measuring instrument into a handy,<br />
intelligent measuring system.<br />
The measured data can be stored and printed out on location.<br />
Cableless infrared printing is also possible. No more time-consuming writing-up,<br />
and reading and transfer errors are eliminated.<br />
• Testo Com<strong>for</strong>t software communicates with all the equipment in the system and<br />
evaluates the measured data.<br />
• Probes and accessories fit all system equipment.<br />
A carefully designed system that brings benefits to the user.<br />
Calibration certificates<br />
Testo offers calibration certificates <strong>for</strong> the following parameters: temperature, humidity,<br />
velocity, pressure, flue gas, luminous intensity and rpm.<br />
As a rule, standard calibration certificates<br />
with fixed measuring points and special<br />
calibration certificates with selectable<br />
measuring points are available <strong>for</strong> each<br />
parameter. Testo is also an approved<br />
calibration laboratory <strong>for</strong> temperature,<br />
temperature of dew point and relative<br />
humidity and is thus able to issue DKD<br />
certificates <strong>for</strong> measuring instruments<br />
and probes.<br />
Please ask <strong>for</strong> detailed in<strong>for</strong>mation.<br />
61
Summary of Instrument Data<br />
System instruments<br />
testo 700 / 701<br />
Pt 10<br />
-200 to +800°C<br />
testo 781<br />
Quar.<br />
(Resolution 0.01°C)<br />
-40 to +300°C<br />
testo 900 / 901<br />
Thermocouple<br />
-40 to +1370°C<br />
testo 9500<br />
Thermocouple/<br />
NTC<br />
-200 to +1760°C<br />
testo 9600<br />
Thermocouple /<br />
NTC<br />
Explosionproof and<br />
firedampproof, appropriate<br />
<strong>for</strong> verification<br />
-200 to +1370°C<br />
Data loggers<br />
testostor 171<br />
NTC<br />
-50 to +120°C<br />
62<br />
Temperature<br />
Humidity<br />
System instruments<br />
testo 600 / 601<br />
0 to 100%RH<br />
-20 to +140°C<br />
with dew point<br />
determination<br />
Data loggers<br />
testostor 171<br />
0 to 100%RH<br />
-50 to +120°C<br />
Velocity<br />
System instruments<br />
testo 490 / 491<br />
0 to 60 m/s<br />
-40 to +350°C<br />
Vane probes<br />
Thermal probes<br />
Combined<br />
Measuring<br />
Instruments<br />
System instruments<br />
testo 451<br />
-120 to +1370°C<br />
0 to 100%RH<br />
0.2 to 60 m/s<br />
testo 452<br />
-120 to +1370°C<br />
0 to 100%RH<br />
0 to 100 m/s<br />
±100 hPa<br />
(Differential pressure)<br />
testo 454<br />
Measuring instrument<br />
and data logger<br />
-200 to +1370°C<br />
0 to 100%RH<br />
0 to 60 m/s<br />
±100 hPa (Diff.pressure)<br />
0 to 2000 hPa(Absolute<br />
pressure)<br />
0 to 1 Vol% CO2 30 Hz to 300 kHz<br />
0 to 20 mA<br />
-10 to +10 mV<br />
100 W to 300 kW
Surface Probes<br />
1) Rugged Pt 100 probe with a broad measuring tip<br />
<strong>for</strong>measurements on flat surfaces<br />
testoterm<br />
testoterm<br />
2) Rugged NiCr-Ni probe with a broad measuring tip <strong>for</strong><br />
measurements on flat surfaces<br />
3) High-temperature surface probe with sprung<br />
thermocouple band<br />
testoterm<br />
4) Velcro probe <strong>for</strong> attachment to pipes etc. <strong>for</strong> long-term<br />
measurements<br />
5) Magnetic probe <strong>for</strong> high temperatures<br />
a)<br />
a) Adhesion approx. 10 N, b) Adhesion approx. 20 N<br />
b)<br />
6) Clamp-on pipe probe <strong>for</strong> temperature measurement on<br />
pipes up to 2" diameter<br />
7) Infrared probe <strong>for</strong> contactless temperature measurement<br />
on live, inaccessible and rotating parts<br />
Measuring 5 7.5 14 21 33 mm<br />
spot diameter<br />
Measuring 16 25 50 76 130 mm<br />
distance<br />
testo<br />
Measuring<br />
Range<br />
-50 to +400 °C<br />
-200 to +600 °C<br />
-200 to +700 °C<br />
-50 to +150 °C<br />
-50 to +400 °C<br />
-50 to +170 °C<br />
-60 to +130 °C<br />
-18 to +260 °C<br />
Sensor<br />
Pt100<br />
(Class B)<br />
NiCr-Ni<br />
NiCr-Ni<br />
(Class 2)<br />
Pt100<br />
NiCr-Ni<br />
NiCr-Ni<br />
(Class 2)<br />
NiCr-Ni<br />
(Class 2)<br />
Infraredsensor<br />
t 99<br />
(sec)<br />
40<br />
25<br />
3<br />
40<br />
–<br />
–<br />
5<br />
2<br />
Probe Meas.<br />
tube length tip diam.<br />
150 mm<br />
150 mm<br />
200 mm<br />
130 mm<br />
Probe<br />
length<br />
180 mm<br />
8 mm<br />
4 mm<br />
8 mm<br />
25 mm<br />
25 mm<br />
65 mm<br />
–<br />
63
Immersion Probe<br />
8) Probe <strong>for</strong> measurement in liquids and powdery<br />
substances.<br />
testoterm<br />
Penetration Probe<br />
9) Watertight probe with ground measuring tip, boilproof<br />
<strong>Air</strong> Probes<br />
10) Ultra-fast response probe <strong>for</strong> measurement in liquids<br />
and gases<br />
testoterm<br />
11) High-precision probe <strong>for</strong> air / gas temperature<br />
measurements<br />
testoterm<br />
12) Globe thermometer <strong>for</strong> radiant heat measurement<br />
Thermocouples and Adapters<br />
13) Stick-on thermocouple <strong>for</strong> surface<br />
measurementsCarrier material: aluminium foil<br />
14) Adapter to connect thermocouples and probes<br />
with bare wire ends<br />
a)<br />
b)<br />
Measuring<br />
Range<br />
-200 to +600 °C<br />
-200 to +600 °C<br />
Measuring<br />
Range<br />
-200 to +600 °C<br />
Measuring<br />
Range<br />
Max. temp.<br />
+200 °C<br />
Sensor<br />
-200 to +600 °C NiCr-Ni<br />
-40 to +130 °C<br />
-25 to 80 °C<br />
Sensor<br />
NiCr-Ni<br />
Pt100<br />
Sensor<br />
Pt100<br />
Dimensions<br />
Thickness<br />
0.1 mm<br />
ø Extension<br />
2.0 x 0.2 mm<br />
Attachment to<br />
measuring<br />
point<br />
With standard<br />
adhesives or silicone<br />
heat paste,<br />
part no.<br />
0554.0004<br />
Supplied<br />
as<br />
Pack<br />
of 2<br />
All Pt100 data to DIN IEC 751, Class A.<br />
Thermocouple technical data to DIN IEC 584 Part 2, Class 1.<br />
64 Temperature probes with PtRh-Pt or FeCu-Ni loggers on request.<br />
NTC<br />
t 99<br />
(sec)<br />
1<br />
20<br />
t 99<br />
(sec)<br />
30<br />
t 99<br />
(sec)<br />
9<br />
60<br />
Probe tube<br />
length<br />
150 mm<br />
150 mm<br />
Probe tube<br />
length<br />
150 mm<br />
Probe tube<br />
length<br />
150 mm<br />
150 mm<br />
P.t.diameter<br />
1.5 mm<br />
3 mm<br />
M.t.diameter<br />
3 mm<br />
M.t.diameter<br />
0.5 mm<br />
9 mm<br />
ø Ball<br />
approx. 150 mm
Humidity Probes<br />
15) <strong>Air</strong> probe <strong>for</strong> humidity and temperature measurements<br />
16) High-temperature humidity probe <strong>for</strong> measurement<br />
e.g. in ducts or bulk material<br />
testoterm<br />
17) High-temperature humidity<br />
probe <strong>for</strong> measurement<br />
e.g. in ducts or bulk<br />
material<br />
testo<br />
Pressure Probes<br />
testo<br />
term<br />
18) Pressure-resistant humidity probe <strong>for</strong> measurement in<br />
compressed air plants with standard plug<br />
19) Differential pressure probes a) and b) <strong>for</strong><br />
measurement of flow velocity (in conjunction with Pitot<br />
tube) and measurement of differential pressure<br />
0638.1445<br />
Ø Pitot tube connection dia. 5 mm<br />
Absolute pressure probe c) <strong>for</strong> absolute pressure measurement<br />
20) Pitot tubes, various lengths, diameters and materials,<br />
<strong>for</strong> measurement of flow velocity (in conjunction<br />
with differential pressure probes)<br />
testo<br />
Measuring<br />
range<br />
a) ±100 hPa Diff.-pressure<br />
b)<br />
c)<br />
Measuring<br />
range<br />
0 to 100 %RH capacitive<br />
(Probe tip) NTC<br />
-20 to +70 °C<br />
0 to100 %RH capacitive<br />
-20 to +140 °C NTC<br />
0 to 100 %RH capacitive<br />
-20 to +140 °C NTC<br />
0 to 100 %RH<br />
Pressure dew<br />
point t pd:<br />
-50 to +40 °C<br />
±10 hPa<br />
2 bar<br />
Material<br />
a) Brass<br />
b) Brass<br />
c) Stainless<br />
Steel<br />
Sensor<br />
capacitive<br />
NTC<br />
Measuring<br />
system<br />
Diff.-pressure<br />
Abs. pressure<br />
Temp.max<br />
350 °C<br />
350 °C<br />
500 °C<br />
t 90<br />
(sec)<br />
10<br />
20<br />
20<br />
Length<br />
Overall<br />
length<br />
245 mm<br />
Probe<br />
tube<br />
300 mm<br />
Probe<br />
tube<br />
1500<br />
mm<br />
Accuracy<br />
Ø<br />
21 mm<br />
Probe<br />
tube<br />
12 mm<br />
Tip<br />
12 mm<br />
Overall length 300<br />
mm<br />
Standard plug<br />
connection<br />
System accuracy <strong>for</strong> 15) - 18): ±2 %RH (2 to 98 %RH) ±0.4 °C (0 to50 °C) ±0.5 °C (residual range)<br />
± 0.1 hPa (0 to 20<br />
hPa)<br />
± 0.5 % o. vm. (20 to 100<br />
hPa)<br />
± 0.03 hPa<br />
± 5 hPa<br />
Length Ø<br />
500 mm 7 mm<br />
350 mm 7 mm<br />
300 mm 4 mm<br />
65
Vane Probes<br />
(System accuracy with instrument)<br />
21) Combined vane/temperature probe<br />
(plug-in)*, Ø 25 mm<br />
22) Combined vane/temperature probe<br />
(plug-in)*, Ø 16 mm<br />
23) Low-temperature anemometer probe with handle,<br />
operating range -20…+60 °C<br />
rm<br />
24) High-temperature probe <strong>for</strong> long-term<br />
measurements up to +350 °C,<br />
Short-term measurements up to +500 °C<br />
25) Shell anemometer (not shown)<br />
26) Vane Ø 60 mm <strong>for</strong> measurement at the duct outlet,<br />
with pull-out telescope, operating range<br />
-20 to +60°C<br />
27) Vane Ø 100 mm <strong>for</strong> measurement at grille outlets, 0.2 to15 m/s Vane ±0.3 m/s 280 mm 100<br />
with handle (not shown)<br />
mm<br />
* Plug-in probes also require a handle or telescope (see ordering details)<br />
** For short-term measurements<br />
testoterm<br />
Thermal Velocity Probes<br />
28) Value-<strong>for</strong>-money rugged probe <strong>for</strong> measurements at<br />
the lower end of the velocity range<br />
66<br />
testoterm<br />
29) Rugged probe with telescope <strong>for</strong> measurements at<br />
the lower end of the velocity range<br />
30) Fast-response probe with telescope <strong>for</strong> measurements<br />
at the lower end of the velocity range, with flow direction<br />
detection<br />
Measuring<br />
range<br />
0.4 to 40.0 m/s<br />
-30 to +140<br />
°C**<br />
0.4 to 60.0 m/s<br />
-30 to +140<br />
°C**<br />
0.6 to 40.0 m/s<br />
0.4 to 20.0 m/s<br />
-40 to +350 °C<br />
0.5 to 35 m/s<br />
0.25 to 20.0 m/s<br />
Measuring<br />
range<br />
0 to10.00 m/s<br />
-20 to +70 °C<br />
0 to 10.00 m/s<br />
-20 to +70 °C<br />
0 to 10.00<br />
m/s<br />
0 to +50 °C<br />
Sensor<br />
Vane ±1 %<br />
NiCr-Ni of final value<br />
Vane<br />
NiCr-Ni<br />
Vane<br />
Vane<br />
NiCr-Ni<br />
Vane<br />
Sensor<br />
Hot ball<br />
NTC<br />
Hot ball<br />
NTC<br />
Hot wire<br />
NTC<br />
Accuracy<br />
±0.4 m/s<br />
(up to 40<br />
m/s)<br />
±2 %<br />
of final value<br />
±2.5 %<br />
of final value<br />
±0.3 ms<br />
±5 % o. mv.<br />
±0.2 m/s<br />
±2 % o.<br />
mv.<br />
Probe<br />
length<br />
150 mm<br />
190 up to<br />
850 mm<br />
160 up to<br />
760 mm<br />
Probe<br />
length<br />
180<br />
mm<br />
180<br />
mm<br />
190<br />
mm<br />
560<br />
mm<br />
440<br />
to<br />
1100<br />
mm<br />
Tip<br />
dia.<br />
25<br />
mm<br />
16<br />
mm<br />
16<br />
mm<br />
25<br />
mm<br />
60<br />
mm<br />
Ø<br />
Tip dia.<br />
4 mm<br />
4 mm<br />
Hot ball accuracy: ±0.05 m/s, ±2.5 % of m.v.(0 to 2 m/s) ±0.5 m/s, ±5 % of measured value (2 to 10 m/s)<br />
Temperature compensation: < 0.2% of measured value/°C (-10 to+60 °C)
Sources and Bibliography<br />
68<br />
[1]<br />
VDI 2080: Measuring Methods and Measuring Instruments <strong>for</strong> <strong>Air</strong><br />
Conditioning Plants<br />
October 1984<br />
[2]<br />
VDI 2079: Acceptance Testing of <strong>Air</strong> Conditioning Plants<br />
March 1983<br />
[3]<br />
DIN 1946 Teil 2: <strong>Air</strong> Conditioning Engineering, Health Requirements<br />
January 1994<br />
[4]<br />
Glück, B: <strong>Air</strong> Conditioning Engineering, Health Requirements<br />
GI Domestic Engineering, Structural Physics, Environmental<br />
Engineering 1993, Volume 3<br />
[5]<br />
<strong>Air</strong> Conditioning Engineering Lecturers' Working Party: Manual of<br />
<strong>Ambient</strong> <strong>Air</strong> <strong>Measurement</strong>, Volume 3<br />
[6]<br />
DIN 33403, Part 1: <strong>Air</strong> Conditions at Work and in the Working Environment,<br />
April 1984.<br />
[7]<br />
DIN 4796 Part 1 and Part 2: Measuring the Efficiency of <strong>Air</strong> Conditioning Plant<br />
Draft, September 1991<br />
[8]<br />
<strong>Air</strong> Conditioning Engineering Lecturers' Working Party: Manual of<br />
<strong>Ambient</strong> <strong>Air</strong> <strong>Measurement</strong><br />
Volume 1: Fundamentals
The current addresses of our subsidiaries and agents worldwide can be found at www.testo.com<br />
0981.0453/hd/R/11.2004