Comprehensive IT Monitoring … at a fraction of the ... - Würth Phoenix
Comprehensive IT Monitoring … at a fraction of the ... - Würth Phoenix
Comprehensive IT Monitoring … at a fraction of the ... - Würth Phoenix

You also want an ePaper? Increase the reach of your titles
YUMPU automatically turns print PDFs into web optimized ePapers that Google loves.
www.wuerth-phoenix.com/neteye<br />
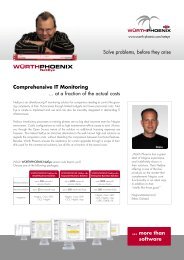
Solve problems, before <strong>the</strong>y arise<br />
<strong>Comprehensive</strong> <strong>IT</strong> <strong>Monitoring</strong><br />
… <strong>at</strong> a <strong>fraction</strong> <strong>of</strong> <strong>the</strong> actual costs<br />
NetEye is an all-embracing <strong>IT</strong> monitoring solution for companies needing to control <strong>the</strong> growing<br />
complexity <strong>of</strong> <strong>the</strong>ir <strong>IT</strong> processes through limited budgets and lower personnel costs. Net-<br />
Eye is simple to implement and use and can also be smoothly integr<strong>at</strong>ed in demanding <strong>IT</strong><br />
infrastructures.<br />
Tedious introductory processes or training phases are no big deal anymore even for Nagios<br />
newcomers. Costly configur<strong>at</strong>ions as well as high maintenance efforts cease to exist. Moreover,<br />
through <strong>the</strong> Open Source n<strong>at</strong>ure <strong>of</strong> <strong>the</strong> solution no additional licensing expenses are<br />
foreseen. This makes NetEye an <strong>at</strong>tractive altern<strong>at</strong>ive to <strong>the</strong> well- known high end solutions as<br />
regards <strong>the</strong> acquisition costs, without dreading <strong>the</strong> comparison between functional fe<strong>at</strong>ures.<br />
Besides, Würth <strong>Phoenix</strong> ensures <strong>the</strong> assistance for current upgrades through a scope <strong>of</strong> benefits<br />
usual for <strong>the</strong> commercial solutions, but all this <strong>at</strong> a <strong>fraction</strong> <strong>of</strong> <strong>the</strong> actual costs.<br />
Which WÜRTHPHOENIX NetEye version suits best to you<br />
Choose one <strong>of</strong> <strong>the</strong> following packages:<br />
Recommended for<br />
Recommended for<br />
WÜRTHPHOENIX NetEye sbs<br />
Small Business Solution<br />
up to 200 network/<br />
service checks<br />
up to 20 monitored hosts<br />
WÜRTHPHOENIX NetEye cbs<br />
Corpor<strong>at</strong>e Business Solution<br />
up to 5000 network/<br />
service checks<br />
up to 500 monitored hosts<br />
WÜRTHPHOENIX NetEye ebs<br />
Enterprise Business Solution<br />
over 5000 network/<br />
service checks<br />
over 500 monitored hosts<br />
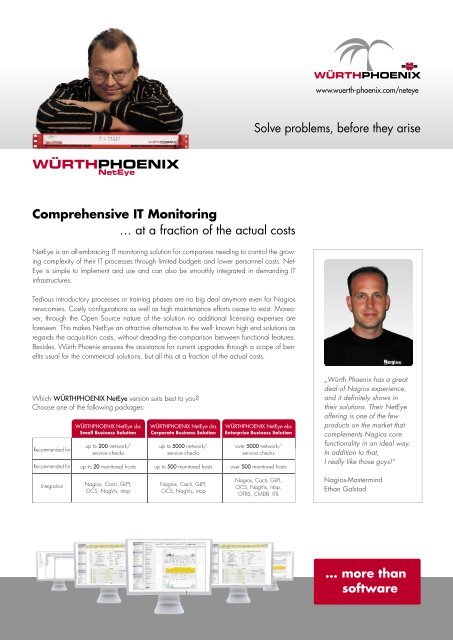
„Würth <strong>Phoenix</strong> has a gre<strong>at</strong><br />
deal <strong>of</strong> Nagios experience,<br />
and it definitely shows in<br />
<strong>the</strong>ir solutions. Their NetEye<br />
<strong>of</strong>fering is one <strong>of</strong> <strong>the</strong> few<br />
products on <strong>the</strong> market th<strong>at</strong><br />
complements Nagios core<br />
functionality in an ideal way.<br />
In addition to th<strong>at</strong>,<br />
I really like those guys!“<br />
Integr<strong>at</strong>ion<br />
Nagios, Cacti, GLPI,<br />
OCS, NagVis, ntop<br />
Nagios, Cacti, GLPI,<br />
OCS, NagVis, ntop<br />
Nagios, Cacti, GLPI,<br />
OCS, NagVis, ntop,<br />
OTRS, CMDB, <strong>IT</strong>IL<br />
Nagios-Mastermind<br />
Ethan Galstad
Open Source <strong>Monitoring</strong><br />
meeting big enterprise standards<br />
The fe<strong>at</strong>ures:<br />
INCIDENT MANAGEMENT<br />
<strong>Monitoring</strong> & HelpDesk<br />
Check hardware for server (HP, Dell, Fujitsu, HP-<br />
UX, Solaris, IBM, Super Micro)<br />
Disks monitoring (Raid Controller, SMART st<strong>at</strong>us)<br />
Control <strong>of</strong> Network devices (Power Supply, Fan,<br />
Discs, SMART St<strong>at</strong>us Discs, Temper<strong>at</strong>ure)<br />
Check Network Access Control <strong>of</strong> Mac Addresses<br />
on switch vs. inventory<br />
Network l<strong>at</strong>ency and band monitoring point to<br />
point<br />
Check systems services DNS, DHCP, SMTP,<br />
HTTP, Named, NTP, ...<br />
D<strong>at</strong>abase monitoring (Oracle, MS SQL,<br />
MySQL, Informix, DB2, PostreSQL)<br />
Check Terminal Services, Citrix XenAppListener<br />
Virtual server monitoring(VMware ESX, Xen,<br />
KVM, Hyper-V ...)<br />
Check Applic<strong>at</strong>ion Services (Micros<strong>of</strong>t Dynamics<br />
AX - NAV, SAP, AS/400, ...)<br />
Applic<strong>at</strong>ion servers monitoring (Tomc<strong>at</strong>, Websphere,<br />
Weblogic, Jboss...)<br />
Check Web 2.0 Applic<strong>at</strong>ion with execution <strong>of</strong><br />
an entire web transaction<br />
Check <strong>of</strong> SMS G<strong>at</strong>eway<br />
NetEye appliance monitoring<br />
Alerts on single network protocol traffics (SMTP,<br />
HTTP, File Share, Peer to Peer ...)<br />
Environment monitoring through temper<strong>at</strong>ure,<br />
smoke, w<strong>at</strong>er, humidity sensors<br />
UPS check<br />
Flexible configur<strong>at</strong>ion <strong>of</strong> thresholds <strong>of</strong> each<br />
single check<br />
Definition <strong>of</strong> active/passive checks (SNMP<br />
Traps)<br />
Visualiz<strong>at</strong>ion <strong>of</strong> all dependencies for <strong>the</strong> services<br />
and host checks<br />
St<strong>at</strong>us map visualiz<strong>at</strong>ion with <strong>the</strong> corresponding<br />
rel<strong>at</strong>ionships<br />
Visualiz<strong>at</strong>ion <strong>of</strong> Checks, breaks on maps (Visio,<br />
Picture, ...)<br />
Incident Life Cycle integr<strong>at</strong>ion<br />
Web based configur<strong>at</strong>ion <strong>of</strong> all checks with<br />
pr<strong>of</strong>iles and templ<strong>at</strong>es<br />
PROBLEM MANAGEMENT<br />
Knowledge Management & Notific<strong>at</strong>ions<br />
Visualiz<strong>at</strong>ion <strong>of</strong> all open problems<br />
Tracking <strong>of</strong> hardware incidents<br />
Knowledge management<br />
Integr<strong>at</strong>ion <strong>of</strong> messages from scheduled background<br />
jobs in a central st<strong>at</strong>us based message<br />
console<br />
Notific<strong>at</strong>ions by phone calls, E-Mail, SMS<br />
Host and services dependencies<br />
Flexible time periods definition with different<br />
notific<strong>at</strong>ion medium<br />
Contacts and grouping definition<br />
Escal<strong>at</strong>ion process definition<br />
OTRS integr<strong>at</strong>ion with <strong>IT</strong>IL standards<br />
CAPAC<strong>IT</strong>Y MANAGEMENT<br />
Resource & Network Performance<br />
Management<br />
Configurable graphical templ<strong>at</strong>es<br />
Measurement <strong>of</strong> network bandwidths point to<br />
point, l<strong>at</strong>ency and in-out band traffic<br />
Utiliz<strong>at</strong>ion graphs <strong>of</strong> in/out band traffic<br />
Graphs <strong>of</strong> network traffic on switches on single<br />
ports<br />
Measurement <strong>of</strong> optical fiber switch communic<strong>at</strong>ion<br />
on single port and frames<br />
Network Traffic Analyzer on single port with<br />
Netflow ® (Cisco Systems, Inc trademark) and<br />
SFlow interpret<strong>at</strong>ion<br />
Plug-in architecture in Cacti to easily add new<br />
functionalities<br />
Measurement <strong>of</strong> system load for hosts (Windows,<br />
Linux, HP-UX, Solaris, AS/400, AIX, ...)<br />
and devices (firewall, switches, routers)<br />
Visualiz<strong>at</strong>ion <strong>of</strong> <strong>the</strong> I/O load on <strong>the</strong> disks like<br />
SAN<br />
Integr<strong>at</strong>ion <strong>of</strong> performance indic<strong>at</strong>ors <strong>of</strong> Micros<strong>of</strong>t<br />
(Windows Server, Exchange, SharePoint,<br />
SQL Server...)<br />
Visualiz<strong>at</strong>ion and measurement <strong>of</strong> d<strong>at</strong>abase<br />
performance and usage (Oracle, DB2, SQL<br />
Server...)<br />
Performance st<strong>at</strong>istics for server Linux, HP-UX,<br />
Solaris<br />
Graphs on temper<strong>at</strong>ure and humidity checks<br />
Graphical visualiz<strong>at</strong>ion <strong>of</strong> network traffic on<br />
protocols (SMTP, HTTP, VOIP, File Share, Peer to<br />
Peer, SAP...)<br />
Export <strong>of</strong> all graphs in PNG<br />
SECUR<strong>IT</strong>Y MANAGEMENT<br />
Network Access Control bases on switch check<br />
MAC addresses and block <strong>of</strong> single ports on<br />
switch<br />
Flexible time based authoriz<strong>at</strong>ion for MAC addresses<br />
Virus activity detection on network with snort<br />
Snort, Network Intrusion Detection, integr<strong>at</strong>ion<br />
Vulnerability Checks for servers<br />
Access log auditing archiving<br />
HIGH AVAILABIL<strong>IT</strong>Y<br />
Clustering <strong>of</strong> NetEye Hardware Appliances<br />
Distributed monitoring with central management<br />
General d<strong>at</strong>a stored in MySQL d<strong>at</strong>abases<br />
Performance d<strong>at</strong>a stored in RRDTool files<br />
Fail-over plan<br />
Service continuity plan and backup integr<strong>at</strong>ion<br />
CONFIGURATION MANAGEMENT<br />
Web based configur<strong>at</strong>ion <strong>of</strong> all modules<br />
Flexible configur<strong>at</strong>ion <strong>of</strong> time periods checks<br />
Remove <strong>of</strong> monitoring <strong>of</strong> hosts or services from<br />
Nagios with deleting <strong>the</strong>m from <strong>the</strong> configur<strong>at</strong>ion<br />
Autom<strong>at</strong>ic SNMP traps management<br />
On-demand event handler definition<br />
Webmin Integr<strong>at</strong>ion<br />
SMS Configur<strong>at</strong>ion and Log Viewer<br />
Switch Configur<strong>at</strong>ion for Network Access Control<br />
<strong>Monitoring</strong><br />
Configur<strong>at</strong>ion <strong>of</strong> Web 2.0 transaction monitoring<br />
DASHBOARD<br />
Service Levels visualiz<strong>at</strong>ion in tachometers<br />
Aggreg<strong>at</strong>ed views <strong>of</strong> SL, Graphs<br />
Daily st<strong>at</strong>istics based on st<strong>at</strong>us dur<strong>at</strong>ions and<br />
alerts<br />
SLA St<strong>at</strong>istics by host and service groups<br />
Interactive timeline and dashboard configur<strong>at</strong>ion<br />
INVENTORY –– ASSET MANAGEMENT<br />
Inventory trough autom<strong>at</strong>ic discovery <strong>of</strong> all<br />
hardware and s<strong>of</strong>tware<br />
Asset Management<br />
Handling <strong>of</strong> resources<br />
<br />
<br />
Bolzano (I)<br />
Via Kravogl 4<br />
I-39100 Bolzano<br />
Phone: +39 0471 56 41 11<br />
Rome (I)<br />
Via Tiberina Km 17,600<br />
I-00060 Capena (Rome)<br />
Phone: +39 06 90 10 11<br />
Budaörs (HU)<br />
Gyár u. 2/d<br />
HU-2040 Budaörs<br />
Phone: +36 (0)23 50 13 50<br />
Bad Mergen<strong>the</strong>im (D)<br />
Drillberg 6<br />
D-97980 Bad Mergen<strong>the</strong>im<br />
Phone: +49 7931 91-6831<br />
info@wuerth-phoenix.com<br />
www.wuerth-phoenix.com