Community-Based Water Quality Monitoring - Alabama Water Watch
Community-Based Water Quality Monitoring - Alabama Water Watch
Community-Based Water Quality Monitoring - Alabama Water Watch

You also want an ePaper? Increase the reach of your titles
YUMPU automatically turns print PDFs into web optimized ePapers that Google loves.
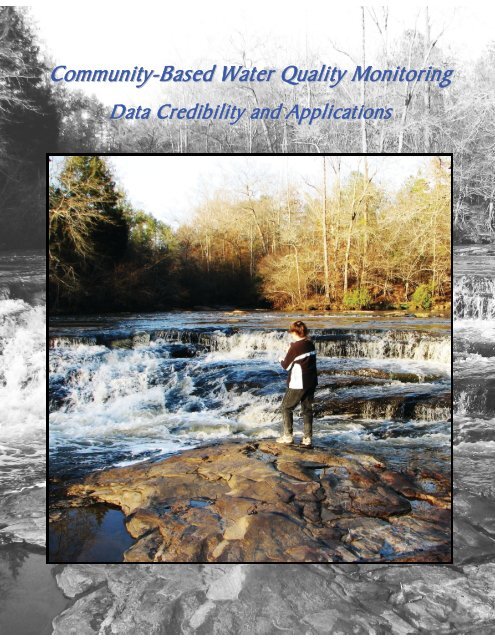
<strong>Community</strong>-<strong>Based</strong> <strong>Water</strong> <strong>Quality</strong> <strong>Monitoring</strong><br />
Data Credibility and Applications
Background of the <strong>Alabama</strong> <strong>Water</strong> <strong>Watch</strong> Program<br />
<strong>Alabama</strong> <strong>Water</strong> <strong>Watch</strong> (AWW) is a citizen volunteer, water quality monitoring program that began in<br />
1992. The Program is coordinated from the Auburn University Fisheries Department, with primary<br />
funding from the <strong>Alabama</strong> Department of Environmental Management (ADEM, the state’s<br />
environmental regulatory agency) and the U.S. Environmental Protection Agency (EPA), Region IV.<br />
The Program grew out of a strong grassroots movement of local groups that had formed for the<br />
protection of waterbodies throughout the state. Many citizens feel it is their right and responsibility to<br />
become actively involved in protecting and restoring <strong>Alabama</strong>’s water resources. These groups realize<br />
that advocacy for local waters requires strong community-based knowledge and action. Since its<br />
inception, AWW has developed strong relationships with water-based groups and worked with them to<br />
enhance their capabilities in watershed stewardship.<br />
The mission of AWW is to improve both<br />
water quality and policy through citizen<br />
monitoring and action. Citizen volunteers<br />
attend one or more AWW workshops to<br />
become certified monitors of water quality.<br />
In the workshops, participants learn simple<br />
techniques for measuring various chemical,<br />
physical and biological characteristics of<br />
water, such as water temperature, dissolved<br />
oxygen (DO), alkalinity, hardness,<br />
turbidity, pH and bacterial concentrations.<br />
AWW’s vision is to have a citizen monitor<br />
on every stream, river, lake, and bay in<br />
<strong>Alabama</strong>. This is a lofty goal since<br />
<strong>Alabama</strong> is such a water-rich state. There<br />
are over 75,000 miles of streams and rivers<br />
and 490,000 acres of lakes in the state. The<br />
state’s rivers and stream convey about 8%<br />
of the surface water that flows through the<br />
continental United States.<br />
<strong>Alabama</strong>, a water-rich state.<br />
<strong>Alabama</strong>’s surface waters cut through a wide variety of landscapes, including Appalachian valleys and<br />
ridges, prairie soils of the Black Belt, sandy soils of the Coastal Plain and other physiographic<br />
provinces. All this physical diversity in soil types, topography, geology and vegetative land cover<br />
leads to an impressive diversity of aquatic life. More than 700 species of fish, mussels, snails, and<br />
crawfish live in <strong>Alabama</strong>’s rivers and streams, which ranks it as the number one state in abundance of<br />
these aquatic species. Some of these organisms are endemic, meaning that they occur only in<br />
<strong>Alabama</strong>.<br />
2
Since AWW began, more than 240 citizen<br />
groups have participated, cumulatively<br />
sampling more than 1,900 sites on about 700<br />
waterbodies and submitting more than<br />
52,000 water quality data records to the<br />
AWW database. The Program has certified<br />
about 4,700 citizen monitors, who have<br />
monitored over 1,950 sites on 700<br />
waterbodies in <strong>Alabama</strong>, Georgia, Florida<br />
and Tennessee. Several groups have<br />
submitted water data for more than 10 years.<br />
For many waterbodies in <strong>Alabama</strong>, citizen<br />
data is the primary or only source of water<br />
quality information available. Citizen water<br />
quality data can be explored at the AWW<br />
website, www.alabamawaterwatch.org.<br />
AWW citizen volunteer monitor sites.<br />
GWW – Extending AWW <strong>Community</strong>-<strong>Based</strong> <strong>Water</strong> <strong>Monitoring</strong> around the Globe<br />
Global <strong>Water</strong> <strong>Watch</strong> (GWW) is a voluntary network of community based water monitoring groups.<br />
AWW staff have traveled to six other countries, the Philippines, Brazil, Mexico, Ecuador, China and<br />
Thailand, to train people in water monitoring techniques, water data management and applications, and<br />
action strategies in watershed management. The overall goal of GWW is to foster the development of<br />
citizen volunteers to monitor surface waters for the improvement of both water quality and public<br />
health. GWW helps communities establish teams of citizens who measure physical, chemical and<br />
biological indicators of watershed health. Monitors use their data to manage watersheds for the<br />
restoration of streams and lakes, improvement of drinking water and public health, and implementation<br />
of environmental education programs for the public.<br />
GWW participants learn how to monitor water chemistry (left) and total suspended solids (right) in the Philippines.<br />
The GWW Program began in Lantapan Province, Mindanao in 1994 as part of a 10-year USAID Sustainable<br />
Agriculture & Natural Resources Management (SANREM) project.<br />
3
GWW was initially modeled on the AWW Program and experiences. In recent years, learning about<br />
community-based monitoring has become a two-way street, with the development of international<br />
partnerships between citizen groups for the sharing of information. To learn more about GWW<br />
partners and to explore their data online, go to www.globalwaterwatch.org.<br />
Establishing Credible Citizen Data<br />
AWW developed quality assurance (QA) plans for water monitoring, and submitted them to EPA. EPA<br />
approved the AWW water chemistry monitoring QA plan in 1994 and a revision of it in 2004, and the<br />
bacteriological monitoring QA plan in1999. These plans outline the procedures and requirements of<br />
the AWW Program in training and certifying volunteer monitors, maintenance of accurate sampling<br />
equipment, and data management to ensure quality data.<br />
AWW quality assurance (QA) plans for water chemistry and bacteriological monitoring submitted to EPA, and<br />
approved in 1994 (original water chemistry QA plan), 1999 (bacteria QA plan), and 2004 (revised water chemistry QA<br />
plan). Plans are available digitally at www.alabamawaterwatch.org.<br />
As part of the QA plans, side-by-side testing of the AWW water chemistry and bacteriological tests<br />
were conducted over a wide range of concentrations to determine precision and accuracy compared to<br />
Standard Methods (APHA 1998) used by professional scientists in university, state and federal water<br />
quality laboratories. Correlations between the AWW test results and those of Standard Methods were<br />
comparable (graphs below), and this and other information led to EPA approval of AWW water<br />
chemistry and bacteriological monitoring protocols. AWW was one of the first citizen monitoring<br />
programs in the U.S. to receive EPA endorsement for bacteriological monitoring for the fecal<br />
bacterium Escherichia coli (E. coli) and other coliform bacteria.<br />
4
Results of hardness testing of samples ranging from 10-200 mg/L measured by Auburn University (AU)<br />
Standard Methods and the AWW test kit (Allison Busby and Eric Reutebuch conduct side-by-side tests,<br />
pictured above).<br />
Results of E. coli sampling over a wide range of concentrations (0-1,100 colonies/100 mL) measured by AU<br />
Standard Methods and the AWW Easygel Coliscan Method. Side-by-side testing was conducted on seven dates<br />
from 5/2/1999-9/1/1999. When read after about 30 hours of incubation according to the AWW bacteriological<br />
monitoring protocol, E. coli colonies appear blue-to-purple and other coliform bacteria appear pink-to-red on the<br />
Easygel Coliscan plates (Dr. Cliff Webber tallies bacteriological monitoring results, pictured above).<br />
An integral part of quality assurance are refresher courses to maintain proper sampling techniques and<br />
replenish monitor test kits with fresh chemical reagents. The Program offers refresher courses for<br />
water chemistry and bacteriological monitoring at two levels – citizen monitor refresher courses, and<br />
trainer refresher courses. Program staff recognized early-on that training citizen monitors throughout<br />
the state would be a daunting task, so materials were developed for the training of trainers. To date,<br />
more than 1,100 workshops have been conducted, and last year (excluding the Training-of-Trainer<br />
Workshops) 80% of training sessions were conducted by or with citizen trainers.<br />
5
Bill Deutsch, AWW Program Manager, recertifying citizen volunteer monitors of the Smith Lake Environmental<br />
Preservation Committee and Smith Lake Civic Association at Deb and Bob Berry’s home on Smith Lake (above left).<br />
AWW processes citizen water data through a sequence of multiple steps of quality assurance before publishing it in<br />
reports, posting it on the web, or reporting the data to ADEM (above right).<br />
The credibility of citizen data has been verified repeatedly at different levels, and at various locations<br />
throughout the state. Micro-level verification involves the training and certification/recertification of<br />
volunteer monitors in AWW testing procedures, and laboratory and field side-by-side testing. Macrolevel<br />
verification involves comparison of citizen and professional data at a watershed scale. Following<br />
are several examples of AWW citizen data verification at both the micro- and macro- levels.<br />
Over the past 15 years of AWW citizen monitoring, there have been several opportunities to compare<br />
citizen water quality data to that of professional agencies which follow Standard Methods monitoring<br />
protocols. Rarely are the data taken in exactly the same location at exactly the same time, or even on<br />
the same date. None-the-less, professional-versus-citizen data comparisons yield remarkably similar<br />
results, that are certainly within the criteria of resource managers for use in watershed management.<br />
A comparison of data from Auburn University (AU) researchers and Save Our Saugahatchee (SOS)<br />
citizen volunteer monitors was analyzed for data comparability and quality (graph below). SOS<br />
volunteer monitors had received training and certification from AWW in water chemistry monitoring.<br />
Measurements were taken monthly from February, 2005 through January 2007, a total of 24 monthly<br />
measurements at SOS site 07011007, Saugahatchee Creek at Lee County Road 188 Bridge, just north<br />
of Loachapoka, <strong>Alabama</strong>. The averages for alkalinity, hardness and pH measured by SOS volunteer<br />
monitors did not differ statistically from those of professional (AU) researchers, even though<br />
measurements were not made on the same date each month. Also, both volunteer and professional data<br />
showed significantly higher alkalinity compared to hardness. The reason for this anomaly was caused<br />
by the inflow of textile effluent into Saugahatchee Creek upstream of the sample site. High alkalinity<br />
measurements (in the absence of high hardness) have correlated with amounts of textile effluent, and<br />
have been consider by SOS as a surrogate measure of industrial waste load in the creek.<br />
6
Average alkalinity, hardness and pH measured by AU researchers (turquoise bars) and SOS volunteer monitors<br />
(yellow bars) at Lee County Road 188 Bridge near Loachapoka, <strong>Alabama</strong>. Measurements were taken monthly for 24<br />
months from 2/2005-1/2007. Vertical lines on bars represent range of values (minimum and maximum). SOS<br />
monitors Tom Ivers and Todd Miller (above) sample the creek at this site.<br />
A year-long study was initiated in January<br />
of 2006 to evaluate the accuracy and<br />
precision of the AWW dissolved oxygen<br />
(DO) test against the YSI dissolved oxygen<br />
meter in side-by-side testing. The study was<br />
conducted on two streams, Pepperell Branch<br />
and Rocky Brook, which flow through the<br />
city of Opelika in east-central <strong>Alabama</strong>.<br />
The DO measurement is a very important<br />
water quality parameter because<br />
concentrations below 5 parts per million<br />
(ppm) stress fish and may result in reduced<br />
aquatic biodiversity, since fish and most<br />
other aquatic creatures depend on oxygen<br />
from water. ADEM regulations require a<br />
DO level of at least 5 ppm (unless low DO<br />
occurs from natural causes) in waters that<br />
are classified as “Fish and Wildlife”. Results<br />
of the year-long study (graphs at right) show<br />
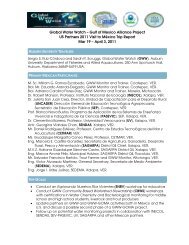
Average DO (top graph) and water temperature (bottom<br />
graph) measured with a YSI meter (turquoise bars) and the<br />
AWW test kit (yellow bars) at two streams, Pepperell Branch<br />
and Rockybrook, in Opelika, <strong>Alabama</strong>. Measurements were<br />
taken monthly for 12 months from 1/2006-1/2007. Vertical<br />
lines on bars represent range of values (minimum and<br />
maximum).<br />
7
that the AWW test kit yielded an accurate measure of DO as well as water temperature (there were no<br />
significant differences between the AWW results and those of the YSI meter). The average of DO<br />
measurements using the AWW test kit differed less than 0.2 ppm from those of the YSI meter at each<br />
site. AWW water temperature measurements differed less than 0.3 ˚C from those of the YSI meter.<br />
A three-year research project known as the Tallapoosa <strong>Water</strong>shed Project (TWP, funded by a USDA-<br />
CSREES grant) provided an excellent opportunity to conduct additional professional-versus-AWW<br />
side-by-side testing, since it engaged both AU researchers and AWW citizen volunteer monitors in<br />
lake water quality monitoring. An important objective of the TWP was to verify citizen volunteer<br />
monitor data and strengthen citizen monitor capabilities in measuring lake water quality and<br />
eutrophication (for more information, go to www.twp.auburn.edu).<br />
Lake eutrophication is expressed as trophic state index (TSI), which equates the range of oligotrophic<br />
(very clean, nutrient-poor lakes with low algae biomass) to eutrophic (polluted, nutrient-rich lakes<br />
with high algae biomass) to a range of numeric values from 0 to 100 (Carlson 1977). TSI values are<br />
used by state agencies such as ADEM to communicate the condition or ‘health’ of a lake to the public.<br />
The TSI of a lake can be determined by analyzing the chlorophyll or total phosphorus concentration of<br />
a water sample in the laboratory, both of which are fairly complex analyses. A third way to calculate<br />
TSI is from Secchi disk depth, which is a measurement that many volunteer monitors routinely record<br />
at lake monitoring sites. Secchi disk depth is simply the depth at which a Secchi disk, when lowered<br />
into a lake, disappears, and represents a measure of lake water clarity. One important caveat in using<br />
Secchi disk depth to determine lake TSI is that it only works when decreased water clarity is from<br />
suspended algae (indicative of green water) and not from suspended soil or clay particles (indicative of<br />
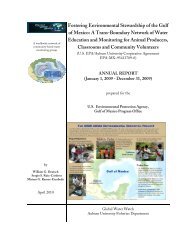
brown or red-brown, muddy water). The graph below compares growing season (April-October)<br />
averages of Secchi disk measurements taken by TWP researchers to those of Lake <strong>Watch</strong> of Lake<br />
Martin (LWLM) volunteer monitors at four sites on Lake Martin, near Alexander City, <strong>Alabama</strong>.<br />
Average Secchi disk depth measured by AU researchers (turquoise bars) and LWLM citizen volunteer monitors<br />
(yellow bars) at four sites on Lake Martin near Alexander City, <strong>Alabama</strong>. Measurements were taken monthly for<br />
seven months from 4/2004-10/2004. Vertical lines on bars represent range of values (minimum and maximum).<br />
LWLM monitor and President, Dick Bronson (above) uses an AquaScope to measure Secchi depth at his monitoring<br />
site on Lake Martin.<br />
Results indicate that there were no significant differences between Secchi measurements of LWLM<br />
citizen monitors and those of professional researchers (site averages of AU versus LWLM were within<br />
0.07 meters of each other across the four sites). At all four sites, both professional and citizen data<br />
8
indicated the same lake trophic state - mesotrophic (Secchi depth of between 2-4 meters) at two<br />
embayment and one mainstem site, and eutrophic (Secchi depth of less than 2 meters) at a third<br />
embayment site (Coley Creek Embayment, which receives municipal waste water treatment plant<br />
effluent). LWLM monitors employed the AquaScope II to cut surface glare while taking Secchi<br />
measurements, similar to the device used by AU researchers.<br />
During the second year of the TWP, sampling efforts moved up the Tallapoosa Basin to Lake<br />
Wedowee. Another growing season of data was collected during which AU researchers sampled sideby-side<br />
with citizen monitors of the Lake Wedowee Property Owners Association (LWPOA) at four<br />
sites on the lake. The Secchi dataset (graph below) did not show as close an agreement between citizen<br />
and professional measurements as the 2004 Lake Martin dataset. Significant differences between the<br />
AU and LWPOA Secchi measurements were attributed to technique – LWPOA monitors did not use a<br />
‘AquaScope’ viewing device while taking Secchi depth readings.<br />
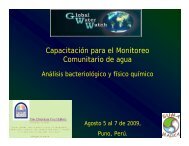
Average Secchi disk depth measured by AU researchers (turquoise bars) and LWPOA citizen volunteer monitors<br />
(yellow bars) at four sites on Lake Wedowee near Wedowee, <strong>Alabama</strong>. Measurements were taken monthly for seven<br />
months from 4/2005-10/2005. Vertical lines on bars represent range of values (minimum and maximum). LWPOA<br />
monitor and President, Charles Smith (above) measures Secchi depth at his monitoring site on Lake Wedowee.<br />
Differences between Secchi measurements of LWPOA monitors and those of AU researchers indicated<br />
that not only were there significant differences in Secchi measurements with-and-without the use of an<br />
‘AquaScope’ device, but that the differences became larger as water clarity increased. Quantification<br />
of these differences (graph below) provides a method for ‘correcting’ Secchi readings taken without a<br />
view scope so that they are comparable to Standard Methods Secchi readings via the equation:<br />
Standard Methods Secchi (with scope) = [(Citizen Secchi without scope) – 0.154] / 0.604<br />
Differences in Secchi disk depth measured by<br />
Auburn University (AU, red line) researchers<br />
and Lake Wedowee Property Owners<br />
Association citizen volunteer monitors<br />
(LWPOA, green line) at four sites on Lake<br />
Wedowee near Wedowee, <strong>Alabama</strong>. AU<br />
researchers used a ‘view-scope’ device similar<br />
to the AquaScope, and LWPOA citizen<br />
monitors did not. Measurements were taken<br />
monthly for seven months from 4/2005-<br />
10/2005. Vertical lines on bars represent range<br />
of values (minimum and maximum readings).<br />
9
Examination of stream data across different physiographic provinces can reveal variations in water<br />
quality based on natural causes such as soil type and mineral content. Comparison of professional data<br />
collected in the vicinity of Montgomery, <strong>Alabama</strong> by professionals of the Montgomery <strong>Water</strong> Works<br />
and Sanitary Sewer Board (MWWSSB) with data collected by citizen monitors of the Tri-River<br />
Region <strong>Water</strong> <strong>Watch</strong> (TRRWW) reveals such naturally-occurring differences (graph and map below).<br />
Although monitoring was not coordinated by date or exact sample site location, both datasets show a<br />
stepwise gradient in alkalinity from high (above 100 mg/L) for streams draining calcareous Blackland<br />
Prairie or Black Belt soils to low (less than 20 mg/L) for streams draining sandy Coastal Plain soils<br />
that typically lack calcium content. Knowledge of the range in water quality parameters of unpolluted,<br />
natural waters is required before watershed managers can determine if a stream or lake is being<br />
adversely impacted by point or nonpoint sources of pollution.<br />
Average alkalinity measured by Montgomery <strong>Water</strong> Works and Sanitary Sewer Board (MWWSSB) and Tri-<br />
River Region <strong>Water</strong> <strong>Watch</strong> (TRRWW) citizen volunteer monitors at four streams near Montgomery,<br />
<strong>Alabama</strong>. Data include 125 records measured by TRRWW monitors and 134 records measured by<br />
MWWSSB staff from 1999-2002. Values above bars represent averages, and vertical lines on bars<br />
represent range of values (minimum and maximum).<br />
10
Applications of Citizen <strong>Water</strong> <strong>Quality</strong> Data<br />
Citizen water data have been used for many informal and formal purposes in <strong>Alabama</strong> and in other<br />
countries. Informal uses have included 1) content for data interpretation presentations and waterbody<br />
publications by AWW staff, 2) mapping and sourcing of bacterial levels, 3) determining if the water<br />
quality of a waterbody is getting better or worse, 4) determining the relative health of a watershed, 5)<br />
monitoring drinking water supplies for bacterial contamination, and 6) environmental education in<br />
collaboration with schools. Formal uses have included 1) presentations at professional conferences, 2)<br />
influencing water policy, 3) upgrading of waterbody use classification, 4) development of watershed<br />
management plans, 5) inclusion in the ADEM <strong>Water</strong> <strong>Quality</strong> Report to Congress, and 6) using in the<br />
process of delisting of 303(d)-listed streams.<br />
AWW has available more than a dozen waterbody reports in which citizen groups work with AWW staff in presenting<br />
water facts and figures, changes in watershed land use, local environmental issues, the group’s water quality data<br />
trends from sites that they monitor, and their action strategies for protecting their local waterbodies.<br />
There have been many informal uses of citizen data over the past 15 years, the following are some<br />
examples.<br />
11
Annual State of the Lake Address<br />
In October 2006, a large group of Smith Lake residents - members of the Smith Lake Environmental<br />
Preservation Committee (SLEPC), gathered at Bethany Baptist Church in Cullman County for the 10 th<br />
Annual State of the Lake Address. AWW Program staff have presented interpretation of lake water<br />
quality data made evident through examination of monthly data records that Smith Lake citizen<br />
monitors have accumulated since monitoring began in 1996. SLEPC holds the annual event to educate<br />
lake residents about a variety of water quality issues, methods and tools to monitor lake water quality,<br />
and action strategies for protecting their lake.<br />
Bill Deutsch, AWW Program Manager, discussing<br />
water quality trends revealed by Logan Martin<br />
Lake Protection Association citizen data in Pell<br />
City, AL in February 2006.<br />
Eric Reutebuch, AWW Publications Coordinator,<br />
discussing AWW web-based tools to members of the<br />
Smith Lake Environmental Preservation Committee<br />
in Bremen, AL in November 2005.<br />
<strong>Water</strong>shed-level Bacteria <strong>Monitoring</strong><br />
Citizen monitors of the Lake Wedowee Property Owners Association (LWPOA) have been monitoring<br />
the waters of Lake Wedowee in Randolph County, <strong>Alabama</strong> since 1998. Spurred by a growing concern<br />
about bacterial contamination of the lake from septic systems, waste water treatment facilities,<br />
campgrounds, and nonpoint source runoff from poultry and cattle rearing operations, six LWPOA<br />
monitors received training and certification in bacteriological monitoring from AWW in March 2006.<br />
The group drafted a bacteriological sampling plan to test for levels of E. coli at 22 sites throughout the<br />
Lake Wedowee <strong>Water</strong>shed (see map below). At the completion of their Upper Tallapoosa <strong>Water</strong>shed<br />
Bacteria Study, LWPOA citizen monitors had taken about 100 samples, in triplicate according to the<br />
AWW protocol, throughout the growing season (April-October). Results indicated that 1) the highest<br />
E. coli levels (up to 8,250 colonies/100 mL of water) occurred in the Little Tallapoosa River just<br />
upstream of the <strong>Alabama</strong>-Georgia state line, 2) high levels of E. coli were also measured in Wedowee<br />
Creek (up to 2,786 colonies/100 mL of water) and in the Tallapoosa River (up to 506 colonies/100 mL<br />
of water), 3) the sources appeared to be from nonpoint source runoff because high levels of E. coli<br />
were detected following rainfall/runoff events, and 4) E. coli were not measured in the main body of<br />
Lake Wedowee, only in its tributary rivers and streams. Armed with this wealth of information,<br />
LWPOA citizen monitors plan to determine the sources of E. coli in tributaries entering the lake, and<br />
work on solutions to eliminate bacteria contamination in the watershed.<br />
12
Map showing sites in the Lake Wedowee <strong>Water</strong>shed that had harmful levels of E. coli (sites in red had > 600<br />
colonies/100 mL of water, sites in yellow had 200-600 colonies/100 mL, sites in green had < 200 colonies/100mL)<br />
during the 2006 growing season.<br />
Bacteriological monitoring has proven to be a valuable watershed management tool in other countries.<br />
GWW-Veracruz citizen monitors are using the AWW protocol and Easygel Coliscan plates to monitor<br />
for E. coli levels in rivers and streams in the state of Veracruz, Mexico.<br />
Bill Deutsch, AWW Program manager, and Sergio Ruiz-Córdova, AWW Database Specialist, discuss results of a<br />
watershed-level assessment of E. coli that they conducted with GWW-Veracruz monitors in 2006 (top left). After<br />
receiving training and certification as water quality trainers, GWW-Veracruz has conducted 24 trainings in water<br />
quality monitoring and trained more than 100 citizen monitors (March 2007 training pictured, top right).<br />
13
Certified monitors began measuring bacteria levels, water chemistry and discharge at seven sites on the<br />
Rio Pixquiac, south of the city of Xalapa in Veracruz in January 2006 (see map and graph below).<br />
They measured high levels of E. coli (6,467 colonies/100 mL of water) at the El Hayal site during the<br />
first month of sampling. They then conducted a stream walk upstream to search for the source of E.<br />
coli. They discovered a pig farm upstream where the animals had free access to the river. The GWW<br />
monitors were able to convince the farmer to reduce the pigs’ access to the river. By the end of the<br />
year, levels of E. coli had decreased dramatically, to safe levels, well below the 200 colonies/100 mL<br />
of water. The group has greatly expanded water monitoring in the state of Veracruz, and into other<br />
states in Mexico. Several GWW-Veracruz monitors have been certified as trainers by the AWW<br />
Program, and have conducted 24 workshops in water chemistry and bacteriological monitoring to train<br />
and certify other citizen monitors in the region.<br />
Fifteen month trend in E. coli levels<br />
measured by GWW citizen monitors<br />
in the Rio Pixquiac near Xalapa, in<br />
the state of Veracruz, Mexico (see<br />
graph above and map at right). The<br />
site is monitored by a local rainbow<br />
trout farmer, Raphael Hernandez,<br />
who diverts water from the river into<br />
raceways to rear his trout (pictured<br />
above, right). E. coli levels have<br />
dropped dramatically since<br />
monitoring began in January 2006,<br />
when E. coli levels were 6,467<br />
colonies/100 mL of water. Recent<br />
readings (67 colonies E. coli/100 mL<br />
of water) were well below the 200<br />
colonies/100 mL of water, which is<br />
considered the maximum level safe<br />
for frequent human contact. GWW-<br />
Veracruz have greatly expanded their<br />
water quality sampling efforts, and<br />
now sample at 31 sites in several<br />
watersheds throughout Veracruz.<br />
14
Determining if a <strong>Water</strong>body is Getting Better or Worse<br />
Most volunteer monitors sample their local stream, river, lake or bay to not only determine current<br />
water quality conditions, but to also determine if the water quality is getting better or worse over the<br />
long haul. For this reason, AWW stresses the importance of consistent monthly sampling over the long<br />
term. Many groups have been able to document positive and negative changes in water quality through<br />
consistent sampling over several years. Following are two examples of long-term monitoring of water<br />
quality by citizen volunteers.<br />
Citizen monitors began monitoring the waters of the Locust Fork River, in Blount County north of<br />
Birmingham, <strong>Alabama</strong> in May of 1993. The trend in turbidity (blue dashed line on graph below) shows<br />
that the river’s turbidity is on the rise. Many rivers and lakes throughout the South are experiencing<br />
increasing turbidity from soil erosion and/or nutrient enrichment, both of which can adversely affect<br />
fish and other aquatic life, as well as interfere with lake recreational uses and the quality of drinking<br />
water. This section of the Locust Fork River has been 303(d)-listed by ADEM as impaired because of<br />
siltation from unidentified sources. The most likely sources of the increasing turbidity are eroded soils<br />
washing off disturbed lands within the watershed upstream of this site.<br />
Increasing trend in turbidity (blue dashed line) of the Locust Fork River at Taylor Ford Shoals (site 10001001) near<br />
Hendrix, <strong>Alabama</strong> measured by Friends of Locust Fork River volunteer monitors Nancy Jackson and Susan Finley<br />
(pictured above).<br />
Since 1993, Coosa River Basin Initiative (CRBI) volunteer monitors have been monitoring the Upper<br />
Coosa River Basin on the Etowah and Oostanaula rivers in Georgia, and downstream of their<br />
confluence, the Coosa River, into <strong>Alabama</strong> and Weiss Lake. CRBI was one of the first AWW groups<br />
that extended beyond the boarders of <strong>Alabama</strong> into a neighboring state (in this case, Georgia). Below<br />
is a nine year record from Weiss Lake at Cedar Bluff, <strong>Alabama</strong>. Well-known for its fishing, Weiss, the<br />
‘Crappie Capitol of the World’ draws fishermen from across the country to its bountiful waters. The<br />
lake is formed by the Coosa River in northeast <strong>Alabama</strong>, and extends from the dam eastward to the<br />
<strong>Alabama</strong>-Georgia state line. Few waterbodies are more affected by the interstate ‘<strong>Water</strong> Wars’ than<br />
Weiss Lake. The graph below indicates that over the past several years water quality has deteriorated.<br />
Similar to the Locust Fork River, water turbidity is on the rise. The citizen data also indicate that DO<br />
levels have declined, dipping below the 5 ppm level mandated by ADEM as the minimum level<br />
required to maintain a healthy fish population (for waters classified as Fish and Wildlife) in 2006.<br />
15
Increasing trend in turbidity (blue dashed line) and decreasing trend in DO (red dashed line) of Weiss Lake (CRBI<br />
site 05004062) in Cedar Bluff, <strong>Alabama</strong> measured by Coosa River Basin Initiative volunteer monitor Ray Kelley<br />
(pictured above with E. coli plates). Ray was active in environmental issues well before his efforts as one of the<br />
founding fathers of CRBI (dating back to the 1950’s) and was the first recipient of AWW’s recently established ’Ray<br />
Kelly Lifetime Achievement Award’ for devotion and persistence in watershed stewardship.<br />
Alabamians may not realize that the ‘<strong>Water</strong> Wars’ are well underway. Metro-Atlanta already diverts an<br />
estimated 23 million gallons per day (mgd) of Coosa River Basin water from the Etowah River (up<br />
from 8 mgd in 1968), and plans estimate that this may rise to 100 mgd within the next 30 years. This<br />
water withdraw is known as an interbasin-transfer because the water does not return to the Coosa River<br />
Basin, it is discharged into the Chattahoochee River. The citizen data above indicate that even at<br />
current withdraw levels, the water quality of Weiss Lake is deteriorating – thus, increasing water<br />
withdraws will result in greater concentrations of pollutants and further degradation of water quality,<br />
which will threaten the ‘Crappie Capitol of the World.’ For more information on Coosa River Basin<br />
issues and CRBI citizen action, visit the CRBI website at www.coosa.org.<br />
Determining the Health of a <strong>Water</strong>shed – Stream Flow as an Indicator<br />
Citizen monitors in Lantapan Province, Mindanao, the Philippines were the first international monitors<br />
to receive water monitor training modeled after the <strong>Alabama</strong> <strong>Water</strong> <strong>Watch</strong> experience. They<br />
participated in the “<strong>Water</strong> Resource Management and Education” phase of a ten-year research<br />
program, the Sustainable Agriculture and Natural Resource Management, Collaborative Research<br />
Support Program (SANREM CRSP) funded by the U.S. Agency for International Development. The<br />
goal of this project was to develop community-based watershed monitoring groups that could collect<br />
valid water data and participate in local watershed stewardship. Stream flow monitoring was<br />
successfully conducted by trained volunteers in the rural Philippines and the resulting data provided<br />
important indicators of watershed health.<br />
Stream hydrographs indicated distinct watershed differences (see graph below). The largely deforested<br />
Kulasihan River <strong>Water</strong>shed had a much greater annual range of flow than the more pristine Maagnao<br />
River <strong>Water</strong>shed, in spite of relatively similar rainfall patterns. Of particular note was the response of<br />
the watersheds to the severe El Niño drought which began in the November 1997. The Kulasihan River<br />
was dramatically affected by the drought, and went completely dry from March through August 1998.<br />
This caused considerable hardship for local residents who depended on the river for washing, watering<br />
livestock and, in some cases, gathering household drinking water. Throughout this period, the<br />
Maagnao River maintained a relatively stable flow.<br />
16
Stream discharge and rainfall for the Maagnao and Kulasihan Rivers, tributaries of the Manupali River in<br />
Lantapan Province, Mindanao, the Philippines, February 1997- December 2001.<br />
GWW-Veracruz citizen monitors being trained by <strong>Alabama</strong> <strong>Water</strong> <strong>Watch</strong> to measure stream discharge<br />
following the protocol developed earlier in the Philippines.<br />
17
<strong>Monitoring</strong> Drinking <strong>Water</strong> Supplies for Bacterial Contamination<br />
The AWW bacteriological monitoring protocol is being used by Brazilians in the Jequitinhonha River<br />
Valley in the state of Minas Gerais to test their drinking water for bacteria. Christian Children’s Fund<br />
of Brazil and Auburn University’s International Center for Aquaculture and Aquatic Environments<br />
have been collaborating on a water harvesting project since 2001 to assist residents of the<br />
Jequitinhonha River Valley in the state of Minas Gerais in the construction of roof catchment rainfall<br />
systems to supply household water needs. The systems work well in capturing water, but some are<br />
plagued by bacterial contamination. Bacteriological workshops conducted by Auburn University staff,<br />
following AWW protocols, have enabled residents to regularly test their catchment systems for<br />
bacterial contaminants.<br />
Rooftop catchment system installed for household water supply (above, left) in rural Brazil. Using the AWW<br />
bacteriological testing protocol to test residential water supply (above, right).<br />
Environmental Education<br />
Several citizen monitor groups have teamed up with teachers at local schools to provide environmental<br />
education field trips to streams, where students learn about the aquatic environment. Over the past<br />
decade, citizen volunteer monitors from several groups in <strong>Alabama</strong> have exposed thousands of<br />
children to the intriguing world of stream macroinvertebrates (aquatic insects and worms, snails, and<br />
crayfish), and how to determine the health of a stream by examining these creatures. This collaboration<br />
between citizen volunteer monitors and schools was pioneered in the early 1990’s by LWLM citizen<br />
monitors, Dick and Mary Ann Bronson. They began teaching the <strong>Alabama</strong> <strong>Water</strong> <strong>Watch</strong> biological<br />
assessment protocol to 5 th graders from Montgomery, <strong>Alabama</strong> at Camp ASCCA in 1994. Mary Ann<br />
coined the term Living Streams because, when asked if they thought anything lived in the streams, the<br />
children’s response was “a few frogs, turtles and small fish.” They had no knowledge of the multitude<br />
of diverse aquatic fauna that inhabit <strong>Alabama</strong>’s streams. During the past 13 years, Lake <strong>Watch</strong> of<br />
Lake Martin volunteers have taught the Living Streams program to more than 3000 children in the<br />
Lake Martin area, from elementary through high school, community colleges, churches, scouts, and<br />
day camps. The program, now called Exploring <strong>Alabama</strong>’s Living Streams, is being adapted into a<br />
formal school curriculum for grades 4-12.<br />
Exploring <strong>Alabama</strong>’s Living Streams curriculum consists of five modules that include the water<br />
environment, ecology of streams, pollution and water quality standards, and stream biomonitoring<br />
methods. The curriculum is correlated to meet <strong>Alabama</strong> State Department of Education Course of<br />
Study Standards for 4 th and 5 th grade science, 6 th grade earth science, 7 th grade life science, and high<br />
18
school biology and environmental science classrooms. Exploring <strong>Alabama</strong>’s Living Streams has been<br />
piloted in seven schools over two years with favorable results.<br />
During a two-year pilot period (2005-2006), a team of teachers, AU Science Education interns and<br />
volunteers from local AWW monitoring groups implemented the week-long, six-module curriculum.<br />
Students investigated water quality issues in their community, and became familiar with citizen water<br />
monitoring groups and agencies involved in water monitoring, policy making and regulation. The<br />
curriculum included a field trip to a nearby stream where students conducted a biological assessment<br />
following the AWW biomonitoring protocol under the guidance of AWW monitors certified in stream<br />
bioassessment. Students participating in the pilot program also participated in the local <strong>Alabama</strong><br />
Cooperative Extension Service program Classroom in the Forest. Radney School 5th grade Science<br />
Stanford Achievement Test (SAT) 9 and SAT 10 scores increased from an average of 54% to 71%<br />
from 2001-2002 to 2005-2006 school years, over the four year period that the Exploring <strong>Alabama</strong>’s<br />
Living Streams curriculum and Classroom in the Forest were taught. Local educators are excited about<br />
this trend, and want to incorporate the curriculum into their yearly teaching schedules.<br />
Lake <strong>Watch</strong> of Lake Martin citizen<br />
monitor, Dick Bronson, teaching Radney<br />
School children from Alexander City, AL<br />
about stream biomonitoring.<br />
Children assessing stream<br />
quality using the AWW<br />
biomonitoring protocol.<br />
Save Our Saugahatchee citizen<br />
monitor, Gene Hunter, teaching<br />
Drake School children from<br />
Auburn, AL about water testing.<br />
Citizen water data are being used more frequently in formal applications, the following are several<br />
examples.<br />
Presentations at Professional Conferences<br />
AWW staff and volunteer monitors have used citizen data in presentations at professional conferences<br />
all across the United States and internationally, underscoring the growing importance and value of the<br />
citizen data and monitoring efforts. Topics of presentations have ranged from environmental education,<br />
to natural-and-unnatural variations in waterbody water quality, to credibility and applications of citizen<br />
data. Conferences at which citizen water data have been showcased include the USDA-CSREES<br />
National <strong>Water</strong> Conference, the USDA-CSREES Southern Regional <strong>Water</strong> <strong>Quality</strong> Conference, the<br />
Southeastern Conference of the North American Lake Management Society, the National <strong>Monitoring</strong><br />
Conference, the Association of American Geographers Conference, the <strong>Alabama</strong> Department of<br />
Environmental Management Annual Nonpoint Source Conference, the <strong>Alabama</strong> Science Teachers<br />
Association Conference, the <strong>Alabama</strong> <strong>Water</strong> Resources Conference, the AmericaView Conference,<br />
and the Annual State of Our <strong>Water</strong>shed Conference – the Tallapoosa River Basin.<br />
19
Citizen data and presenters were well-represented at the State of Our <strong>Water</strong>shed Conference – the<br />
Tallapoosa River Basin, held in April 2006 at Camp ASCCA, Jacksons Gap, <strong>Alabama</strong>. For more<br />
information, go to www.twp.auburn.edu.<br />
Influencing <strong>Water</strong> Policy<br />
A citizen monitor of the Retired Senior and Volunteer Program (RSVP) of Marshall County found<br />
extremely high levels of E. coli in Lake Guntersville near a public swimming area. The contamination<br />
was traced to shoreline flocks of Canada geese, and this data resulted in the passing of a city ordinance<br />
which restricted areas where geese could be fed. The change in policy was science-based as well as<br />
community-based and made the swimming beach much safer.<br />
Upgrading of a <strong>Water</strong>body – Wolf Bay, <strong>Alabama</strong><br />
Wolf Bay <strong>Water</strong>shed <strong>Watch</strong> (WBWW) began monitoring water chemistry in the Wolf Bay <strong>Water</strong>shed<br />
in 1996. Wolf Bay is located on the <strong>Alabama</strong> Gulf Coast east of Mobile Bay. The results of regular<br />
monthly citizen monitoring of bacteria and water chemistry over several years indicated that the<br />
aquatic flora and fauna of the ecologically-rich bay were threatened by rapid encroachment of<br />
development. Certain citizen monitor sites exhibited trends of increasing turbidity and bacteria levels,<br />
and low DO levels (see graph below). The increase in turbidity was probably from a combination of<br />
eroded soils washing off of the watershed into the bay and increased levels of nutrients (nitrogen and<br />
phosphorus) flowing into the bay, which stimulate the growth of algae that turn the water green.<br />
Increased turbidity can interfere with aquatic life by limiting light penetration into the water and can<br />
adversely affect the recreational and aesthetic value of the bay. <strong>Water</strong>shed management practices that<br />
minimize erosion and nutrient pollution needed to be implemented to reverse this trend.<br />
20
Increasing levels of turbidity (trend line in blue) monitored by WBWW monitors Nancy and Thomas Duke (pictured<br />
above) at their monitoring site on Wolf Bay. Picture - courtesy of Fanfare Photography<br />
Armed with a growing body of watershed-level water quality data, WBWW began pursuing<br />
“Outstanding <strong>Alabama</strong> <strong>Water</strong>” (OAW) classification for their bay in 2001. If successful, Wolf Bay<br />
would be the first bay in <strong>Alabama</strong> to be upgraded to OAW, and the bay would be protected by more<br />
stringent water quality standards and restrictions on development. WBWW provided ADEM with<br />
thousands of data records from more than 40 sites monitored throughout the watershed that<br />
documented water quality trends in the bay and its tributary streams. With the assistance of AWW,<br />
various data analyses were performed for data interpretation presentations, and for two volumes of a<br />
Wolf Bay waterbody report, which showcase citizen efforts in watershed stewardship.<br />
According to the chief of the <strong>Water</strong> <strong>Quality</strong> Branch of ADEM, “the Wolf Bay <strong>Water</strong>shed <strong>Watch</strong> water<br />
quality data was used to pinpoint where the Department needed to focus its monitoring efforts and to<br />
highlight areas with potential water quality concerns. In addition, since the WBWW data had<br />
highlighted bacteria as a potential parameter of concern, the Department was able to concentrate on<br />
collecting bacteriological data for evaluation against the OAW criteria. This allowed ADEM to clearly<br />
understand where the OAW classification should be applied.”<br />
In April 2007, after a decade of WBWW citizen efforts including extensive water quality monitoring,<br />
development of a watershed management plan, and lots of public outreach, Wolf Bay was granted<br />
OAW status by the <strong>Alabama</strong> Environmental Management Commission. The WBWW executive<br />
director credited the achievement to years of citizen water data that verified the bay was deserving of<br />
OAW designation.<br />
Development of <strong>Water</strong>shed Management Plans – SWaMP<br />
The Save Our Saugahatchee (SOS) citizen volunteer monitoring group was formed in 1997 because of<br />
concern over degradation of Saugahatchee Creek from both point and nonpoint sources of pollution in<br />
and around Auburn, <strong>Alabama</strong>. Beyond initiation of citizen water quality testing throughout the<br />
watershed, an early goal of SOS was to develop a comprehensive watershed management plan that<br />
would minimize impacts to the creek as the watershed underwent anticipated rapid development.<br />
Several SOS members were instrumental in the formation of the Saugahatchee <strong>Water</strong>shed<br />
Management Plan (SWaMP) stakeholder group in 2004. The SWaMP stakeholder group was<br />
composed of individuals from local government, business/industry, academia and community groups.<br />
Primary goals of SWaMP were to draft a watershed management plan for the Saugahatchee Creek<br />
<strong>Water</strong>shed, and to obtain grant funding to implement the plan. SOS monitors and their water data were<br />
21
important sources of information for fulfilling requirements of the plan regarding 1) identification of<br />
water pollution problems, 2) development of information/education components, and 3) development<br />
of stream water quality monitoring components of the plan. These were three of nine required elements<br />
that all watershed management plans must address to receive EPA/ADEM funding.<br />
Ten-year trends in DO and alkalinity of Saugahatchee Creek at North Donahue Bridge measured by David Newton<br />
(pictured above). The data indicate that alkalinity, associated with a textile mill point source discharge, became<br />
very high (often greater than 200 mg/L) during summer low-flow periods. These periods were also characterized<br />
by low DOs, which recently (summers of 2006 and 2007) dropped below the ADEM-mandated level of 5ppm for<br />
waters classified as Fish and Wildlife.<br />
The SWaMP stakeholder group completed the Saugahatchee <strong>Water</strong>shed Management Plan in 2005,<br />
following an 18-month process of more than 20 meetings, and submitted an application to ADEM for<br />
funding Phase 1 Implementation of SWaMP (the first 3 years of the 9-year plan). SWaMP was funded<br />
in early 2007, and SOS continues its strong involvement in environmental outreach and<br />
implementation of on-the-ground BMPs to reduce the flow of nonpoint source pollution into the creek.<br />
Additional information on SWaMP efforts can be found at www.swamp.auburn.edu.<br />
Many other AWW citizen<br />
monitoring groups have been<br />
actively involved in developing<br />
and implementing watershed<br />
management plans. Examples<br />
include the Wolf Bay<br />
<strong>Water</strong>shed <strong>Watch</strong> and the Wolf<br />
Bay Plan, the Logan Martin<br />
Lake Protection Association and<br />
the Mid-Coosa River Basin<br />
<strong>Water</strong>shed Management Plan,<br />
and the Friends of Locust Fork<br />
River and the Locust Fork<br />
<strong>Water</strong>shed Management Plan.<br />
22
Sustainability of Citizen <strong>Water</strong> <strong>Quality</strong> Data<br />
Data quality and usefulness is not a purely technical issue. In AWW’s one and a half decades of<br />
experience in directing citizen water monitoring, we have learned that quality assurance plans and<br />
good protocols are not enough to sustain quality volunteer monitoring over the long term. <strong>Quality</strong>,<br />
long-term data comes from satisfied, engaged volunteer monitors who feel that their data is used and is<br />
making a difference. AWW addresses monitor satisfaction through several avenues. The AWW<br />
website provides citizen monitors with timely feedback by displaying their sites on maps and their data<br />
in several graphic forms. The AWW Program office provides volunteer monitor support through<br />
coordinating and conducting several levels of training and certification, waterbody data interpretation<br />
presentations to groups, assistance in creating and publishing waterbody reports that showcase group<br />
efforts, replenishing monitor test kits with fresh chemicals, and day-to-day technical assistance via<br />
email, telephone and personal contact.<br />
Bill Deutsch, AWW Program Manager, and Sergio Ruiz-<br />
Córdova, AWW Database Specialist, conduct training<br />
in water chemistry testing in Huntsville, AL in<br />
November 2006.<br />
AWW Volunteer Coordinator, Tia Gonzales,<br />
distributes new chemicals to water chemistry<br />
monitors at Lake Wedowee, AL.<br />
References<br />
APHA (American Public Health Association), American <strong>Water</strong> Works Association and <strong>Water</strong><br />
Pollution Control Federation. 1998. Standard methods for the examination of water and<br />
wastewater. 20th edition. APHA, Washington, D. C.<br />
Carlson, R.E. 1977. A trophic state index for lakes. Limnology and Oceanography vol.22 (2), pages<br />
361-369.<br />
23
For more information…<br />
Concerned citizens, young and<br />
old, now have a powerful, new<br />
tool to answer the fundamental<br />
questions of water testing: Is my<br />
water body getting better or<br />
worse, and why Hundreds of<br />
summary graphs and maps of<br />
water data, training opportunities,<br />
special meetings and other<br />
aspects of water monitoring are<br />
available at the AWW and GWW<br />
websites. Certified monitors can<br />
enter their data online, and<br />
custom graphs and statistical<br />
trends of water quality data can<br />
easily be generated.<br />
Let’s keep the wonder alive!<br />
Timely dissemination of<br />
quality-assured water quality<br />
data in meaningful ways is a<br />
vital element of a successful<br />
volunteer monitoring program.<br />
It is important to apply water<br />
quality information collected<br />
by citizen volunteers to local<br />
activities such as<br />
environmental education,<br />
waterbody protection and<br />
restoration, and development<br />
of watershed management<br />
plans. You are welcome to<br />
become a part of AWW/GWW<br />
and a water monitoring group.<br />
<strong>Alabama</strong> <strong>Water</strong> <strong>Watch</strong> is a citizen volunteer water quality monitoring program that<br />
provides training, data management, information exchange and other means of<br />
support for the public to become personally involved in water issues. Global <strong>Water</strong><br />
<strong>Watch</strong> is a network of community-based water monitoring groups worldwide,<br />
coordinated from Auburn University.<br />
<strong>Alabama</strong> <strong>Water</strong> <strong>Watch</strong>/Global <strong>Water</strong> <strong>Watch</strong><br />
Department of Fisheries and Allied Aquacultures, 250 Upchurch Hall<br />
Auburn University, AL 36849-5415<br />
Telephone: (888) 844-4785, Fax: (334) 844-3666<br />
E-mail: awwprog@auburn.edu<br />
Website: www.alabamawaterwatch.org , www.globalwaterwatch.org<br />
Dr. Bill Deutsch, Program Director; Eric Reutebuch, Publications Coordinator; Sergio<br />
Ruiz-Córdova, Data Coordinator; Jayme Oates, Volunteer Monitor Coordinator; Wendy<br />
Seesock, <strong>Water</strong> <strong>Quality</strong> Laboratory Manager; and Rita Grub, Office Manager.<br />
Citation:<br />
Reutebuch, E., W. Deutsch and S. Ruiz-Córdova. 2008. <strong>Community</strong>-<strong>Based</strong> <strong>Water</strong><br />
<strong>Quality</strong> <strong>Monitoring</strong> – Data Credibility and Applications. <strong>Alabama</strong> <strong>Water</strong> <strong>Watch</strong>,<br />
Auburn University <strong>Alabama</strong>. 24 pp.<br />
Funding for this publication was provided by the World Wildlife Fund. Unlabeled<br />
photos and graphics are from <strong>Alabama</strong> <strong>Water</strong> <strong>Watch</strong>. This and other AWW<br />
publications are available digitally at the AWW website.<br />
24