LAB 725 - Using Parameter Trend Plots - Teledyne LeCroy
LAB 725 - Using Parameter Trend Plots - Teledyne LeCroy
LAB 725 - Using Parameter Trend Plots - Teledyne LeCroy

Create successful ePaper yourself
Turn your PDF publications into a flip-book with our unique Google optimized e-Paper software.
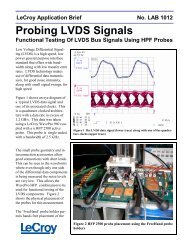
<strong>LeCroy</strong> Applications Brief No. L.A.B. <strong>725</strong><br />
<strong>Using</strong> <strong>Parameter</strong> <strong>Trend</strong> <strong>Plots</strong><br />
Power Supply Regulation Measurements <strong>Using</strong> <strong>Trend</strong> <strong>Plots</strong><br />
<strong>Trend</strong> plots, which are available<br />
in <strong>LeCroy</strong> oscilloscopes, graphically<br />
display up to 20,000 individual<br />
parameter measurements<br />
on each trace. Any, of over 100<br />
available parameters, can be used<br />
as a source of the trend plot.<br />
When two trends are crossplotted<br />
on an X-Y display the<br />
functional relationships between<br />
the two parameters can easily be<br />
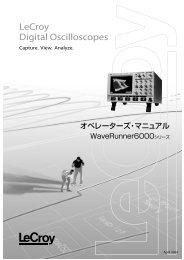
examined. As an example consider<br />
figure 1 which shows the<br />
pulse width of a switching power<br />
supply regulator as a function of<br />
the rms line voltage input. This<br />
plot includes data for three different<br />
values of output load current.<br />
Each of these trends (Trms<br />
[A] or Twidth[D ]) contains 200<br />
measured values. <strong>Trend</strong> plots<br />
are setup by defining one of the<br />
zoom/math traces using the<br />
ZOOM+MATH menu as shown<br />
in figure 1<br />
It is easy to see from figure 1<br />
that the regulator pulse width<br />
(vertical axis) and input voltage<br />
(horizontal axis) are related to<br />
each other and that increasing<br />
line voltage results in decreasing<br />
pulse width. As the output load<br />
current was increased the plotted<br />
data moved upward indicating<br />
that the pulse width increases<br />
with increasing load.<br />
This type of analysis also depends<br />
on several other features<br />
Figure 1 A cross-plot of power supply regulator pulse width as<br />
a function of rms line voltage with output load current as a parameter.<br />
Infinite display persistence retains all 3 cross-plots.<br />
in the oscilloscope. First, the<br />
two parameters are measured<br />
over vastly different timing intervals.<br />
We use <strong>LeCroy</strong>’s Smart<br />
Trigger to keep the measurements<br />
synchronous. A qualified<br />
trigger is used so that the oscilloscope<br />
is triggered on the first<br />
regulator output pulse after a<br />
line voltage zero crossing. This<br />
guarantees that the pulse width<br />
and rms voltage measurements<br />
are correlated in time.<br />
Similarly, because of the difference<br />
in timing intervals this<br />
measurement requires the use of<br />
very long memories. Note that<br />
we are sampling the data at 20<br />
Mega Samples/s for a total time<br />
of 50 ms. This means that the<br />
oscilloscope is acquiring over 1,<br />
000,000 samples (50 ms * 20<br />
MS/s = 1 MS). If this memory<br />
were not available then the sampling<br />
rate would have to be decreased<br />
and timing resolution<br />
would suffer.
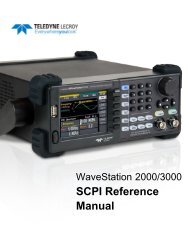
The basic setup for this measurement<br />
is shown in figure 2.<br />
The input voltage to the supply<br />
is measured differentially. We<br />
subtract the neutral side (channel<br />
3) of the line from high side<br />
(channel 4). We also use a<br />
zoom display to look at a single<br />
regulator output pulse . The<br />
trend data is accumulated on the<br />
rms value of the line voltage and<br />
the width of the regulator pulse<br />
width.<br />
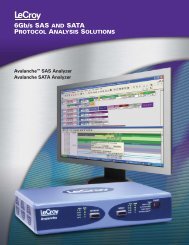
Figure 3 shows another example<br />
of a cross-plot of trend data.<br />
Here, the pulse width of the<br />
regulator is plotted as a function<br />
of the output load current.<br />
This cross-plot shows evidence<br />
of the non-linear characteristics<br />
of the power supply transformer.<br />
<strong>LeCroy</strong> Applications Brief No. L.A.B. <strong>725</strong><br />
Figure 2 The trigger setup for the measurement<br />
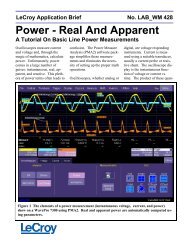
<strong>Trend</strong> plots eliminate the need to<br />
make and record a large number<br />
of individual measurements. The<br />
oscilloscope makes the measurements<br />
automatically and plots<br />
the values in the order the values<br />
are taken. Multiple trends, acquired<br />
simultaneously, can be<br />
cross-plotted as shown in the<br />
examples. Once set up, the<br />
trend plots are generated automatically<br />
as the data is acquired.<br />
<strong>Trend</strong>ing is just one of the tools<br />
available in <strong>LeCroy</strong> oscilloscopes<br />
optional waveform processing<br />
packages. <strong>Parameter</strong>s can also<br />
be analyzed statistically using the<br />
histogram function. These<br />
analysis tools are supported by<br />
18 additional statistical parameters<br />
for a complete statistical<br />
analysis solution.<br />
Figure 3 Cross-plot of trends of regulator pulse width (Y axis)<br />
and mean output load current (X-axis) showing the relationship<br />
between these two measured parameters