Delayed Transfers of Care (DTOC) PDF 374 KB - Gloucestershire ...
Delayed Transfers of Care (DTOC) PDF 374 KB - Gloucestershire ...
Delayed Transfers of Care (DTOC) PDF 374 KB - Gloucestershire ...

Create successful ePaper yourself
Turn your PDF publications into a flip-book with our unique Google optimized e-Paper software.
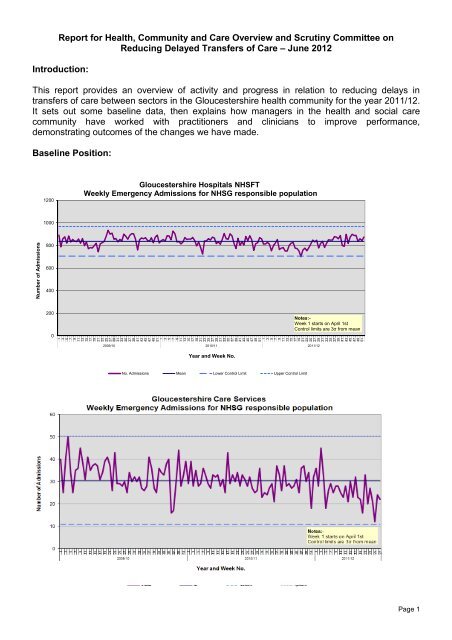
Report for Health, Community and <strong>Care</strong> Overview and Scrutiny Committee on<br />
Reducing <strong>Delayed</strong> <strong>Transfers</strong> <strong>of</strong> <strong>Care</strong> – June 2012<br />
Introduction:<br />
This report provides an overview <strong>of</strong> activity and progress in relation to reducing delays in<br />
transfers <strong>of</strong> care between sectors in the <strong>Gloucestershire</strong> health community for the year 2011/12.<br />
It sets out some baseline data, then explains how managers in the health and social care<br />
community have worked with practitioners and clinicians to improve performance,<br />
demonstrating outcomes <strong>of</strong> the changes we have made.<br />
Baseline Position:<br />
1200<br />
<strong>Gloucestershire</strong> Hospitals NHSFT<br />
Weekly Emergency Admissions for NHSG responsible population<br />
1000<br />
Number <strong>of</strong> Admissions<br />
800<br />
600<br />
400<br />
200<br />
0<br />
9<br />
11<br />
13<br />
15<br />
17<br />
19<br />
21<br />
23<br />
25<br />
27<br />
29<br />
31<br />
33<br />
35<br />
37<br />
39<br />
41<br />
43<br />
45<br />
47<br />
49<br />
51<br />
1<br />
3<br />
5<br />
7<br />
9<br />
11<br />
13<br />
15<br />
17<br />
19<br />
21<br />
23<br />
25<br />
27<br />
29<br />
31<br />
33<br />
35<br />
37<br />
39<br />
41<br />
43<br />
45<br />
47<br />
49<br />
51<br />
1<br />
3<br />
5<br />
7<br />
2009/10 2010/11 2011/12<br />
Year and Week No.<br />
9<br />
11<br />
13<br />
15<br />
17<br />
19<br />
21<br />
23<br />
25<br />
27<br />
29<br />
31<br />
33<br />
35<br />
37<br />
39<br />
41<br />
43<br />
45<br />
47<br />
49<br />
51<br />
1<br />
3<br />
5<br />
7<br />
Notes:-<br />
Week 1 starts on April 1st<br />
Control limits are 3σ from mean<br />
No. Admissions Mean Lower Control Limit Upper Control Limit<br />
Page 1
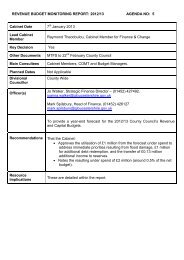
The first graph plots the number <strong>of</strong> emergency admissions per week to the acute hospitals from<br />
the beginning <strong>of</strong> April 2009 until March 2012. The second graph shows emergency admissions<br />
to the community hospitals during the same period <strong>of</strong> time which were reduced by -2.5%.<br />
Overall, emergency admissions to both acute and community hospitals have been reducing, as<br />
people are better cared for in their own homes and clinical pathways have been redesigned.<br />
However we would prefer to see more people admitted directly to community hospitals.<br />
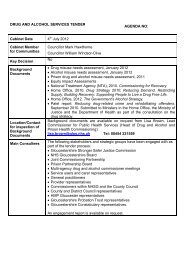
The chart below shows the volume <strong>of</strong> transfers into community hospitals from acute hospitals.<br />
The total volume <strong>of</strong> transfers has reduced by 5% (-162) in the period 2010/11 compared to<br />
2011/12.<br />
100<br />
<strong>Gloucestershire</strong> <strong>Care</strong> Services<br />
Weekly transfers for NHSG responsible population<br />
90<br />
80<br />
Number <strong>of</strong> Admissions<br />
70<br />
60<br />
50<br />
40<br />
30<br />
20<br />
10<br />
0<br />
9<br />
11<br />
13<br />
15<br />
17<br />
19<br />
21<br />
23<br />
25<br />
27<br />
29<br />
31<br />
33<br />
35<br />
37<br />
39<br />
41<br />
43<br />
45<br />
47<br />
49<br />
51<br />
1<br />
3<br />
5<br />
7<br />
9<br />
11<br />
13<br />
15<br />
17<br />
19<br />
21<br />
23<br />
25<br />
27<br />
29<br />
31<br />
33<br />
35<br />
37<br />
39<br />
41<br />
43<br />
45<br />
47<br />
49<br />
51<br />
1<br />
3<br />
5<br />
7<br />
9<br />
11<br />
13<br />
15<br />
17<br />
19<br />
21<br />
23<br />
25<br />
27<br />
29<br />
31<br />
33<br />
35<br />
37<br />
39<br />
41<br />
43<br />
45<br />
47<br />
49<br />
51<br />
1<br />
3<br />
5<br />
7<br />
Notes:-<br />
Week 1 starts on April 1st<br />
Control limits are 3σ from mean<br />
2009/10 2010/11 2011/12<br />
Year and Week No.<br />
No. <strong>Transfers</strong> Mean Lower Control Limit Upper Control Limit<br />
This may reflect both the reduced number <strong>of</strong> admissions and the fact that more people are<br />
going straight home, rather than transferring to another hospital facility. The general picture is<br />
<strong>of</strong> relatively flat figures, however there was an improved position in relation to the Christmas<br />
period in 2011/12.<br />
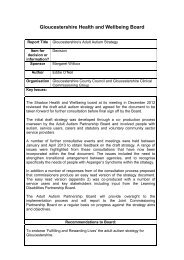
The graph below shows the average length <strong>of</strong> stay for people in our acute hospitals, between<br />
April 2009 and March 2012. Since April 2011, the average length <strong>of</strong> stay is 5.6 days compared<br />
to an average <strong>of</strong> 5.3 days in the previous year (April 2010 – March 2011).<br />
Page 2
8.0<br />
<strong>Gloucestershire</strong> Hospitals NHSFT<br />
Weekly Emergency Average LoS for NHSG responsible population<br />
7.0<br />
6.0<br />
Number <strong>of</strong> Admissions<br />
5.0<br />
4.0<br />
3.0<br />
2.0<br />
1.0<br />
0.0<br />
7<br />
10<br />
13<br />
16<br />
19<br />
22<br />
25<br />
28<br />
31<br />
34<br />
37<br />
40<br />
43<br />
46<br />
49<br />
52<br />
1<br />
4<br />
9<br />
12<br />
15<br />
18<br />
21<br />
24<br />
27<br />
30<br />
33<br />
36<br />
39<br />
42<br />
45<br />
48<br />
51<br />
3<br />
6<br />
8<br />
11<br />
14<br />
17<br />
20<br />
23<br />
26<br />
29<br />
32<br />
35<br />
38<br />
41<br />
44<br />
47<br />
50<br />
2<br />
5<br />
7<br />
10<br />
13<br />
16<br />
19<br />
22<br />
25<br />
28<br />
31<br />
34<br />
37<br />
40<br />
43<br />
46<br />
49<br />
52<br />
08/09 09/10 10/11 11/12<br />
Year and Week No.<br />
Notes:-<br />
Week 1 starts on April 1st<br />
Control limits are 3σ from mean<br />
1<br />
4<br />
Av LoS Mean Lower Control Limit Upper Control Limit<br />
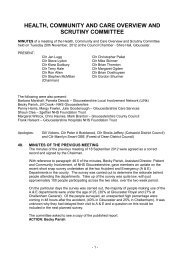
Within community hospitals, a similar trend is evident. The average length <strong>of</strong> stay between April<br />
and March this year is 18.4 days against a target <strong>of</strong> 14 days. The average last year was 19.6<br />
days.<br />
35<br />
<strong>Gloucestershire</strong> <strong>Care</strong> Services<br />
Weekly <strong>Transfers</strong> Average LOS for NHSG responsible population<br />
30<br />
Length <strong>of</strong> stay<br />
25<br />
20<br />
15<br />
10<br />
5<br />
0<br />
9<br />
11<br />
13<br />
15<br />
17<br />
19<br />
21<br />
23<br />
25<br />
27<br />
29<br />
31<br />
33<br />
35<br />
37<br />
39<br />
41<br />
43<br />
45<br />
47<br />
49<br />
51<br />
1<br />
3<br />
5<br />
7<br />
9<br />
11<br />
13<br />
15<br />
17<br />
19<br />
21<br />
23<br />
25<br />
27<br />
29<br />
31<br />
33<br />
35<br />
37<br />
39<br />
41<br />
43<br />
45<br />
47<br />
49<br />
51<br />
1<br />
3<br />
5<br />
7<br />
2009/10 2010/11 2011/12<br />
Year and Week No.<br />
9<br />
11<br />
13<br />
15<br />
17<br />
19<br />
21<br />
23<br />
25<br />
27<br />
29<br />
31<br />
33<br />
35<br />
37<br />
39<br />
41<br />
43<br />
45<br />
47<br />
49<br />
51<br />
1<br />
3<br />
5<br />
7<br />
Notes:-<br />
Week 1 starts on April 1st<br />
Control limits are 3σ from mean<br />
los Mean Lower Control Limit Upper Control Limit<br />
These rises may have been a result <strong>of</strong> rising delays in transfer <strong>of</strong> care. Senior managers in the<br />
health and social care community have been reviewing and revising processes to improve<br />
performance, but to do so, we had to get a better understanding <strong>of</strong> the total picture.<br />
Page 3
<strong>Delayed</strong> <strong>Transfers</strong> <strong>of</strong> <strong>Care</strong>:<br />
When we reviewed the delayed transfer <strong>of</strong> care information, we concluded that there were<br />
significant data quality issues in quarter one <strong>of</strong> 2011/12. These have now been resolved,<br />
although they remain reported. If we disregard the first quarter, the levels <strong>of</strong> delayed transfers<br />
are in line with the targets within expected norms. Practically all <strong>of</strong> the delays were because the<br />
patient was either awaiting their choice <strong>of</strong> further NHS care (75%) or preferred residential or<br />
nursing placement (14%).<br />
Data Source: Weekly <strong>DTOC</strong> figures<br />
Page 4
The volume <strong>of</strong> delayed transfers <strong>of</strong> care within community hospitals is also in line with expected<br />
norms. The major causes for the delays are awaiting domiciliary package (31%), awaiting a<br />
residential or nursing placement (29%) and patient/family choice (22%).<br />
‘No delays’ Project:<br />
Over the summer <strong>of</strong> 2011, in response to the information about how long people stay in<br />
hospital, and what services they were waiting for, we instigated a project with the ambitious title<br />
<strong>of</strong> ‘no delays’. This set out to capture detailed information about the reasons for delays in<br />
discharge, both prior to the patient being medically fit for discharge, and once medically fit for<br />
discharge.<br />
This work led to a streamlining <strong>of</strong> processes and a strengthening <strong>of</strong> the multi-disciplinary<br />
approach to discharge planning, and accounts for the reduced LoS in Community Hospitals at<br />
that time.<br />
As part <strong>of</strong> the ongoing development <strong>of</strong> integrated services in the county, the Living Well model<br />
<strong>of</strong> assessment and support has been adopted, which places a focus on supporting a person<br />
focussed approach, with timely and proportionate responses across the whole care system. The<br />
model promotes independence and the importance <strong>of</strong> planning well, this will further contribute to<br />
a reduction in inappropriate admissions.<br />
Joint Agency Discharge Process:<br />
Whilst the ‘no delays’ project had a positive impact on the people in community hospitals, we<br />
also wanted to ensure that patients who require support with being discharged home from acute<br />
hospital care are supported effectively.<br />
When someone is identified as no longer needing acute medical care, they are denoted as<br />
‘medically fit’ and placed on a list to signal action is required to identify an alternative care<br />
setting or focus on supporting discharge.<br />
A range <strong>of</strong> options is then available:<br />
• Any vulnerable older patient with low level care and/or enablement needs can be referred<br />
to the Hospital to Home Scheme commissioned from Age UK. The discharge coordinators<br />
based in CHT and GHT are currently dealing with 100 patients per month with<br />
capacity to increase this figure and promote the service to a greater proportion <strong>of</strong><br />
patients.<br />
• Any patient requiring a significant amount <strong>of</strong> discharge planning who also has further<br />
rehabilitation potential is transferred to a community hospital or interim placement.<br />
• Any patient who would benefit from bed based intermediate care is referred on.<br />
• Where it is possible for a patient to go home, the relevant support is <strong>of</strong>fered and if this is<br />
not immediately available an alternative is <strong>of</strong>fered, such as an interim residential<br />
placement may be appropriate until specialist domiciliary care is available.<br />
• When there are safeguarding or mental capacity concerns, patients may be denoted on<br />
the medically fit list as “medically fit” but it is usually preferable for them to remain in<br />
hospital until appropriate safeguarding or best interest arrangements are made.<br />
Close inter – agency working takes place to support the movement <strong>of</strong> patients through the acute<br />
hospital system. This includes a joint escalation process, daily conference calls, weekly<br />
discharge planning and meetings and an agreed reimbursable delay sign <strong>of</strong>f process. Earlier<br />
Page 5
and more timely referrals are now being made, and GCC has increased Social Work capacity<br />
which is aligned to the hospital teams to support this.<br />
Reimbursable delays are those attributable to social care and they attract a daily fine, paid by<br />
the council to the NHS, <strong>of</strong> £100 per day, per patient. There have been no reimbursable bed<br />
days in <strong>Gloucestershire</strong> since August 2010. However the reports sent to the Department <strong>of</strong><br />
Health and circulated locally indicate a small number <strong>of</strong> acute delays attributable to ASC.<br />
These are an anomaly <strong>of</strong> the reporting system, referred to earlier in this report as a data quality<br />
issue, and it is expected that the current sign <strong>of</strong>f process will prevent this from occurring<br />
prospectively.<br />
The reimbursable delay process does not apply to people being discharged from community<br />
hospital beds. However, all community hospitals use the same system <strong>of</strong> denoting patients as<br />
‘medically fit’ and report delays in the same way to NHS <strong>Gloucestershire</strong>. <strong>Gloucestershire</strong> <strong>Care</strong><br />
Services have consistently met their target and are currently performing better than target. A<br />
robust internal sign <strong>of</strong>f process takes place to ensure correct reporting <strong>of</strong> any delays.<br />
The following graph shows how <strong>Gloucestershire</strong> performs compared to other councils in<br />
delayed transfers <strong>of</strong> care.<br />
35<br />
NI 131 (May 2011 - April 2012) Rolling Year -<br />
<strong>Gloucestershire</strong> nearest neighbour comparator group<br />
30<br />
25<br />
20<br />
15<br />
10<br />
5<br />
0<br />
Essex<br />
Leicestershire<br />
Hampshire<br />
Kent<br />
Worcestershire<br />
North Yorkshire<br />
Somerset<br />
Staffordshire<br />
<strong>Gloucestershire</strong><br />
Northamptonshire<br />
Cumbria<br />
Cambridgeshire<br />
West Sussex<br />
Devon<br />
Warwickshire<br />
Oxfordshire<br />
The following graph shows how GNHFT performs compared to other acute hospital trusts in the<br />
South West.<br />
Page 6
Changes were made during in October 2011 to improve these processes within acute care<br />
settings. Discharges home or to community hospitals continue. Any patients who potentially<br />
needs longer term support prior to returning home and who would not benefit from inpatient<br />
rehabilitation has been <strong>of</strong>fered an interim placement in a care home setting for their ongoing<br />
assessments and reablement to take place. 100 interim care beds have been used for this<br />
purpose during 2011-12. Activity and outcomes relating to this change are now being evaluated.<br />
The needs <strong>of</strong> people with dementia who may also have other co-morbidities has been<br />
highlighted, with work identified to increase the availability <strong>of</strong> a responsive ‘wrap around’<br />
domiciliary care provision that can be flexible to an individuals needs in order to ensure as many<br />
people as possible have the opportunity to return to their own home as quickly as possible<br />
rather than being transferred to another less appropriate care environment. This requires a well<br />
trained workforce and 60% <strong>of</strong> accredited domiciliary care agencies now have Dementia Link<br />
Workers (DLW). Each community hospital now has at least one DLW, and the acute hospitals<br />
are undergoing a comprehensive training programme to ensure the needs <strong>of</strong> people with<br />
dementia are recognised, and services and environments adjusted appropriately wherever<br />
possible.<br />
Reablement services:<br />
Key to the support for effective and timely discharge is access to reablement services. GCS<br />
has, during 20011-12 been reshaping locality teams to provided an integrated reablement<br />
service.<br />
The number <strong>of</strong> new service users accessing reablement was planned to rise from the current<br />
performance <strong>of</strong> around 200 to over 300 a month by the end <strong>of</strong> 2011/12. We projected a March<br />
new service user figure <strong>of</strong> 310 but only achieved 228. The restructuring <strong>of</strong> GCS has had an<br />
impact on staff recruitment and capacity. There is an improvement plan in place to increase<br />
capacity within the teams and train staff to support an enabling time limited approach. Adjusted<br />
targets are being set for 2012-13 which take into account the timescales now in place within<br />
GCS for the full roll out <strong>of</strong> the locality teams.<br />
Page 7
400<br />
Reablement Services - Services Started during the Period with projections for new service user starts from<br />
January 2012 to March 2012<br />
350<br />
300<br />
250<br />
200<br />
150<br />
100<br />
50<br />
0<br />
January<br />
February<br />
March<br />
April<br />
May<br />
June<br />
July<br />
August<br />
September<br />
October<br />
November<br />
December<br />
January<br />
February<br />
March<br />
April<br />
May<br />
June<br />
July<br />
August<br />
September<br />
October<br />
November<br />
December<br />
January<br />
February<br />
March<br />
2010 2011 2012<br />
New Service User Projections All Service Starts New Service Users<br />
Reablement services are designed to be short term interventions that provide intensive and<br />
appropriate input to assist an individual in regaining confidence and maintaining or maximising<br />
their independence. It is important that the service is responsive and dynamic. Currently 30% <strong>of</strong><br />
those people who accessed reablement services did not finish their service within a 6 week<br />
period – this is against a projected outturn <strong>of</strong> 20%.<br />
Encouragingly the percentage <strong>of</strong> people going into ongoing services with no reablement in each<br />
month has steadily fallen from over 67% at the start <strong>of</strong> January 2011 to 61% in March 2012.<br />
The number <strong>of</strong> people starting ongoing services each month was projected to decrease to less<br />
than 200 by the end <strong>of</strong> 2011/12, whilst the percentage <strong>of</strong> these who do not receive reablement<br />
services first is planned to fall to 55% a month. Arrangements for monthly monitoring are in<br />
place, which will enable all teams to review their progress and performance against these<br />
targets.<br />
Whilst the number <strong>of</strong> people ending reablement services each month has varied considerably,<br />
the percentage <strong>of</strong> people who went on to receive adult care services immediately after<br />
reablement had been increasing slowly, averaging 51% in 2010. Encouragingly, in 2011/12 the<br />
average for the year has fallen to 47%.<br />
Assistive Technology:<br />
A key part <strong>of</strong> the reshaping <strong>of</strong> support is the increased use and application <strong>of</strong> assistive<br />
technology (telecare and telehealth). There is a programme in place to increase usage <strong>of</strong> both<br />
technologies. There was a waiting list for telecare assessments in GCC in 2010 and this has<br />
been cleared during 2011-12 with input from GCS. Further work is also required to mainstream<br />
telecare installations into the community teams in all except complex cases, there is<br />
improvement in place to support this.<br />
Page 8
T e l e c a r e : N e w S e r v i c e U s e r S t a r t s<br />
w i t h p r o j e c t i o n s t o M a r c h 2 0 1 2<br />
9 0<br />
8 0<br />
7 0<br />
6 0<br />
5 0<br />
4 0<br />
3 0<br />
2 0<br />
1 0<br />
0<br />
A p ril M a y J u n e J u ly A u g u s t S e p t e m b e r O c t o b e r N o v e m b e r D e c e m b e r J a n u a ry F e b ru a ry M a rc h<br />
N e w s e rv ic e u s e r s t a rt s - e x c lu d in g w a it in g li s t c le a ra n c e e x e rc is e P ro je c t io n N e w s t a rt s in c lu d in g w a it in g lis t c le a ra n c e e x e rc is e N e w S e rv i c e U s e r<br />
Future Plans<br />
Our shared aspiration is to continue developing practice, processes and systems which result in<br />
people getting the right service, in the right place, at the right time. The Living Well model <strong>of</strong><br />
care is being adopted across all partners, supporting a person focussed approach with timely<br />
and proportionate responses across the whole care system. We have demonstrated a strong<br />
partnership approach in developing the strategic thinking required, as well as recognising the<br />
interdependencies that support such changes, with further development <strong>of</strong> outcome monitoring<br />
and evaluation arrangements for all agencies.<br />
Conclusions<br />
This report demonstrates the considerable whole systems work that has been undertaken to<br />
reduce delayed transfers <strong>of</strong> care. Acute admissions to hospital are down, but not as much as<br />
we would like and DToC have been maintained at a low level, however reductions in Length <strong>of</strong><br />
Stay has not improved as much as we had hoped. Discharge processes are more robust,<br />
focussed and managed as a whole system, however investment in capacity within reablement<br />
services has taken longer than anticipated to come on stream, which has in turn impacted on<br />
the LoS for some people, although outcomes for individuals in receipt <strong>of</strong> reablement services<br />
has been positive.<br />
Linda Prosser, NHS <strong>Gloucestershire</strong><br />
Maggie Arnold, <strong>Gloucestershire</strong> Hospitals NHS Foundation Trust<br />
Gill Vickers, <strong>Gloucestershire</strong> <strong>Care</strong> Services<br />
Margaret Willcox, <strong>Gloucestershire</strong> County Council<br />
June 2012.<br />
Page 9
Page 10