Caboolture Region Water Quality Study - Moreton Bay Regional ...
Caboolture Region Water Quality Study - Moreton Bay Regional ...
Caboolture Region Water Quality Study - Moreton Bay Regional ...

Create successful ePaper yourself
Turn your PDF publications into a flip-book with our unique Google optimized e-Paper software.
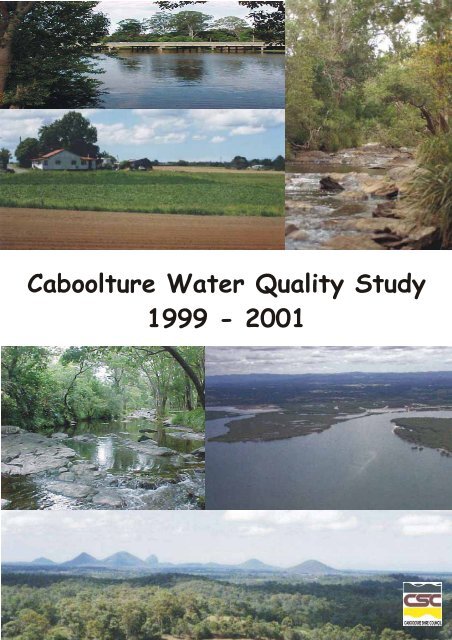
<strong>Caboolture</strong> <strong>Water</strong> <strong>Quality</strong> <strong>Study</strong><br />
1999 - 2001
<strong>Caboolture</strong> <strong>Region</strong> <strong>Water</strong><br />
<strong>Quality</strong> <strong>Study</strong><br />
1999-2001<br />
R. Counihan, J. Hodge and B. Cook<br />
<strong>Water</strong>ways Scientific Services<br />
Queensland Environmental Protection Agency<br />
For<br />
The <strong>Caboolture</strong> Shire Council<br />
April, 2002
<strong>Caboolture</strong> <strong>Water</strong> <strong>Quality</strong> <strong>Study</strong><br />
EXECUTIVE SUMMARY – WATER QUALITY CONDITION<br />
<strong>Water</strong> quality data collected during three environmental monitoring programs since January 1999 was<br />
collated and assessed to monitor the health of major waterways in <strong>Caboolture</strong> Shire. Data was<br />
obtained from the <strong>Caboolture</strong> Shire Council’s Environmental Monitoring Program, the Environmental<br />
Protection Agency and Ecological Health Monitoring Program (EHMP), and the Pumicestone <strong>Region</strong><br />
Coastal Monitoring Program (PRCMP). Indicators of water quality, sediment quality and faecal<br />
contamination were used during assessments. <strong>Water</strong> quality was assessed by comparing values for<br />
indicators at monitored sites with locally derived reference values (EPA, 2001), whereas guidelines for<br />
sediment quality and faecal contamination were adopted from the National Guidelines (ANZECC &<br />
ARMCANZ, 2000)<br />
A synopsis of the water quality analysis for each waterway, and then for waterway health overall,<br />
follows. Figure i shows the overall water quality assessments for all sites assessed for 2000-2001<br />
period.<br />
Sites in the estuarine reach of the <strong>Caboolture</strong> River had poor water quality, primarily caused by low<br />
concentrations of dissolved oxygen, and high turbidity and nutrient concentrations. Above the tidal limit<br />
in the freshwater reach, three of the five sites had good ratings. <strong>Water</strong> clarity, pH and salinity were<br />
generally good throughout the river, although turbidity was elevated at some estuarine sites. Nutrient<br />
(nitrogen and phosphorus) concentrations were elevated at most of the estuarine sites. <strong>Water</strong> quality<br />
in the estuary was impacted by discharge from a major wastewater treatment plant, resulting in<br />
increased nutrient loads and reduced levels of dissolved oxygen. Recent upgrades to the main<br />
treatment plant are likely to lead to improvements in water quality throughout the estuarine reach of<br />
the <strong>Caboolture</strong> River.<br />
The majority of sites monitored in Wararba Creek were found to have poor water quality, although the<br />
most upstream site had good water quality. All sites monitored had moderate to high concentrations of<br />
total phosphorous and low dissolved oxygen and most had high concentrations of ammonia.<br />
Overall water quality at all sites in Sheepstation Creek was in moderate to poor condition, with the<br />
more upstream sites being in poorer condition than the downstream sites. All sites had low dissolved<br />
oxygen levels, and upstream sites had high concentrations of total phosphorous and turbidity. Faecal<br />
coliform contamination was moderate at all sites monitored. Concentrations of oxidised nitrogen, total<br />
nitrogen and turbidity have improved in recent years. Concentrations of toxicants in sediments were<br />
low.<br />
<strong>Water</strong> quality at most sites in Lagoon Creek was rated as poor. All sites had poor condition ratings for<br />
dissolved oxygen, and most sites had high concentrations of turbidity and ammonia and moderate<br />
concentrations of oxidised nitrogen.<br />
Overall water quality at sites along Burpengary Creek was poor. All sites had low dissolved oxygen<br />
and high concentrations of total phosphorous. Downstream sites had high concentrations of ammonia.<br />
Sites located adjacent to and downstream from the major area of urban development on the creek<br />
were generally in worse condition than more upstream sites. Faecal contamination was not evident at<br />
most sites, and moderate at two sites.<br />
Saltwater Creek passes through the main industrial area of the <strong>Caboolture</strong> Shire and most sites had<br />
poor water quality. Dissolved oxygen, turbidity, ammonia and total phosphorous concentrations<br />
typically failed to meet the guideline values and median values of faecal coliforms were high at most<br />
sites. Sediment quality was poor at sites within and adjacent to stormwater retention structures located<br />
at a timber yard, and at a site adjacent to a stormwater outlet.<br />
<strong>Water</strong> quality throughout Deception <strong>Bay</strong> was variable. Generally the sites closer to land had poorer<br />
water quality than those further from land. Excluding conductivity (which is not a useful indicator in a<br />
2
<strong>Caboolture</strong> <strong>Water</strong> <strong>Quality</strong> <strong>Study</strong><br />
marine environment), most sites rated good for all indicators. However sites close to the mouth of the<br />
<strong>Caboolture</strong> River and the canals on the Redcliffe peninsula had elevated concentrations of nutrients<br />
and in some cases chlorophyll-a. This likely reflects their proximity to the land-sourced influences<br />
entering Deception <strong>Bay</strong>. EHMP monitoring has reported an increase in the frequency of Lyngbya<br />
blooms in Deception <strong>Bay</strong>.<br />
Overall, water quality on Bribie Island was moderate to poor, with only two sites out of sixteen rated<br />
as being in good condition (Figure 12). However, it is important to note that these assessments are<br />
based upon comparisons with water quality from natural reference waterways and because canals are<br />
man-made waterways, it may not be appropriate to expect the water quality of a natural waterway to<br />
be achievable in a canal. The major differences between the Bribie Island sites and the guideline<br />
values were low concentrations of dissolved oxygen and high concentrations of ammonia, especially<br />
in canal sites. Sites in Freshwater lagoon and Shirley Creek had high concentrations of faecal<br />
coliforms, possibly arising from the high abundance of waterbirds that use these areas and from urban<br />
run-off. Such urban influences might be expected in a man-made canal.<br />
Overall results of water quality assessments for Pumicestone Passage showed that water quality<br />
deteriorated with increasing distance from the opening of the passage to the ocean. Poor water quality<br />
ratings in the central area of the passage were due to high turbidity and poor secchi depth.<br />
Concentrations of total phosphorus were good throughout the passage, however total nitrogen<br />
concentrations were high at most sites monitored. All of these sites were close to the entrance of the<br />
Northern creeks into the passage, many of which also has high nitrogen concentrations (see below).<br />
<strong>Water</strong> quality was variable throughout the Northern Creeks. Most indicators were comparable to<br />
values for reference creeks in south-east Queensland. However, many of the creeks in the Northern<br />
creeks area had elevated concentrations of nitrogen. In some cases this was probably due to high<br />
organic inputs (eg from decaying vegetation matter), but in a few cases ammonia and oxidised<br />
nitrogen concentrations were elevated. Low concentrations of dissolved oxygen and low pH were also<br />
prevalent in many of the Northern Creeks, however these waterways are dystrophic systems and low<br />
pH and dissolved oxygen is natural for these stream types. It is likely therefore that the overall water<br />
quality condition assessments made in this report underestimate the quality of water in these systems.<br />
Overall, extremely variable patterns of water quality were detected throughout the <strong>Caboolture</strong> region,<br />
including variable patterns in long-terms trends over time. However, results suggest that the more<br />
developed urban areas show evidence of deterioration in water quality and that heavily industrialised<br />
areas have high concentrations of some toxicants in sediments. Some sites in close proximity to<br />
highways and major road had elevated concentrations of total petroleum hydrocarbons and lead in the<br />
sediments. Faecal contamination was evident near some industrial sites and in canal developments,<br />
the latter probably due to poor flushing, urban run-off and inputs from congregations of waterbirds.<br />
These observations highlight opportunities for management intervention for the improvement of the<br />
ecological health of waterways throughout the <strong>Caboolture</strong> Shire.<br />
Figure i. (overleaf) Summary map of results of water quality assessments for the <strong>Caboolture</strong> <strong>Region</strong> for the year 2001 – 2001.<br />
These ratings represent assessments based on water quality data for the period October 2000 to September 2001. The dots<br />
indicate the latest water quality assessments in comparison to the Queensland <strong>Water</strong> <strong>Quality</strong> Guidelines (green = good, yellow<br />
= moderate, red = poor, grey = insufficient data or median was detection limit which was greater than the guidelines).<br />
3
#<br />
#<br />
#<br />
#<br />
#<br />
Wararba Ck<br />
#<br />
#<br />
CABOOLTURE<br />
#<br />
#<br />
#<br />
# #<br />
# # #<br />
Sheepstation Ck<br />
Burpengary Ck<br />
Lagoon Ck<br />
#<br />
#<br />
#<br />
#<br />
#<br />
# # # #<br />
#<br />
#<br />
#<br />
Mellum Ck<br />
#<br />
# # #<br />
#<br />
#<br />
# #<br />
#<br />
#<br />
# #<br />
#<br />
#<br />
Bells Ck<br />
#<br />
#<br />
#<br />
#<br />
#<br />
#<br />
Hussey Ck<br />
Elimbah Ck<br />
#<br />
Ningi Ck<br />
#<br />
#<br />
#<br />
# #<br />
#<br />
#<br />
#<br />
#<br />
#<br />
#<br />
#<br />
#<br />
<strong>Caboolture</strong> # Rv<br />
#<br />
#<br />
#<br />
Saltwater Ck<br />
#<br />
#<br />
#<br />
#<br />
# # #<br />
#<br />
#<br />
# #<br />
#<br />
#<br />
#<br />
#<br />
#<br />
#<br />
#<br />
Pumicestone<br />
# Passage<br />
# #<br />
## # #<br />
#<br />
#<br />
# #<br />
# # # #<br />
# #<br />
#<br />
#<br />
#<br />
#<br />
#<br />
#<br />
#<br />
Bribie<br />
Island<br />
#<br />
#<br />
# #<br />
###<br />
#<br />
#<br />
Deception <strong>Bay</strong><br />
<strong>Water</strong> quality condition<br />
# Good<br />
# Moderate<br />
# Poor<br />
Shire boundary<br />
Major land use<br />
Settlement<br />
Open Space/Forest<br />
Rural<br />
Other/unknown<br />
N<br />
4 0 4 8 Kilometres<br />
Figure i Page 4<br />
#
<strong>Caboolture</strong> <strong>Water</strong> <strong>Quality</strong> <strong>Study</strong><br />
CONTENTS<br />
EXECUTIVE SUMMARY..........................................................................................................................2<br />
1.0 INTRODUCTION ................................................................................................................................7<br />
1.1 OVERVIEW OF CABOOLTURE SHIRE AND ITS WATERWAYS ...................................................................7<br />
2.0 SOURCES OF WATER QUALITY AND OTHER DATA ...................................................................7<br />
2.1 CABOOLTURE SHIRE COUNCIL’S ENVIRONMENTAL MONITORING PROGRAM.........................................7<br />
2.2 ENVIRONMENTAL PROTECTION AGENCY AND ECOLOGICAL HEALTH MONITORING PROGRAM (EHMP) ..8<br />
2.3 THE PUMICESTONE REGION COASTAL MONITORING PROGRAM (PRCMP) ..........................................8<br />
2.4 OTHER SOURCES OF DATA CONSIDERED IN THIS REPORT ....................................................................8<br />
2.4.1 Prioritising stream regeneration works to protect and restore fish habitat. ........................... 8<br />
2.4.2 Atlas of Natural Assets, Riparian and Reserve Vegetation, <strong>Caboolture</strong> Shire Council......... 8<br />
2.4.3 State of the Rivers: Pumicestone <strong>Region</strong> Subcatchments, 2001.......................................... 8<br />
2.4.4 Land-use map, <strong>Caboolture</strong> Shire Council............................................................................ 10<br />
3.0 WATER QUALITY GUIDELINES ....................................................................................................10<br />
3.1 WATER QUALITY GUIDELINES..........................................................................................................10<br />
3.2 SEDIMENT QUALITY GUIDELINES .....................................................................................................11<br />
3.3 FAECAL COLIFORM GUIDELINES ......................................................................................................11<br />
4.0 ASSESSMENT OF WATER QUALITY DATA.................................................................................12<br />
4.1 ASSESSMENT OF CURRENT WATER QUALITY DATA ..........................................................................12<br />
4.2 ASSESSMENT OF LONG-TERM TRENDS............................................................................................14<br />
4.3 DATA USED IN WATER QUALITY ANALYSES ........................................................................................14<br />
5.0 MONITORING RESULTS .............................................................................................................. 145 15<br />
5.1 CABOOLTURE RIVER CATCHMENT ...................................................................................................16<br />
5.1.1 Overview.............................................................................................................................. 16<br />
5.1.2 <strong>Caboolture</strong> River.................................................................................................................. 16<br />
5.1.3 Wararba Creek .................................................................................................................... 19<br />
5.1.4 Sheepstation Creek ............................................................................................................. 20<br />
5.1.5 Lagoon Creek ...................................................................................................................... 20<br />
5.2 BURPENGARY CREEK .....................................................................................................................21<br />
5.3 SALTWATER CREEK........................................................................................................................23<br />
5.4 DECEPTION BAY.............................................................................................................................26<br />
5.5 BRIBIE ISLAND................................................................................................................................28<br />
5.6 PUMICESTONE PASSAGE.................................................................................................................30<br />
5.7 NORTHERN CREEKS .......................................................................................................................32<br />
5.7.1 Overview.............................................................................................................................. 33<br />
5.7.2 Lamerough Canals .............................................................................................................. 35<br />
5.7.3 Bells Creek........................................................................................................................... 35<br />
5.7.4 Coochin and Mellum Creeks................................................................................................ 35<br />
5.7.5 Coonowrin/Saltwater Creek.................................................................................................35<br />
5.7.6 Hussey Creek ...................................................................................................................... 35<br />
5.7.7 Glass Mountain Creek ......................................................................................................... 35<br />
5.7.8 Bullock Creek....................................................................................................................... 36<br />
5.7.9 Elimbah Creek ..................................................................................................................... 36<br />
5.7.10 Ningi Creek ........................................................................................................................ 36<br />
6.0 CONCLUDING REMARKS..............................................................................................................37<br />
REFERENCES .......................................................................................................................................38<br />
APPENDICES ........................................................................................................................................39<br />
APPENDIX A: WATER QUALITY MONITORING PROGRAMS, SITES AND INDICATORS .....................................39<br />
APPENDIX B: DATA PRESENTATION- BOX AND WHISKER PLOTS ..............................................................46<br />
APPENDIX C: RESULTS OF ANNUAL ASSESSMENT OF WATER QUALITY......................................................48<br />
C1:<strong>Water</strong> quality assessments for recent years ........................................................................... 48<br />
C2: Medians of water quality data for selected indicators at all sites ........................................... 53<br />
C3: Box plots - Northern Creeks (PRCMP DATA)........................................................................ 57<br />
C4: Box plots – Bribie Island (CSC DATA)................................................................................... 77<br />
C5: Box plots – Bribie Island (PRCMP DATA) ............................................................................. 85<br />
C6: Box plots – <strong>Caboolture</strong> <strong>Region</strong> (EPA DATA) ......................................................................... 89<br />
C7: Box plots - <strong>Caboolture</strong> <strong>Region</strong> (CSC DATA) ......................................................................... 93<br />
C8: Box plots – Burpengary Creek (CSC DATA) ....................................................................... 105<br />
C9: Box plots – Saltwater Creek (CSC DATA) ........................................................................... 108<br />
C10: Box plots – Pumicestone Passage (EPA DATA) ............................................................... 111<br />
5
<strong>Caboolture</strong> <strong>Water</strong> <strong>Quality</strong> <strong>Study</strong><br />
C11: Box plots – Pumicestone Passage (PRCMP DATA) ......................................................... 115<br />
C12: Box plots – Deception <strong>Bay</strong> (EPA DATA)............................................................................ 119<br />
APPENDIX D: RESULTS OF REGRESSION ANALYSIS OF LONG TERM TRENDS ........................................ 123<br />
APPENDIX E: RESULTS OF DEPTH PROFILE ANALYSIS ......................................................................... 124<br />
APPENDIX F: MAP OF FISH COMMUNITY ASSESSMENT ........................................................................ 126<br />
APPENDIX G: MAP OF RIPARIAN VEGETATION ASSESSMENT................................................................ 127<br />
APPENDIX H: MAP OF LAND USE ZONES............................................................................................. 128<br />
LIST OF TABLES<br />
Table 1. <strong>Water</strong>way attributes asessed in the State of the Rivers Reporting. .................................................................................11<br />
Table 2. State water quality guidelines for coastal central and southern Queensland for protection of aquatic ecosystems. .......11<br />
Table 3. Key to symbols used in the results of integrated assessment tables. ..............................................................................14<br />
Table 4. <strong>Water</strong>ways assessed in this study and the subcatchment to which they were assigned. ...............................................15<br />
Table 5. Results of water quality assessments for the <strong>Caboolture</strong> River <strong>Region</strong>...........................................................................17<br />
Table 6. Concentrations of toxicants in sediments.........................................................................................................................19<br />
Table 7. Median faecal coliform concentrations (CFU/100ml) from all samples collected since 1999...........................................19<br />
Table 8. <strong>Water</strong> quality assessments for the <strong>Caboolture</strong> River <strong>Region</strong>...........................................................................................22<br />
Table 9. Median faecal coliform concentrations (CFU/100ml) from all samples collected since 1999...........................................22<br />
Table 10. <strong>Water</strong> quality assessments for Saltwater creek.. ...........................................................................................................24<br />
Table 11. Concentrations of toxicants in sediments.......................................................................................................................25<br />
Table 12. Median faecal coliform concentrations (CFU/100ml) from all samples collected since 1999.........................................25<br />
Table 13. <strong>Water</strong> quality assessments for Deception <strong>Bay</strong>. .............................................................................................................27<br />
Table 14. <strong>Water</strong> quality assessments for Bribie Island.. ................................................................................................................29<br />
Table 15. Median faecal coliform concentrations (CFU/100ml) from all samples collected since 1999.........................................29<br />
Table 16. <strong>Water</strong> quality assessments for tPumicestone Passage. ................................................................................................34<br />
Table 17. <strong>Water</strong> quality assessments for the Northern Creeks......................................................................................................34<br />
Table 18. Indicators assessed at the sites monitored by the <strong>Caboolture</strong> Shire Council’s Environmental Monitoring Program. ....39<br />
Table 19. Indicators assessed at the sites monitored by the Queensland Environmental Protection Agency...............................40<br />
Table 20. Indicators assessed at the sites monitored by the Pumicestone Catchment Coordination Association (PRCMP)........41<br />
Table 21. Sites monitored by all agencies including geographic basin information, stream information and geographical<br />
locations...............................................................................................................................................................................42<br />
Table 22. Abbreviations for watertypes relevant for the present study. .........................................................................................47<br />
Table 23. <strong>Water</strong> quality assessments for all indicators at all sites from 1999 to 2001. ..................................................................48<br />
Table 24. Medians for selected water quality indicators at sites in the Northern Creeks ...............................................................53<br />
Table 25. Medians for selected water quality indicators at sites on Bribie Island ..........................................................................53<br />
Table 26. Medians for selected water quality indicators at sites in Pumicestone Passage............................................................54<br />
Table 27. Medians for selected water quality indicators at sites in the <strong>Caboolture</strong> River ..............................................................55<br />
Table 28. Medians for selected water quality indicators at sites in Burpengary Creek ..................................................................56<br />
Table 29. Medians for selected water quality indicators at sites in Saltwater Creek......................................................................56<br />
Table 30. Medians for selected water quality indicators at sites in Deception <strong>Bay</strong> ........................................................................56<br />
Table 31. Significant linear trends for each site and indicator combination.. ...............................................................................123<br />
LIST OF FIGURES<br />
Figure i. Summary map of results of water quality assessments for the <strong>Caboolture</strong> <strong>Region</strong> for the year 2001 – 2001...................3<br />
Figure 1. <strong>Water</strong> quality monitoring sites assessed in this study.......................................................................................................9<br />
Figure 2. Important statistics for the test site data assessment. ....................................................................................................12<br />
Figure 3. Schematic representation of the method of assessing individual indicators against guideline values using box plot<br />
diagrams..............................................................................................................................................................................13<br />
Figure 4. Decision rules used in the generation of colour ratings for sites during steps 2 and 3 of the assessment process. ......13<br />
Figure 5. Example of a visual water quality trend assessment. .....................................................................................................14<br />
Figure 6. Final water quality assessments for the <strong>Caboolture</strong> River <strong>Region</strong> for the year 2000-2001.. ..........................................16<br />
Figure 7. Box plots of results for dissolved oxygen for sites in the <strong>Caboolture</strong> River.....................................................................16<br />
Figure 8. Box plots of results for total nitorgen for sites in the <strong>Caboolture</strong> River.. .........................................................................16<br />
Figure 9. Final water quality assessments for the Burpengary Creek for the year 2000-2001. .....................................................21<br />
Figure 10. Final water quality assessments for the Saltwater Creek for the year 2000-2001 ........................................................23<br />
Figure 11: Final water quality assessments for the Deception <strong>Bay</strong> for the year 2000-2001.. ........................................................26<br />
Figure 12. Final water quality assessments for Bribie Island for the year 2000-2001....................................................................28<br />
Figure 13. Final water quality assessments for Pumicestone Passage for the year 2000-2001....................................................30<br />
Figure 14. Box plots of results for conductivity in sites in Pumicestone Passage ..........................................................................32<br />
Figure 15. Box plots of results for secchi at sites in Pumicestone Passage ..................................................................................32<br />
Figure 16. Final water quality assessments for Northern Creeks for the year 2000-2001 .............................................................33<br />
Figure 17. Box plot of pH in Elimbah Creek ...................................................................................................................................33<br />
Figure 18. Schematic representation of box and whisker plots......................................................................................................46<br />
Figure 19. Example of a box and whisker plot, showing values recorded at monitoring sites (left) and reference sites (right) for<br />
chlorophyll-a. .......................................................................................................................................................................46<br />
Figure 20. Results of Regression Analysis for pH at site BRI-1 to test for stratification with depth. ............................................124<br />
Figure 21. Results of Regression Analysis for dissolved oxygen at site BRI-5 to test for stratification with depth. .....................126<br />
Figure 22. Results of Regression Analysis of dissolved oxygen for site BRI-6 to test for stratification with depth ......................125<br />
Figure 23: Overall fish habitat ratings in the <strong>Caboolture</strong> region (Langdon, 2001)........................................................................126<br />
Figure 24. Riparian vegetation size index ...................................................................................................................................127<br />
Figure 25. Riparian vegetation integrity index .............................................................................................................................127<br />
Figure 26. GIS-based land use mapping (<strong>Caboolture</strong> Shire Council) ..........................................................................................128<br />
6
<strong>Caboolture</strong> <strong>Water</strong> <strong>Quality</strong> <strong>Study</strong><br />
1.0 INTRODUCTION<br />
The <strong>Caboolture</strong> Shire Council (CSC) has conducted an Environmental Monitoring Program in major<br />
waterways within the Shire since January 1999. The objective of this monitoring was to assess,<br />
monitor and manage the health of major waterways in the Shire.<br />
CSC is presently reviewing the Environmental Monitoring Program, with a view to expand the current<br />
program to better assess the ecological health of waterways in the Shire.<br />
In addition to the CSC’s Environmental Monitoring Program, the Queensland Environmental Protection<br />
Agency (EPA) and an NHT Coast and Clean Seas Project (the Pumicestone <strong>Region</strong> Coastal<br />
Monitoring Program (PRCMP)) have also conducted water quality monitoring in the <strong>Caboolture</strong><br />
<strong>Region</strong>. Data from these three monitoring programs were collated to generate a large data set upon<br />
which to base this water quality study.<br />
The objectives of this study were to:<br />
assess the current condition of waterways for which water quality data exists;<br />
determine trends in water quality data;<br />
consider the findings of other studies (see below) describing biological health, habitat and landuses.<br />
1.1 Overview of <strong>Caboolture</strong> Shire and its waterways<br />
The <strong>Caboolture</strong> Shire is located in southeast Queensland, midway between Brisbane and the<br />
Sunshine Coast. The region is characterised by diverse land uses, including rural and urban<br />
settlements, commercial and industrial developments, and large areas of open spaces, and is<br />
experiencing considerable growth. Significant environmental features of the region include the Glass<br />
House Mountains, various National Parks, diverse flora and fauna and its waterways, including<br />
Pumicestone Passage.<br />
<strong>Water</strong>ways of the <strong>Caboolture</strong> region include wetlands, streams, rivers, estuaries and bays. This<br />
diverse range of waterways provide important socio-economic opportunities, such as recreation and<br />
fishing, and ecological functions, such as fish spawning and nursery grounds, waterbird feeding and<br />
roosting sites, and habitat for wide range of other flora and fauna. These waterways, and their socioeconomic<br />
and environmental values, contribute to the natural character of the <strong>Caboolture</strong> region and<br />
are important in maintaining the local economy.<br />
<strong>Water</strong> quality monitoring is an important part of the process of managing and protecting water quality<br />
in the <strong>Caboolture</strong> region and the social, economic and ecological values that healthy waterways<br />
support.<br />
2.0 SOURCES OF WATER QUALITY AND OTHER DATA<br />
<strong>Water</strong> quality data were obtained from three independent monitoring programs that have recently<br />
undertaken monitoring of water quality in the <strong>Caboolture</strong> <strong>Region</strong> (Figure 1): CSC’s Environmental<br />
Monitoring Program, EPA’s monitoring program, and the PRCMP’s monitoring program. These<br />
programs, and other sources of data used in this study, are described below.<br />
2.1 <strong>Caboolture</strong> Shire Council’s Environmental Monitoring Program<br />
CSC has been expanding its Environmental Monitoring Program since its inception in January 1999.<br />
In 2000, the program monitored various indicators at 54 sites in eight of the major waterways<br />
throughout the Shire. <strong>Water</strong> quality was assayed monthly at most sites, although sites in the Bribie<br />
Island canals were monitored every three months. Table 18 (Appendix A) lists the sites, the duration of<br />
monitoring and the indicators monitored. Physico-chemical indicators such as dissolved oxygen,<br />
7
<strong>Caboolture</strong> <strong>Water</strong> <strong>Quality</strong> <strong>Study</strong><br />
turbidity and conductivity and nutrients were monitored at all sites. Secchi depth and phytoplankton<br />
biomass was monitored at the canal sites, as were depth profiles for physico-chemical indicators.<br />
Toxicants in sediments were monitored at some sites in Saltwater Creek, Sheepstation Creek and<br />
Lagoon Creek.<br />
2.2 Environmental Protection Agency and Ecological Health Monitoring Program (EHMP)<br />
For the purposes of this study, the water quality data obtained from the EHMP program, a Healthy<br />
<strong>Water</strong>ways program, will not be distinguished from EPA water quality data (since the water quality<br />
component of EHMP is operated by EPA, ensuring that sampling techniques and quality assurance<br />
measures are identical). Although the EPA has been conducting water quality monitoring in<br />
Queensland since the 1970’s, only data collected since 1995 has been analysed in this study. Fiftyfour<br />
sites across Deception <strong>Bay</strong>, Pumicestone Passage and <strong>Caboolture</strong> River were monitored<br />
monthly. The indicators measured at each site are listed in Table 18 (Appendix A). Physico-chemical,<br />
nutrient, secchi depth and phytoplankton biomass (chlorophyll-a) indicators were monitored at most<br />
sites.<br />
2.3 The Pumicestone <strong>Region</strong> Coastal Monitoring Program (PRCMP)<br />
The Pumicestone <strong>Region</strong> Coastal Monitoring Program (PRCMP) was an NHT-funded Coast and<br />
Clean Seas Project for which water quality was monitored in Pumicestone Passage and its major<br />
tributaries since 1997. Fifty-eight sites (Appendix A) were assessed in this study for physico-chemical<br />
and secchi depth indicators. Nutrient concentrations were monitored at sixteen of those sites and are<br />
reported here.<br />
2.4 Other sources of data considered in this report<br />
Data types other than water quality were also considered in this study, including physical and<br />
biological attributes. Findings based on these other data types have not been summarised in this<br />
study, although they are referred to when appropriate. For a complete list of all data and information<br />
sources, please refer to the reference list.<br />
2.4.1 Prioritising stream regeneration works to protect and restore fish habitat.<br />
(Langdon, 2001).<br />
This ongoing project assesses stream condition by monitoring the structure of fish communities.<br />
Although a number of measures of fish community condition are generated only the overall site rating<br />
is considered in this study (Figure 23, Appendix F).<br />
2.4.2 Atlas of Natural Assets, Riparian and Reserve Vegetation, <strong>Caboolture</strong> Shire Council<br />
In 1995 CSC adopted the Atlas of Natural Assets (ANA, 1998), which documents remnant vegetation<br />
and plant diversity within the Shire. The Atlas provides essential information about the natural<br />
resources of the Shire to decision-makers, planners, developers and the general public. The<br />
assessment and mapping of riparian vegetation was updated in 1998 by WBM Oceanics Australia<br />
(Figures 24 and 25, Appendix G).<br />
2.4.3 State of the Rivers: Pumicestone <strong>Region</strong> Subcatchments, 2001<br />
The Pumicestone <strong>Region</strong> Subcatchments State of the Rivers report (SoR, 2001) provides a<br />
comprehensive assessment of the physical condition of rivers and streams of the region. Of relevance<br />
to this study are the assessments of the Northern Creeks, the <strong>Caboolture</strong> River, Lagoon Creek and<br />
Bribie Island. Attributes that were assessed in the SoR are presented in Table 1.<br />
8
<strong>Caboolture</strong> <strong>Water</strong> <strong>Quality</strong> <strong>Study</strong><br />
Figure 1. <strong>Water</strong> quality monitoring sites assessed in this study. Data was obtained from the <strong>Caboolture</strong> Shire Council’s<br />
Environmental Monitoring Program (CSC), the Queensland Environmental Protection Agency’s monitoring programs (EPA) and<br />
the Pumicestone <strong>Region</strong> Coastal Monitoring Program (PRCMP).<br />
PRCMP<br />
9
<strong>Caboolture</strong> <strong>Water</strong> <strong>Quality</strong> <strong>Study</strong><br />
Table 1. <strong>Water</strong>way attributes assessed in State of the Rivers Reporting (SoR, 2001)<br />
Attribute<br />
Reach environs<br />
Channel habitat diversity<br />
Stream bed and bank sediments<br />
Bank Stability<br />
Stream bed and bar stability<br />
Riparian vegetation condition<br />
Aquatic habitat<br />
<strong>Water</strong> quality<br />
Overall condition<br />
Description<br />
The extent of clearing, weed invasion in riparian vegetation, land<br />
use, vegetation types and forms of disturbance.<br />
Proportion of various channel habitats, reported as an index of<br />
habitat diversity. Includes pools, riffles, backwaters, waterfalls,<br />
glides and runs.<br />
Sediment composition and size.<br />
Proportion of the bank that is considered stable.<br />
Density of bars and overall bed stability.<br />
Proportion of cover and structure of riparian vegetation.<br />
Proportion of stream bed covered by in-stream debris, rock<br />
outcrops, vegetation, overhangs.<br />
Odours, unnatural colours, forms, iron stains, discharge pipes,<br />
slime and algae, water surface scum and oils.<br />
Rating of all of the above attributes.<br />
2.4.4 Land-use map, <strong>Caboolture</strong> Shire Council<br />
CSC maintains a GIS-based land-use mapping system that records the spatial distribution of major<br />
land-uses such as commercial, industrial, extractive resources, residential, rural, open space and state<br />
forest (Figure 26, Appendix H).<br />
3.0 WATER QUALITY GUIDELINES<br />
Three categories of indicators were compared with guidelines to determine the condition of the<br />
waterways: water quality indicators, sediment quality indicators, and faecal contamination indicators.<br />
The guidelines used for each of these are discussed below.<br />
3.1 <strong>Water</strong> <strong>Quality</strong> Guidelines<br />
<strong>Water</strong> quality was assessed by comparing water quality at monitored sites with locally derived<br />
reference values, as recommended in the Australian <strong>Water</strong> <strong>Quality</strong> Guidelines for Fresh and Marine<br />
<strong>Water</strong>s (Australian and New Zealand Environment and Conservation Council & Agriculture and<br />
Resource Management Council of Australia and New Zealand (ANZECC & ARMCANZ, 2000).<br />
Reference values for an indicator are the measured values for that indicator at local reference sites,<br />
that is, sites in local ecosystems that are in a substantially natural condition. Reference values provide<br />
a reliable measure of natural water quality as they take local environmental conditions into<br />
consideration. However, reference values do not in themselves represent water quality guidelines. To<br />
determine an appropriate guideline, the degree of departure from “reference condition” (i.e. reference<br />
values) that can be tolerated by the ecosystem needs to be determined. The National guidelines<br />
(ANZECC & ARMCANZ, 2000) suggest that for physico-chemical indicators, the 20 th and 80 th<br />
percentiles of the reference data should form the guidelines, and that the median value for indicators<br />
at monitoring sites should fall within this range.<br />
The Queensland EPA has developed water quality guidelines for Queensland (EPA, 2001) using the<br />
approach recommended by the National Guidelines (ANZECC & ARMCANZ, 2000). The Queensland<br />
guidelines are based on at least five years of monthly data, and are therefore unbiased with respect to<br />
time. The geographic region of the reference sites is assessed to derive guidelines for southern,<br />
central or northern regions of Queensland. In this study, the Southern Queensland <strong>Water</strong> <strong>Quality</strong><br />
Guidelines (EPA, 2001) were used. Guidelines are specified for several water types: ocean, open<br />
coastal, enclosed coastal/lower estuary, mid estuary, upper estuary, lower catchment and upper<br />
catchment.<br />
10
<strong>Caboolture</strong> <strong>Water</strong> <strong>Quality</strong> <strong>Study</strong><br />
Table 2. Queensland water quality guidelines (v2, EPA, 2001) for coastal central and southern Queensland for protection of<br />
aquatic ecosystems.<br />
<strong>Water</strong> type Organic N Ammonia Oxidised N Total N Filt. React. P Total P<br />
μg/L μg/L μg/L L μg/L μg/L μg/L<br />
Upper Catchment 270 13 30 320 20 40<br />
Lower catchment 400 15 40 500 20 50<br />
Upper estuarine 400 40 30 470 25 70<br />
Mid-estuarine 210 20 15 300 15 35<br />
Enclosed coastal 180 15 5 200 15 35<br />
Marine 100 15 3 120 10 25<br />
<strong>Water</strong> type Chlorophyll-a Turbidity Susp. Solids Secchi depth Dissolved O 2 pH<br />
μg/L NTU mg/L m % saturation units<br />
Upper Catchment 2.0 10 5 n/a 90-105 6.5-8.0<br />
Lower catchment 5.0 10 5 n/a 85-105 6.5-8.0<br />
Upper estuarine 10.0 20 30 0.4 75-100 7.0-8.0<br />
Mid-estuarine 5.0 10 20 0.8 80-100 7.0-8.5<br />
Enclosed coastal 2.5 7 15 1.0 85-100 7.5-8.4<br />
Marine 1.0 2 10 90-100 8.0-8.4<br />
3.2 Sediment <strong>Quality</strong> Guidelines<br />
The National guidelines (ANZECC & ARMCANZ, 2000) for toxicants in sediments were used to assess<br />
sediment quality in the <strong>Caboolture</strong> <strong>Region</strong>. These guidelines presents two values in their guidelines, a<br />
lower trigger level, below which there is a low probability of detrimental effects to benthic biota, and a<br />
high trigger level, above which there is a high probability of toxic effects to biota. For some toxicants,<br />
National guidelines do not exist due to limited data. For these toxicants, the guidelines recommend<br />
deriving an interim guideline value based upon natural background levels multiplied by two. Where this<br />
was required, the background level used was the lowest value measured for a given waterway.<br />
In this report, a site is considered to be in good condition with regard to sediment toxicants if the<br />
measured concentration is less than the low trigger level, moderate if between the low and high trigger<br />
levels, and poor if above the high trigger level.<br />
Typical reference values for some trace metals in estuaries and creeks in Queensland have been<br />
reported by Moss and Costanzo (1998) and are referred to in this document. However, these reference<br />
values were derived from samples of fine sediment only, i.e. sediment less than 63 μm, and may not be<br />
indicative of reference values for all sediment grades.<br />
3.3 Faecal Coliform Guidelines<br />
Faecal coliform concentrations were monitored to indicate levels of faecal contamination in some<br />
major waterways. National faecal coliform guidelines have been developed to assess faecal<br />
contamination levels and human health risks in recreational waterways (ANZECC & ARMCANZ,<br />
2000). However, the sampling regime used by the CSC (monthly samples) differs from that<br />
recommended by ANZECC & ARMCANZ (2000) (which specifies at least five samples taken at<br />
approximately weekly intervals). Consequently, results for faecal coliform concentrations from this<br />
study cannot be compared directly with those guidelines.<br />
11
<strong>Caboolture</strong> <strong>Water</strong> <strong>Quality</strong> <strong>Study</strong><br />
In this study, National guidelines (ANZECC & ARMCANZ, 2000) were used to define low, moderate<br />
and high concentrations of faecal coliforms, corresponding respectively to good, moderate and poor<br />
water quality. The guidelines recommend median faecal coliform concentrations lower than 150 CFU<br />
per 100mL for primary contact activities (e.g. swimming) and median concentrations lower than 1000<br />
CFU per 100mL for secondary contact activities (e.g. canoeing). Therefore, concentrations of less<br />
than 150 CFU per 100mL are defined as “low” concentrations, and concentrations between 150 and<br />
1000 CFU per 100mL are defined as “moderate”. Concentrations greater than 1000 CFU per 100mL<br />
are regarded as “high”.<br />
4.0 ASSESSMENT OF WATER QUALITY DATA<br />
4.1 Assessment of Current <strong>Water</strong> <strong>Quality</strong> Data<br />
A three-stage process was employed in the assessment of water quality at monitored (test) sites<br />
throughout the <strong>Caboolture</strong> <strong>Region</strong> for water quality data (sediment toxicants and faecal coliforms were<br />
considered separately and not included in the integrated assessment). The three steps of the<br />
processes are:<br />
1. assessment of test site data for individual indicators against guideline values;<br />
2. assessment of indicator categories (comprised of multiple indicators); and<br />
3. an (overall) integrated assessment based on individual indicators and indicator categories.<br />
The statistics of importance in this assessment were the median, and 20 th and 80 th percentiles. The<br />
median is the value that divides the data in half, 50 percent of the measurements being above (or<br />
equal to) it and 50 percent being below (or equal to it). The 20 th percentile is the value below which 20<br />
percent of the data lie. The 80 th percentile is the value below which 80 percent of the data lie. This is<br />
graphically illustrated in Figure 2.<br />
80th percentile: 80 percent of<br />
values fall below this line<br />
Median<br />
20th percentile: 20 percent of<br />
values fall below this line<br />
Figure 2. Important statistics for the test site data assessment.<br />
Step 1 of the assessment process involved an assessment of measurements of individual indicators<br />
against guideline values for each site. For some indicators, ( pH and dissolved oxygen) both high and<br />
low concentrations were of interest (i.e. trigger values exist for upper and lower limits). For these twotailed<br />
indicators the median and 20 th and 80 th percentiles were assessed against guideline values. For<br />
all other indicators where only high levels were of interest (i.e. there was only an upper limit trigger<br />
value), the median and 20 th percentile values were assessed against trigger values.<br />
This assessment generated a coloured rating of green, yellow or red for the individual indicator,<br />
meaning a good, moderate or poor result for the assessment respectively (Figure 3).<br />
12
<strong>Caboolture</strong> <strong>Water</strong> <strong>Quality</strong> <strong>Study</strong><br />
Green: Median is within guidelines derived from<br />
20 th and 80 th percentiles of reference values<br />
Yellow: Median exceeds but 20 th percentile is<br />
within the guidelines (or median is lower but<br />
80 th percentile is with guidelines for two-tailed<br />
indicators).<br />
Red: Median and 20 th percentile exceed<br />
guidelines (or median and 80 th are lower than<br />
guidelines for two-tailed guidelines).<br />
Reference Site Green Yellow Red<br />
Figure 3. Schematic representation of the method of assessing individual indicators against guideline values using box plot<br />
diagrams. A full description of the interpretation of box plots is given in Appendix B, p. 54.<br />
Step 2 of the process involved combining related indicators into a single indicator category to avoid<br />
over-representation of related indicators in the final assessment. Indicators were grouped into the<br />
following categories:<br />
<br />
<br />
<br />
<br />
<br />
Nitrogen (organic nitrogen, ammonia, nitrate plus nitrite and total nitrogen);<br />
Phosphorus (filterable reactive phosphorus and total phosphorus);<br />
Microalgal growth (chlorophyll-a);<br />
<strong>Water</strong> clarity (turbidity, suspended solids and secchi depth);<br />
Dissolved oxygen (dissolved oxygen).<br />
Colour ratings for indicator categories were generated based on the colour rating of the constituent<br />
indicators, using the decision rules presented in Figure 4.<br />
Figure 4. Decision rules used in the generation of colour ratings for sites during steps 2 and 3 of the assessment process.<br />
Criteria<br />
Result<br />
0 red More green than yellow<br />
Yes<br />
<br />
No<br />
<br />
1 red More yellow than green<br />
No<br />
<br />
Yes<br />
<br />
2 or more red <br />
Step 3 of the process involved an integrated assessment of the indicator categories (from Step 2),<br />
using the same decision rules as presented in Figure 4. This generated an integrated colour rating (i.e.<br />
green, yellow or red) for water quality at each test site, presented as a coloured dot (green, yellow, or<br />
red) on the relevant map and tables of results (see Table 2). A grey dot was generated if there was<br />
insufficient data to assess water quality against guidelines.<br />
13
<strong>Caboolture</strong> <strong>Water</strong> <strong>Quality</strong> <strong>Study</strong><br />
Table 3. Key to symbols used in the results of integrated assessment tables.<br />
Integrated <strong>Water</strong><br />
<strong>Quality</strong> Rating<br />
<br />
<br />
<br />
<br />
Good water quality<br />
Moderate water quality<br />
Poor water quality<br />
Description<br />
Insufficient data or the detection limit was greater than the guidelines and<br />
median was equal to the detection limit<br />
4.2 Assessment of Long-Term Trends<br />
Long-term trends were assessed using two independent methods: statistical regression analysis and<br />
change in integrated water quality assessments over time (years). The regression analysis detects<br />
linear trends in water quality data over time, ie trends of increasing or decreasing concentrations of<br />
indicators. However the small samples sizes of the data for this study (i.e. data for only two or three<br />
years at monitored sites) reduces the power of this technique to resolve temporal patterns.<br />
Consequently, most discussion on temporal trends in water quality is based on changes in overall<br />
water quality assessment at a site over years (see Figure 5). This approach provides a robust method<br />
of detecting changes in water quality based upon their compliance with the guidelines, and as such is<br />
likely to represent real changes in water quality.<br />
Site<br />
Source <strong>Water</strong><br />
Type<br />
Stream Name Trend 2001 2000 1999<br />
CAB-1 CSC UC <strong>Caboolture</strong> Rv or <br />
CAB-3 CSC LC <strong>Caboolture</strong> Rv <br />
CAB-6 CSC ME <strong>Caboolture</strong> Rv or <br />
CAB-7 CSC ME <strong>Caboolture</strong> Rv <br />
Improvement<br />
No trend<br />
Deterioration<br />
Variable trend<br />
Figure 5. Example of trend analysis of water quality assessment. The change in water quality assessments (coloured dots) over<br />
the years 1999 to 2001 were used to assess the direction of change (if any) of an indicator (green trend= improvement, red<br />
trend= deterioration, black trend= variable trend, blank= no trend). The direction of the arrow indicates whether concentrations<br />
of the indicators have increased or decreased.<br />
4.3 Data used in water quality analyses<br />
The data from the three programs were assessed for recent water quality condition, as well as water<br />
quality condition over previous years. Usually 12 months of monthly data is required for an accurate<br />
assessment of water quality. Some of the water quality programs did not comprise regular monthly<br />
sampling. As such, the data used in the analyses presented in this report were treated as follows:<br />
CSC- Bribie Island sites (3-monthly sampling)<br />
CSC-all other sites<br />
EPA – all sites<br />
PRCMP– all sites<br />
Data collected<br />
3/2000 – 9/2001 2001<br />
1/1999 – 11/1999 1999<br />
10/2000 – 9/2001 2001<br />
10/1999 – 9/2000 2000<br />
1/1999 – 9/1999 1999<br />
10/2000 – 9/2001 2001<br />
10/1999 – 9/2000 2000<br />
10/1998 – 9/1999 1999<br />
10/1999 – 4/2000, 12/2000 – 4/2000 2000<br />
10/1998 – 9/1999 1999<br />
10/1997 – 9/1998 1998<br />
Data<br />
reported as<br />
14
<strong>Caboolture</strong> <strong>Water</strong> <strong>Quality</strong> <strong>Study</strong><br />
5.0 MONITORING RESULTS<br />
Data from the three programs have been collated and assessed (as described in Section 4.0) and are<br />
presented below for each sub-catchment of the region (Table 3).<br />
Table 4. <strong>Water</strong>ways assessed in this study and the subcatchment to which they were assigned. The waterways of each<br />
subcatchment are grouped in the following pages.<br />
Sub-catchment<br />
<strong>Caboolture</strong> River<br />
Burpengary Creek<br />
Saltwater Creek<br />
Deception <strong>Bay</strong><br />
Bribie Island<br />
Pumicestone Passage<br />
Northern Creeks<br />
<strong>Water</strong>ways<br />
Lagoon, Wararba, Sheepstation Creeks, <strong>Caboolture</strong> River<br />
Burpengary Creek<br />
Saltwater Creek<br />
Deception <strong>Bay</strong><br />
Shirley, Westaways and Poverty Creeks, Pacific Harbour,<br />
Bribie Gardens<br />
Pumicestone Passage<br />
Bells, Coochin, Mellum, Hussey, Glass Mountain, Bullock,<br />
Elimbah, Ningi, Saltwater Creeks, Lamerough Canal.<br />
For each sub-catchment, the following results are presented:<br />
maps showing results of the integrated assessment of water quality at each site;<br />
tables showing results of current water quality assessments for each indicator/site<br />
combination;<br />
tables showing trends in water quality assessments (Table 22, Appendix C);<br />
tables showing medians for water quality indicators for each site (Tables 23 – 29, Appendix<br />
C),<br />
box plots showing levels of indicators in relation to guidelines for each site (Appendix C), and<br />
if applicable,<br />
tables showing results of assessments of toxicants in sediments and faecal coliforms.<br />
15
<strong>Caboolture</strong> River Catchment<br />
5.1 <strong>Caboolture</strong> River Catchment<br />
5.1.1 Overview<br />
Overall, the estuarine reach of the <strong>Caboolture</strong> River had poor water quality (Figure 6). However,<br />
above the tidal limit three of the five sites had good ratings. The majority of sites monitored in Wararba<br />
Creek were found to have poor water quality, although the most upstream site had good water quality.<br />
<strong>Water</strong> quality at all sites in Sheepstation Creek was moderate or poor, with upstream sites being of<br />
lower quality than the downstream sites. <strong>Water</strong> quality at seven of the eight sites in Lagoon Creek was<br />
rated as poor; one site received a moderate rating.<br />
Figure 6. Final water quality assessments for the <strong>Caboolture</strong> River <strong>Region</strong> for the year 2000-2001. These ratings represent<br />
assessments based on water quality data for the period October 2000 to September 2001. The dots indicate the latest water<br />
quality assessment in comparison to the Queensland <strong>Water</strong> <strong>Quality</strong> Guidelines (green = good, yellow = moderate, red = poor,<br />
grey = insufficient data or median was detection limit which was greater than the guidelines).<br />
5.1.2 <strong>Caboolture</strong> River<br />
Overall, the estuarine reach of the <strong>Caboolture</strong> River had poor water quality, caused primarily by poor<br />
concentrations of dissolved oxygen, turbidity and nutrients. Above the tidal limit (between CAB-4 and<br />
CAB-5) three of the five sites had good ratings.<br />
Dissolved oxygen and pH values were generally lower than the guidelines in the mid reaches of the<br />
river, and clarity was poor through the same areas (Figure 7). Downstream of the South <strong>Caboolture</strong><br />
Wastewater Treatment Plant discharge (between CAB-4 and CAB-5) nutrient concentrations were<br />
above guideline values at most sites (Figure 8). However, nutrient concentrations reduced with<br />
distance downstream, and oxidised nitrogen and ammonia were within guidelines at the mouth of the<br />
river. Peak nutrient concentrations occurred at sites immediately upstream and downstream of the<br />
discharge from the sewage treatment plant. Chlorophyll-a followed the same pattern as nutrients, and<br />
concentrations exceeded guidelines at all sites other than the most upstream site (CAB-41). Similarly,<br />
upstream sites received good ratings for faecal coliforms, whereas sites further downstream were in<br />
only moderate condition (Table 7).<br />
16
<strong>Caboolture</strong> River Catchment<br />
Table 5. Results of water quality assessments for the <strong>Caboolture</strong> River <strong>Region</strong>, 2001. These ratings represent assessments<br />
based on water quality data for the period October 2000 to September 2001. The dots indicate the latest water quality<br />
assessment in comparison to the Queensland <strong>Water</strong> <strong>Quality</strong> Guidelines (green= good, yellow= moderate, red= poor, grey=<br />
insufficient data or median was detection limit which was greater than the guidelines). The arrows indicate trends in median<br />
concentrations over the last 3 years. The colour of the arrow indicates whether the water quality has improved (green) or<br />
deteriorated (red), and the direction of the arrow shows whether the median increased (up) or decreased (down). Double-ended<br />
arrows (black) indicate variable trends.<br />
Site<br />
<strong>Water</strong> Type<br />
Stream<br />
Source<br />
pH<br />
Conductivity<br />
Dissolved<br />
Oxygen<br />
Turbidity<br />
Secchi Depth<br />
Oxidised<br />
Nitrogen<br />
Ammonia<br />
Total Nitrogen<br />
Total<br />
Phosphorous<br />
Chlorophyll a<br />
Organic N<br />
FRP<br />
OVERALL<br />
CAB-1 UC <strong>Caboolture</strong> Rv CSC <br />
CAB-2 LC <strong>Caboolture</strong> Rv CSC <br />
CAB-3 LC <strong>Caboolture</strong> Rv CSC <br />
CAB-4 LC <strong>Caboolture</strong> Rv CSC <br />
CAB-5 ME <strong>Caboolture</strong> Rv CSC <br />
CAB-6 ME <strong>Caboolture</strong> Rv CSC <br />
CAB-7 ME <strong>Caboolture</strong> Rv CSC <br />
CAB-8 ME <strong>Caboolture</strong> Rv CSC <br />
Cab-0 ECLE <strong>Caboolture</strong> Rv EPA <br />
Cab-1.6 ME <strong>Caboolture</strong> Rv EPA <br />
Cab-4.8 ME <strong>Caboolture</strong> Rv EPA <br />
Cab-7.6 ME <strong>Caboolture</strong> Rv EPA <br />
Cab-9.5 ME <strong>Caboolture</strong> Rv EPA <br />
Cab-11.4 ME <strong>Caboolture</strong> Rv EPA <br />
Cab-13.4 ME <strong>Caboolture</strong> Rv EPA <br />
Cab-15.1 ME <strong>Caboolture</strong> Rv EPA <br />
Cab-17.1 UE <strong>Caboolture</strong> Rv EPA <br />
Cab-18.8 UE <strong>Caboolture</strong> Rv EPA <br />
Cab-19.9 UE <strong>Caboolture</strong> Rv EPA <br />
Cab-41 LC <strong>Caboolture</strong> Rv EPA <br />
LAG-1 LC Lagoon Ck CSC <br />
LAG-2 LC Lagoon Ck CSC <br />
LAG-3 LC Lagoon Ck CSC <br />
LAG-4 LC Lagoon Ck CSC <br />
LAG-5 LC Lagoon Ck CSC <br />
LAG-6 LC Lagoon Ck CSC <br />
LAG-7 LC Lagoon Ck CSC <br />
LAG-8 LC Lagoon Ck CSC <br />
SHE-1 LC Sheepstation Ck CSC <br />
SHE-2 LC Sheepstation Ck CSC <br />
SHE-3 LC Sheepstation Ck CSC <br />
SHE-4 LC Sheepstation Ck CSC <br />
WAR-1 LC Wararba Ck CSC <br />
WAR-2 LC Wararba Ck CSC <br />
WAR-3 LC Wararba Ck CSC <br />
WAR-4 LC Wararba Ck CSC <br />
WAR-5 LC Wararba Ck CSC <br />
WAR-6 LC Wararba Ck CSC <br />
War-0 LC Wararba Ck EPA <br />
17
<strong>Caboolture</strong> River Catchment<br />
Figure 7. Box plots of results for dissolved oxygen for sites in the <strong>Caboolture</strong> River. Refer to Appendix B,<br />
p. 54, for details on the interpretation of box plots.<br />
STP<br />
STP<br />
Weir<br />
Figure 8. Box plots of results for total nitrogen for sites in the <strong>Caboolture</strong> River. Refer to Appendix B, p.<br />
54, for details on the interpretation of box plots.<br />
Nutrient concentrations have increased over recent years at most estuarine sites (Table 5). An<br />
analysis of changes in water quality assessments suggested that at most sites between 4.8 km and<br />
17.1 km upstream, nitrogen (in all species) has increased (Table 5, Table 23). Some sites that had<br />
good water quality condition ratings for ammonia and total phosphorus in 2000 had poor condition<br />
ratings in 2001; this increase may represent a real increase in nutrient input to <strong>Caboolture</strong> River, or<br />
may be related to changes in laboratory techniques. The regression analysis of long-term trends<br />
indicated improving trends of secchi depth at many sites (Cab-1.6, Cab-7.6, Cab-15.1, Cab-18.8) and<br />
nutrients at sites near the river mouth since 1994. (For example, at site Cab-1.6 total phosphorus<br />
improved by 4% and ammonia by 21% annually; see Table 28 in Appendix F for full results).<br />
Regression analysis also indicated that pH has decreased at some of the estuarine sites since 1994,<br />
although the amount of change was small (Table 31, Appendix D).<br />
A comparison of water quality condition with previous years shows that most freshwater sites (CAB-<br />
1,2,3,4) have shown improvements in nutrients and that dissolved oxygen and turbidity have also<br />
improved at some sites (Table 5).<br />
The pattern of poor water quality at estuarine sites and better quality water at freshwater sites was<br />
also evident in a number of other physical indicators, including the size and integrity of riparian<br />
vegetation, reach environs, bank stability and channel diversity (Appendix, G, ANA, 1998; SoR, 2001).<br />
Similarly, some upstream sites in the <strong>Caboolture</strong> River have fish communities classed as being in<br />
18
<strong>Caboolture</strong> River Catchment<br />
Table 6. Concentrations of toxicants in sediments. The values shown are the measured values. For most sites samples were<br />
taken on two occasions. * indicates toxicants for which guidelines do not exist. For these toxicants ANZECC (2000)<br />
recommends comparisons be made to twice the value of the lowest value (in some cases the highest detection limit was<br />
considered the lowest value). Values marked green are less than the low-trigger level, yellow values are between the low and<br />
high-trigger level, and values marked red are high than the high trigger level.<br />
Site<br />
Date<br />
Arsenic<br />
Cadmium<br />
Chromium<br />
Copper<br />
Molybdenum<br />
Nickel<br />
Lead<br />
Zinc<br />
Mercury<br />
Selenium<br />
Total<br />
Petroleum<br />
Hydrocarbons<br />
SHE3<br />
SHE4<br />
06/07/2000
<strong>Caboolture</strong> River Catchment<br />
condition has remained fairly stable over recent years, although concentrations of oxidised nitrogen<br />
have improved at the more downstream sites (WAR4,5,6).<br />
The only site (WAR-2) to have an overall good water quality rating has also been found to have fish<br />
communities that are classed as being in reference condition (Langdon, 2001). Other sites further<br />
downstream, despite their poor water quality rating, had fish populations at moderate to sub-reference<br />
conditions. The size of the riparian vegetation was good throughout Wararba Creek, although the<br />
integrity was moderate to poor (Appendix G, ANA, 1998).<br />
Two of the six sites monitored on Wararba Creek received good ratings for faecal coliforms, whereas<br />
the other four received moderate ratings. Sorces of faecal contamination may include wild animals<br />
and domestic stock.<br />
5.1.4 Sheepstation Creek<br />
<strong>Water</strong> quality at all sites in Sheepstation Creek was rated as being in moderate or poor condition, with<br />
the more upstream sites being of poorer condition than the downstream sites. All sites had poor<br />
dissolved oxygen levels, the upstream sites had high levels of turbidity and total phosphorous, and all<br />
sites were rated as being in moderate condition for faecal coliforms. Analysis of changes in water<br />
quality assessments over recent years indicated a reduction in concentrations of oxidised nitrogen and<br />
total nitrogen at most sites, and a reduction in turbidity at downstream sites.<br />
Concentrations of toxicants at two sites in Sheepstation Creek were good (below trigger levels) for all<br />
toxicants, although lead concentrations were moderate at one site on one date, which may have<br />
originated from roadways given this site is in an urbanised area.<br />
Riparian vegetation, aquatic vegetation, reach environs and aquatic habitat are in poor or moderate<br />
condition at downstream sites, whereas these attributes are in moderate to good condition further<br />
upstream (SoR, 2001). Stream bed and bank stability have been classed as stable throughout<br />
Sheepstation Creek, and fish communities at two sites in the middle reaches of the creek have been<br />
classified as being degraded to severely degraded (SoR, 2001).<br />
5.1.5 Lagoon Creek<br />
<strong>Water</strong> quality at seven of the eight sites in Lagoon Creek was rated as poor; the remaining site<br />
received a moderate rating. All sites had low concentrations of dissolved oxygen, with lowest levels<br />
being recorded at the most downstream site. However, this site is a freshwater wetland and low<br />
dissolved oxygen and pH could be expected due to the accumulation of organic matter and limited<br />
water flow. Most sites also had high levels of turbidity and high concentrations of ammonia. Many sites<br />
showed an improvement in concentrations of oxidised nitrogen and total nitrogen in recent years, and<br />
some sites showed improvements in turbidity (Table 5). The regressions trend analysis also showed<br />
that other sites have reduced in condition with regard to turbidity, and that some sites have<br />
deteriorated with regard to dissolved oxygen and pH (Table 31).<br />
Most biological and physical indicators such as fish, riparian vegetation, reach environs, bank stability<br />
and bed and bar stability all increased in quality from downstream to upstream sites (Appendix, F, G;<br />
SoR, 2001; Langdon, 2001). However, aquatic habitat was moderate at downstream sites and<br />
decreased to poor at the more upstream sites; aquatic vegetation was poor throughout the creek<br />
(SoR, 2001).<br />
Sites LC6 and LC7 were had moderate concentrations of total petroleum hydrocarbons in the<br />
sediments (Table 6), which may be a consequence of their proximity to highways and main roads of<br />
the shire. Lead concentrations were moderate at one site on one occasion, and concentrations of all<br />
other toxicants were good at all other sites (Table 6). Most sites received good condition ratings for<br />
faecal coliforms, although sites LAG-5 and 6 received only moderate ratings.<br />
20
Burpengary Creek<br />
5.2 Burpengary Creek<br />
All sites in Burpengary Creek had poor water quality rating (Figure 9, Table 7). All sites had poor<br />
condition for dissolved oxygen, particularly sites adjacent to and downstream from the town of<br />
Burpengary (see medians, Table 28). All sites also had high concentrations of total phosphorous, and<br />
downstream sites had high concentrations of ammonia. Oxidised nitrogen concentrations (medians)<br />
have improved in recent years at most of the sites in Burpengary Creek (Table 9, Table 23). However,<br />
phosphorus ratings have deteriorated at two sites (BUR-3 and BUR-5).<br />
Figure 9. Final water quality assessments for the Burpengary Creek for the year 2000-2001. These ratings represent<br />
assessments based on water quality data for the period October 2000 to September 2001. The dots indicate the latest water<br />
quality assessment in comparison to the Queensland <strong>Water</strong> <strong>Quality</strong> Guidelines (green = good, yellow = moderate, red = poor,<br />
grey = insufficient data or median was detection limit which was greater than the guidelines).<br />
Faecal coliform concentrations were good at most sites, and moderate at two sites (BUR-5 and BUR-<br />
1). These sites are at the margins of the residential area and may be influenced by stormwater run-off<br />
from rural areas (Table 8).<br />
The condition of fish populations ranged from degraded to sub-reference, with the best sites located<br />
upstream of Burpengary. Two sites above and one adjacent to the town had fish populations that were<br />
in either a moderate or degraded condition (Appendix F, Langdon, 2001). These sites also have poor<br />
to moderate aquatic habitats (SoR, 2001). Aquatic vegetation and riparian vegetation also received<br />
very poor and moderate ratings respectively along the creek (SoR 2001, ANA, 2001)<br />
21
Burpengary Creek<br />
Table 8. <strong>Water</strong> quality assessments for the <strong>Caboolture</strong> River <strong>Region</strong>, 2001. These ratings represent assessments based on<br />
water quality data for the period October 2000 to September 2001. The dots indicate the latest water quality assessment in<br />
comparison to the Queensland <strong>Water</strong> <strong>Quality</strong> Guidelines (green= good, yellow= moderate, red= poor, grey= insufficient data or<br />
median was detection limit which was greater than the guidelines). The arrows indicate trends in median concentrations over<br />
the last 3 years. The colour of the arrow indicates whether the water quality has improved (green) or deteriorated (red), and the<br />
direction of the arrow shows whether the median increased (up) or decreased (down). Double-ended arrows (black) indicate<br />
variable trends.<br />
Site<br />
<strong>Water</strong> Type<br />
Stream<br />
Source<br />
pH<br />
Conductivity<br />
Dissolved<br />
Oxygen<br />
Turbidity<br />
Secchi Depth<br />
Oxidised<br />
Nitrogen<br />
Ammonia<br />
Total Nitrogen<br />
Total<br />
Phosphorous<br />
Chlorophyll a<br />
Organic N<br />
FRP<br />
FINAL<br />
BUR-1 ME Burpengary Ck CSC <br />
BUR-2 LC Burpengary Ck CSC <br />
BUR-3 LC Burpengary Ck CSC <br />
BUR-4 LC Burpengary Ck CSC <br />
BUR-5 LC Burpengary Ck CSC <br />
BUR-6 LC Burpengary Ck CSC <br />
Table 9. Median faecal coliform concentrations (CFU/100ml) from all samples collected since 1999. Green: low counts (median<br />
< 150 CFU/100ml); Yellow: moderate counts (median 150 - 1000 CFU/100ml); Red: High counts (median >1000 CFU/100ml).<br />
Site CFU /100 ml<br />
BUR-1 700<br />
BUR-2 62<br />
BUR-3 150<br />
BUR-4 82<br />
BUR-5 400<br />
BUR-6 104<br />
.<br />
22
Saltwater Creek<br />
5.3 Saltwater Creek<br />
Saltwater Creek runs through the main industrial area in <strong>Caboolture</strong> Shire and all sites had poor water<br />
quality (Figure 10, Table 9). However, two of these sites were located inside water retention structures<br />
and would therefore be expected to have poor water and sediment quality (see below). Dissolved<br />
oxygen was poor at all sites, and has been deteriorating over recent years (Table 10, 23). Turbidity<br />
was typically high at most sites, and both ammonia and total phosphorous were regularly above<br />
guideline values. Conductivity and pH were generally good (Table 10).<br />
Figure 10. Final water quality assessments for the Saltwater Creek for the year 2000-2001. These ratings represent<br />
assessments based on water quality data for the period October 2000 to September 2001. The dots indicate the latest water<br />
quality assessment in comparison to the Queensland <strong>Water</strong> <strong>Quality</strong> Guidelines (green = good, yellow = moderate, red = poor,<br />
grey = insufficient data or median was detection limit which was greater than the guidelines).<br />
The site (SAL-6) is within a retention structure and had poor water quality, with high nutrients, turbidity,<br />
conductivity, and high concentrations of toxicants in sediment (Tables 9 and 10). This retention<br />
structure traps stormwater run-off from adjacent timber yards, discharging the water directly to<br />
Saltwater Creek. The site adjacent this structure (SAL-7) had the highest median concentrations of<br />
ammonia, oxidised nitrogen and total phosphorous in the creek (Table 26, Appendix E). In recognition<br />
of the need to improve current environmental practices, local timber yard industry representatives, and<br />
state and local government agencies are presently reviewing current practices, and industry is<br />
implementing stormwater management programs.<br />
23
Saltwater Creek<br />
Table 10. <strong>Water</strong> quality assessments for Saltwater creek, 2001. These ratings represent assessments based on water quality<br />
data for the period October 2000 to September 2001. The dots indicate the latest water quality assessment in comparison to the<br />
Queensland <strong>Water</strong> <strong>Quality</strong> Guidelines (green= good, yellow= moderate, red= poor, grey= insufficient data or median was<br />
detection limit which was greater than the guidelines). The arrows indicate trends in median concentrations over the last 3<br />
years. The colour of the arrow indicates whether the water quality has improved (green) or deteriorated (red), and the direction<br />
of the arrow shows whether the median increased (up) or decreased (down). Double-ended arrows (black) indicate variable<br />
trends.<br />
Site<br />
<strong>Water</strong> Type<br />
Stream<br />
Source<br />
pH<br />
Conductivity<br />
Dissolved<br />
Oxygen<br />
Turbidity<br />
Secchi Depth<br />
Oxidised<br />
Nitrogen<br />
Ammonia<br />
Total Nitrogen<br />
Total<br />
Phosphorous<br />
Chlorophyll a<br />
Organic N<br />
FRP<br />
FINAL<br />
SAL-1 LC Saltwater Ck CSC <br />
SAL-2 LC Saltwater Ck CSC <br />
SAL-3 LC Saltwater Ck CSC <br />
SAL-4 LC Saltwater Ck CSC <br />
SAL-5 LC Saltwater Ck CSC <br />
SAL-6 LC Saltwater Ck CSC <br />
SAL-7 LC Saltwater Ck CSC <br />
SAL-8 LC Saltwater Ck CSC <br />
SAL-9 LC Saltwater Ck CSC <br />
The retention structure site also had poor sediment quality, with arsenic, chromium, copper, nickel,<br />
lead, zinc and mercury all above the ANZECC high trigger levels. In June 2000, the site adjacent to<br />
this retention structure recorded sediment toxicant concentrations similar to those recorded within the<br />
structure. In January 2001, the site upstream of the structure also recorded elevated sediment toxicant<br />
levels. However, this site is located at a stormwater discharge pipe and many of these metals have<br />
been previously linked to urban stormwater run-off (Moss and Costanzo, 1998). Both of these events<br />
were not detected in later sampling (Table 10). Concentrations of mercury, lead and zinc at some of<br />
the upstream sites were also found to be above the ANZECC low trigger levels<br />
Fish and macro-invertebrate studies have reported mixed results for Saltwater Creek. Macroinvertebrate<br />
investigations failed to indicate either good or poor water quality at all sites, other than at<br />
one of the more upstream sites, which was in good ecological condition (SCCMAP, 1999). The most<br />
abundant fish species at most sites was Gambusia holbrooki (mosquitofish), which is frequently<br />
associated with poorer water quality and degraded stream habitat. Native gudgeons (Hypseleotris<br />
spp.) dominated only one upstream site.<br />
The upstream section of Saltwater Creek (SC1-8) had moderate riparian vegetation integrity and the<br />
size was rated as good despite being situated in an industrial land-use area (Appendix G, ANA, 1998).<br />
In the residential areas downstream of SC8, the size and integrity of riparian vegetation were both<br />
good (Appendix G, ANA, 1998).<br />
Median concentrations of faecal coliforms were high at all sites within Saltwater Creek, except for the<br />
most upstream site (SAL-1; Table 11), which is located at the upstream margin of the industrial area.<br />
All sites downstream of SAL-1 had elevated concentrations of faecal contamination, indicating<br />
potential sources of faecal contamination from within the industrial area.<br />
24
Saltwater Creek<br />
Table 11. Concentrations of toxicants in sediments. The values shown are the measured values. For most sites samples were<br />
taken on two occasions. * indicates toxicants for which guidelines do not exist. For these toxicants ANZECC (2000)<br />
recommends comparisons be made to twice the value of the lowest value (in some cases the highest detection limit was<br />
considered the lowest value). Values marked green are less than the low-trigger level, yellow values are between the low and<br />
high-trigger level, and values marked red are high than the high trigger level.<br />
Site<br />
Date<br />
Arsenic<br />
Cadmium<br />
Chromium<br />
Copper<br />
Molybdenum<br />
Nickel<br />
Lead<br />
Zinc<br />
Mercury<br />
Selenium<br />
Total<br />
Petroleum<br />
Hydrocarbons<br />
SAL1<br />
SAL2<br />
SAL3<br />
SAL4<br />
SAL5<br />
SAL6<br />
SAL7<br />
SAL8<br />
SAL9<br />
29/06/2000
Deception <strong>Bay</strong><br />
5.4 Deception <strong>Bay</strong><br />
<strong>Water</strong> quality throughout Deception <strong>Bay</strong> was variable (Figure 11). Generally the sites closer to land<br />
had poorer water quality than those further from land. Conductivity was elevated at all sites, although<br />
in a marine environment such as this, this indicator does not accurately represent problems with<br />
salinity. Excluding conductivity, most sites rated good for all indicators, although sites close to the<br />
mouth of the <strong>Caboolture</strong> River (Dec-j,l) and close to the canals on the Redcliffe peninsula (Dec-u,y,x)<br />
had elevated concentrations of nutrients and in some cases chlorophyll-a. This likely reflects their<br />
proximity to the land-sourced influences entering Deception <strong>Bay</strong>.<br />
Figure 11: Final water quality assessments for the Deception <strong>Bay</strong> for the year 2000-2001. These ratings represent assessments<br />
based on water quality data for the period October 2000 to September 2001. The dots indicate the latest water quality<br />
assessment in comparison to the Queensland <strong>Water</strong> <strong>Quality</strong> Guidelines (green = good, yellow = moderate, red = poor, grey =<br />
insufficient data or median was detection limit which was greater than the guidelines).<br />
Many sites showed improvements in nitrogen (total and organic) and FRP (dissolved inorganic<br />
phosphorus with some particulate phosphorus) (Table 12, 23, 30). However total phosphorus,<br />
dissolved oxygen and chlorophyll-a concentrations have deteriorated over recent years at some sites<br />
(Table 13). The regression analysis of long-term trends indicated improving dissolved oxygen<br />
concentrations and secchi depth at the site Dec-m (Table 31, Appendix F), even though this site is<br />
close to the <strong>Caboolture</strong> River mouth.<br />
The Ecological Health Monitoring Program (EHMP) has detecting an increasing frequency of Lyngbya<br />
blooms in Deception <strong>Bay</strong> in recent years. This phytoplankton smothers mangrove roots and seagrass<br />
communities. The nuisance macro-algae Caulerpa taxifolia was also present in some areas of<br />
northern Deception <strong>Bay</strong>.<br />
26
Deception <strong>Bay</strong><br />
Table 13. <strong>Water</strong> quality assessments for Deception <strong>Bay</strong>. These ratings represent assessments based on water quality data for<br />
the period October 2000 to September 2001. The dots indicate the latest water quality assessment in comparison to the<br />
Queensland <strong>Water</strong> <strong>Quality</strong> Guidelines (green= good, yellow= moderate, red= poor, grey= insufficient data or median was<br />
detection limit which was greater than the guidelines). The arrows indicate trends in median concentrations of the last 3 years.<br />
The colour of the arrow indicates whether the water quality has improved (green) or deteriorated (red), and the direction of the<br />
arrow shows whether the median increased (up) or decreased (down). Double-ended arrows (black) indicate variable trends.<br />
Site<br />
<strong>Water</strong> Type<br />
Stream<br />
Source<br />
pH<br />
Conductivity<br />
Dissolved<br />
Oxygen<br />
Turbidity<br />
Secchi Depth<br />
Oxidised<br />
Nitrogen<br />
Ammonia<br />
Total<br />
Nitrogen<br />
Total<br />
Phosphorous<br />
Chlorophyll a<br />
Organic N<br />
FRP<br />
FINAL<br />
Dec-a ECLE Deception <strong>Bay</strong> EPA <br />
Dec-c ECLE Deception <strong>Bay</strong> EPA <br />
Dec-d ECLE Deception <strong>Bay</strong> EPA <br />
Dec-j ECLE Deception <strong>Bay</strong> EPA <br />
Dec-l ECLE Deception <strong>Bay</strong> EPA <br />
Dec-m ECLE Deception <strong>Bay</strong> EPA <br />
Dec-r ECLE Deception <strong>Bay</strong> EPA <br />
Dec-u ECLE Deception <strong>Bay</strong> EPA <br />
Dec-v ECLE Deception <strong>Bay</strong> EPA <br />
Dec-x ECLE Deception <strong>Bay</strong> EPA <br />
Dec-y ECLE Deception <strong>Bay</strong> EPA <br />
27
Bribie Island<br />
5.5 Bribie Island<br />
Overall, water quality on Bribie Island was moderate to poor, with only two sites out of sixteen rated as<br />
being in good condition (Figure 12). However, it is important to note that these assessments are based<br />
upon comparisons with water quality from natural reference waterways, and because canals are manmade<br />
waterways, it may not be appropriate to expect the water quality of natural waterway to be<br />
achievable.<br />
Saltwater Creek<br />
Hussey Creek<br />
# WE-a<br />
<strong>Water</strong> <strong>Quality</strong> Assessment<br />
# Good<br />
# Moderate<br />
# Poor<br />
<strong>Water</strong>ways<br />
2 0 2 4 Kilometres<br />
N<br />
Glass Mountain<br />
Creek<br />
# PV-a<br />
Bribie<br />
Island<br />
Bullock Creek<br />
Elimbah Creek<br />
Ningi Creek<br />
BRI-8 BRI-6<br />
#<br />
#<br />
#<br />
BRI-5<br />
#<br />
PH-b<br />
BRI-7<br />
# #<br />
##<br />
PH-a<br />
# BRI-4<br />
#<br />
BRI-3<br />
#<br />
BRI-2<br />
#<br />
BRI-1<br />
SHI-1<br />
# #<br />
###<br />
SHI-4<br />
SHI-3 SHI-2<br />
Figure 12. Final water quality assessments for Bribie Island for the year 2000-2001. These ratings represent assessments<br />
based on water quality data for the period October 2000 to September 2001. The dots indicate the latest water quality<br />
assessment in comparison to the Queensland <strong>Water</strong> <strong>Quality</strong> Guidelines (green = good, yellow = moderate, red = poor, grey =<br />
insufficient data or median was detection limit which was greater than the guidelines).<br />
The major differences between the Bribie Island sites and the guideline values, were low<br />
concentrations of dissolved oxygen and high concentrations of ammonia, especially in canal sites.<br />
One site in the entrance to Pacific Harbour and one site in Poverty Creek received an overall poor<br />
rating due to poor turbidity and secchi depth. Since the canals are mostly surrounded by residential<br />
development, the major influence on the water quality in the canals is likely to be stormwater run-off.<br />
Over recent years dissolved oxygen concentrations have decreased and conductivity has increased,<br />
although turbidity improved at many sites (Table 13, 23, 25). Sites in Shirley Creek have also shown<br />
improvements in both turbidity and pH in recent years.<br />
An analysis of water quality data taken at increasing depth from the surface indicated that the water<br />
was well-mixed and showed little evidence of depth stratification. There was some stratification for pH<br />
at the site BRI-1 in Pacific Harbour, where pH increased with increasing depth, and for dissolved<br />
oxygen at sites BRI-5 and BRI-6 in the Bribie Gardens Estate, where dissolved oxygen increased with<br />
depth (Figures 20, 21,22 in Appendix G). The shallow depth of the canals probably prevents<br />
stratification; the deepest water quality sample was taken at 3m.<br />
28
Bribie Island<br />
The size and integrity of riparian vegetation in the canal areas of Bribie Island was poor, and aquatic<br />
vegetation and channel diversity were both in poor condition (Appendix F, G, ANA, 1998; SoR, 2001).<br />
However, these results are likely to be typical of canal estates.<br />
Table 14. <strong>Water</strong> quality assessments for Bribie Island, 2001. These ratings represent assessments based on water quality data<br />
for the period October 2000 to September 2001. The dots indicate the latest water quality assessment in comparison to the<br />
Queensland <strong>Water</strong> <strong>Quality</strong> Guidelines (green= good, yellow= moderate, red= poor, grey= insufficient data or median was<br />
detection limit which was greater than the guidelines). The arrows indicate trends in median concentrations of the last 3 years.<br />
The colour of the arrow indicates whether the water quality has improved (green) or deteriorated (red), and the direction of the<br />
arrow shows whether the median increased (up) or decreased (down). Double-ended arrows (black) indicate variable trends.<br />
Site<br />
<strong>Water</strong> type<br />
Stream<br />
Source<br />
pH<br />
Conductivity<br />
Dissolved<br />
Oxygen<br />
Turbidity<br />
Secchi Depth<br />
Oxidised<br />
Nitrogen<br />
Ammonia<br />
Total Nitrogen<br />
Total<br />
Phosphorous<br />
Chlorophyll a<br />
FINAL<br />
BRI-1 ECLE Bribie Canals CSC <br />
BRI-2 ECLE Bribie Canals CSC <br />
BRI-3 ECLE Bribie Canals CSC <br />
BRI-4 LC Bribie Canals CSC <br />
BRI-5 ECLE Bribie Canals CSC <br />
BRI-6 ECLE Bribie Canals CSC <br />
BRI-7 ECLE Bribie Canals CSC <br />
BRI-8 ECLE Bribie Canals CSC <br />
SHI-1 UE Shirley Ck CSC <br />
SHI-2 UE Shirley Ck CSC <br />
SHI-3 ME Shirley Ck CSC <br />
SHI-4 ME Shirley Ck CSC <br />
PH-a ECLE Pacific Harbour PRCMP <br />
PH-b ECLE Pacific Harbour PRCMP <br />
PV-a ECLE Poverty Ck PRCMP <br />
WE-a ME Westaways Ck PRCMP <br />
Westaways Creek, at the northern end of the island had poor dissolved oxygen and moderate secchi<br />
depth readings, resulting in an overall moderate rating for the site. Despite this, studies of fish<br />
communities in this creek have found that stocks are in sub-reference conditions (Langdon, 2001).<br />
Faecal coliforms were generally low at all sites in the canal estates (Table 15). However, the median<br />
at the freshwater lagoon site (BRI-4) and sites in Shirley Creek were high. Faecal coliform<br />
contamination at these sites possibly arises from the high abundance of waterbirds that congregate at<br />
these sites, although at the freshwater lagoon sites, poor flushing and urban run-off may also be<br />
contributing factors.<br />
Table 15. Median faecal coliform concentrations (CFU/100ml) from all samples collected since 1999. Green: low counts (median<br />
< 150 CFU/100ml); Yellow: moderate counts (median 150 - 1000 CFU/100ml); Red: High counts (median >1000 CFU/100ml).<br />
Site CFU /100 ml Site CFU /100 ml<br />
BRI-1 29 BRI-7 15<br />
BRI-2 54 BRI-8 39<br />
BRI-3 75 SHI-1 300<br />
BRI-4 3100 SHI-2 1500<br />
BRI-5 58.5 SHI-3 2050<br />
BRI-6 12.5 SHI-4 1500<br />
29
Pumicestone Passage<br />
5.6 Pumicestone Passage<br />
Overall results of water quality assessments for Pumicestone Passage showed that water quality<br />
deteriorated with increasing distance from the opening of the passage to the ocean (Figure 13). At the<br />
northern end of the passage conductivity, turbidity and secchi depth were variable and at the southern<br />
end, turbidity and secchi depth were variable between sites (Table 16, Figures 14 and 15). Poor water<br />
quality ratings in the central area of the passage were due to high turbidity and poor secchi depth<br />
(Table 16). These patterns probably resulted from water exchange patterns in the Passage, whereby<br />
tidal water drains from approximately one-third the distance from the northern mouth of the Passage.<br />
The patterns of influence of terrestrial run-off in passage water quality are evident in Figures 14, 15).<br />
Concentrations of total phosphorus were good throughout the passage, however total nitrogen<br />
concentrations were high at most sites monitored (Table 16). All of these sites were close to the<br />
entrance of creeks into the passage.<br />
Figure 13. Final water quality assessments for Pumicestone Passage for the year 2000-2001. These ratings represent<br />
assessments based on water quality data for the period October 2000 to September 2001. The dots indicate the latest water<br />
quality assessment in comparison to the Queensland <strong>Water</strong> <strong>Quality</strong> Guidelines (green = good, yellow = moderate, red = poor,<br />
grey = insufficient data or median was detection limit which was greater than the guidelines).<br />
30
Pumicestone Passage<br />
Table 16. <strong>Water</strong> quality assessments for Pumicestone Passage (EPA sites 2001; PRCMP sites: 2000). The dots indicate the<br />
latest water quality assessment in comparison to the Queensland <strong>Water</strong> <strong>Quality</strong> Guidelines (green= good, yellow= moderate,<br />
red= poor, grey= insufficient data or median was detection limit which was greater than the guidelines). The arrows indicate<br />
trends in median concentrations over the last 3 years. The colour of the arrow indicates whether the water quality has improved<br />
(green) or deteriorated (red), and the direction of the arrow shows whether the median increased (up) or decreased (down).<br />
Double-ended arrows (black) indicate variable trends.<br />
Site<br />
<strong>Water</strong> Type<br />
Stream<br />
Source<br />
pH<br />
Conductivity<br />
Dissolved<br />
Oxygen<br />
Turbidity<br />
Pum-a ECLE P’stone Passage EPA <br />
Pum-b ECLE P’stone Passage EPA <br />
Pum-c ECLE P’stone Passage EPA <br />
Pum-d ECLE P’stone Passage EPA <br />
Pum-e ECLE P’stone Passage EPA <br />
Pum-f ECLE P’stone Passage EPA <br />
Pum-g ECLE P’stone Passage EPA <br />
Pum-h ECLE P’stone Passage EPA <br />
Pum-i ECLE P’stone Passage EPA <br />
Pum-j ECLE P’stone Passage EPA <br />
Pum-k ECLE P’stone Passage EPA <br />
Pum-l ECLE P’stone Passage EPA <br />
Pum-m ECLE P’stone Passage EPA <br />
PP-a ECLE P’stone Passage PRCMP <br />
PP-b ECLE P’stone Passage PRCMP <br />
PP-c ECLE P’stone Passage PRCMP <br />
PP-d ECLE P’stone Passage PRCMP <br />
PP-e ECLE P’stone Passage PRCMP <br />
PP-f ECLE P’stone Passage PRCMP <br />
PP-g ECLE P’stone Passage PRCMP <br />
PP-h ECLE Tripcony Bight PRCMP <br />
PP-i ECLE P’stone Passage PRCMP <br />
PP-j ECLE P’stone Passage PRCMP <br />
PP-k ECLE P’stone Passage PRCMP <br />
PP-l ECLE P’stone Passage PRCMP <br />
PP-m ECLE P’stone Passage PRCMP <br />
PP-n ECLE P’stone Passage PRCMP <br />
PP-o ECLE P’stone Passage PRCMP <br />
PP-p ECLE Shirley Creek PRCMP <br />
PP-q ECLE P’stone Passage PRCMP <br />
Secchi Depth<br />
Oxidised<br />
Nitrogen<br />
Ammonia<br />
Total Nitrogen<br />
Total<br />
Phosphorous<br />
Chlorophyll a<br />
Organic N<br />
FRP<br />
FINAL<br />
31
Pumicestone Passage<br />
Figure 14. Box plots of results for conductivity in sites in Pumicestone Passage<br />
Figure 15. Box plots of results for secchi depth for sites in Pumicestone Passage<br />
Many sites have moderate or poor turbidity and/or secchi depth, and analysis of changes in water<br />
quality assessment for these indicators suggest that they have deteriorated over recent years (Table<br />
16, 23). The regression analysis of long-term trends indicated many improving and some deteriorating<br />
trends at many sites within the Passage (Table 31, Appendix F). For example, dissolved oxygen and<br />
secchi depth showed significant improvements at many sites (Pum-b, c, d, e, f, g, h, i, l, m), and<br />
nutrients improved at Pum-d (ammonia by 16% per year and FRP by 10% per year), which is in the<br />
northern Passage between the Bells and Coochin Creek mouths. At Pum-k, in the southern Passage<br />
between Elimbah and Ningi Creek mouths, ammonia showed significant improvements (~25%<br />
annually), although organic nitrogen concentrations increased (~10% annually)(Table 31)<br />
.<br />
32
Northern Creeks<br />
5.7 Northern Creeks<br />
5.7.1 Overview<br />
Overall water quality was variable throughout the Northern Creeks (Figure 16, Table 17). Most<br />
indicators were comparable to values for reference creeks in south-east Queensland, however low<br />
concentrations of dissolved oxygen and low pH resulted in poor water quality ratings for some<br />
waterways (Table 17). However, the Northern Creeks contain tannin stained waters due to dissolved<br />
organic matter. This dissolved organic matter releases humic acid and generates naturally low pH<br />
levels for these water types (<strong>Bay</strong>ly, 1966). Nitrogen concentrations were high at some sites throughout<br />
the Northern Creeks area (Table 17).<br />
Figure 16. Final water quality assessments for Northern Creeks for the year 2000-2001. These ratings represent assessments<br />
based on water quality data for the period October 2000 to September 2001. The dots indicate the latest water quality<br />
assessment in comparison to the Queensland <strong>Water</strong> <strong>Quality</strong> Guidelines (green = good, yellow = moderate, red = poor, grey =<br />
insufficient data or median was detection limit which was greater than the guidelines).<br />
33
Northern Creeks<br />
Table 17. <strong>Water</strong> quality assessments for the Northern Creeks, 2000. The dots indicate the latest water quality assessment in<br />
comparison to the Queensland <strong>Water</strong> <strong>Quality</strong> Guidelines (green= good, yellow= moderate, red= poor, grey= insufficient data or<br />
median was detection limit which was greater than the guidelines). The arrows indicate trends in median concentrations over<br />
the last 3 years. The colour of the arrow indicates whether the water quality has improved (green) or deteriorated (red), and the<br />
direction of the arrow shows whether the median increased (up) or decreased (down). Double-ended arrows (black) indicate<br />
variable trends.<br />
Site<br />
<strong>Water</strong> Type<br />
Stream<br />
Source<br />
pH<br />
Conductivity<br />
Dissolved<br />
Oxygen<br />
Turbidity<br />
Secchi Depth<br />
Oxidised<br />
Nitrogen<br />
Ammonia<br />
Total Nitrogen<br />
Total<br />
Phosphorous<br />
Filterable<br />
Reactive<br />
Phosphorous<br />
FINAL<br />
BE-a ECLE Bells Ck. PRCMP <br />
BE-b ME Bells Ck. PRCMP <br />
BE-c ME Bells Ck. PRCMP <br />
BE-d ME Bells Ck. PRCMP <br />
BE-e ME Bells Ck. PRCMP <br />
BE-f ME Bells Ck. PRCMP <br />
BU-a ECLE Bullock Ck. PRCMP <br />
BU-b ME Bullock Ck. PRCMP <br />
BU-c ME Bullock Ck. PRCMP <br />
BU-d ME Bullock Ck. PRCMP <br />
CO-a ME Coochin Ck. PRCMP <br />
CO-b ME Coochin Ck. PRCMP <br />
CO-c ME Coochin Ck. PRCMP <br />
EL-a ME Elimbah Ck. PRCMP <br />
EL-b ME Elimbah Ck. PRCMP <br />
EL-c ME Elimbah Ck. PRCMP <br />
EL-d ME Elimbah Ck. PRCMP <br />
EL-e UE Elimbah Ck. PRCMP <br />
EL-f UE Elimbah Ck. PRCMP <br />
GM-a ME Glass Mtn Ck. PRCMP <br />
GM-b ME Glass Mtn Ck. PRCMP <br />
HU-a ME Hussey Ck. PRCMP <br />
HU-b ME Hussey Ck. PRCMP <br />
LC-a ECLE Lamerough Canal PRCMP <br />
ML-b ME Mellum Ck. PRCMP <br />
NG-a ECLE Ningi Ck. PRCMP <br />
NG-b ME Ningi Ck. PRCMP <br />
NG-c ME Ningi Ck. PRCMP <br />
SW-a ME Saltwater Ck. PRCMP <br />
SW-b ME Saltwater Ck. PRCMP <br />
34
Northern Creeks<br />
5.7.2 Lamerough Canals<br />
<strong>Water</strong> quality at the one site in Lamerough Canals was within all guideline values and has remained<br />
consistently good over recent years. Overall, the site had good water quality. This may be due in part<br />
to its proximity to oceanic waters.<br />
5.7.3 Bells Creek<br />
Overall, Bells Creek had moderate water quality, due primarily to low dissolved oxygen concentrations<br />
and low pH, which are likely to be normal for these creeks. Excluding dissolved oxygen and pH, all<br />
indicators were in good condition at all sites, with the exception of total nitrogen concentrations, which<br />
were elevated at the two sites monitored (BE-a and BE-f). In this case the total nitrogen probably<br />
represents organic nitrogen (ammonia and oxidised nitrogen concentrations were within guidelines)<br />
and may indicate large amounts of decaying organic matter such as vegetation debris.<br />
The water quality assessments have remained stable for most indicators at most sites (Table 16).<br />
However the regression analyses of long-term trends detected improvements in secchi depth at BE-a<br />
(9.3% per year since 1997) (Table 31, Appendix F).<br />
In terms of the condition of physical attributes of the Bells Creek, the most upstream site (BE-f)<br />
appeared to be more degraded, with unstable banks, general erosion, low channel diversity, very poor<br />
riparian and aquatic vegetation and poor aquatic habitat (SoR, 2001). Fish communities have also<br />
been found to be degraded in this upstream site (Appendix F, Langdon, 2001).<br />
5.7.4 Coochin and Mellum Creeks<br />
Coochin and Mellum Creeks had poor overall water quality with the exception of one site (CO-b)<br />
(Figure 16, Table 17). Although dissolved oxygen and pH were low, which is expected of these types<br />
of creeks, concentrations of total nitrogen were high, causing the poor water quality. Both oxidised<br />
nitrogen and ammonia concentrations were above guideline values. The sources if nitrogen may<br />
include agriculture and urban run-off from adjacent areas.<br />
Fish communities upstream of the Mellum Creek site are in a degraded state (Appendix F, Langdon,<br />
2001), and channel diversity, aquatic vegetation and aquatic habitat are also very poor in this area<br />
(SoR, 2001). The poor ecological health may reflect the surrounding land-uses that involve clearing<br />
and logging (SoR, 2001).<br />
5.7.5 Coonowrin/Saltwater Creek<br />
Saltwater Creek had poor water quality at the downstream site (SW-a) (Table 17) and good water<br />
quality at the upstream site (SW-b, although fewer indicators were monitored). The poor water quality<br />
was caused by poor water clarity and elevated concentrations of nitrogen.<br />
5.7.6 Hussey Creek<br />
<strong>Water</strong> quality in Hussey Creek was moderate. Apart from low dissolved oxygen values, which are<br />
probably normal, concentrations of nitrogen were elevated at the one site monitored (Table 17). The<br />
condition of aquatic vegetation (very poor), riparian vegetation (poor) and channel diversity (very low)<br />
indicate, however, that the creek is more impacted than suggested by the water quality analysis (SoR,<br />
2001).<br />
5.7.7 Glass Mountain Creek<br />
Both sites monitored in Glass Mountain Creek had poor water quality. The primary causes for these<br />
poor ratings were poor water clarity at both sites and elevated nitrogen concentrations at GM-a.<br />
Riparian vegetation and vegetation in surrounding areas were good in the lower catchment, however<br />
the condition of in-stream vegetation and in-stream habitats were only moderate (SoR, 2001).<br />
35
Northern Creeks<br />
5.7.8 Bullock Creek<br />
Final water quality ratings were variable for sites in Bullock Creek. <strong>Water</strong> clarity was moderate to poor<br />
at all sites, and deteriorating over recent years at BU-d. Turbidity at the most upstream site (BU-d)<br />
was very high, although the box plots show that this assessment is based on a small sample size<br />
(Figure 4d, Appendix E). Nutrient concentrations were good at the three sites monitored, with the<br />
exception of elevated total nitrogen (probably from decaying organic matter() at BU-a.<br />
5.7.9 Elimbah Creek<br />
Elimbah Creek has a number of potential pollutant sources in its catchment, including extensive pine<br />
plantations, turf farm and a poultry farm. Despite this, water quality remained good throughout the<br />
creek. Dissolved oxygen concentrations and pH were both low at the upstream sites, but this is<br />
probably normal for these creeks.<br />
Other studies at upstream sites have found that Elimbah Creek had high concentrations of dissolved<br />
constituents and high iron concentrations, both of which could be related to the natural lithography of<br />
the area (Cullen, 2000). High aluminium concentrations have also been detected, although no source<br />
has been identified (Cullen, 2000). Most other biological and physical indicators have been<br />
categorised as moderate (including riparian vegetation, fish communities, macro-invertebrate<br />
communities, reach environs and aquatic habitats) (SoR, 2001; Langdon, 2001). Aquatic vegetation<br />
and channel diversity, however, have been rated as very poor (SoR, 2001).<br />
Figure 17. Box plot of pH in Elimbah Creek, showing that further from the mouth of the creek, pH is lower, because flushing with<br />
oceanic water from Pumicestone Passage is poorer.<br />
5.7.10 Ningi Creek<br />
<strong>Water</strong> quality in Ningi Creek varied from good to good, although all sites had low dissolved oxygen<br />
and the most upstream site had low pH. Poor water quality was caused by elevated concentrations of<br />
nitrogen, due in part to increased inputs of organic nitrogen probably from decaying organic matter.<br />
Despite Ningi Creek being classified poor by the SoR (2001), riparian vegetation was in good<br />
condition in the lower reaches and moderate condition in the upper reaches (Appendix G, ANA, 1998).<br />
However, aquatic vegetation, channel diversity and bed stability have been classified as very poor,<br />
very low and unstable respectively (SoR, 2001)<br />
.<br />
36
<strong>Caboolture</strong> <strong>Water</strong> <strong>Quality</strong> <strong>Study</strong><br />
6.0 CONCLUDING REMARKS<br />
Variable patterns of water quality condition were resolved throughout the <strong>Caboolture</strong> region, including<br />
variation in patterns of long-term trends over time. However, results suggest that more developed<br />
(settled) areas, and some sites in agriculture areas, show evidence of deterioration in water quality.<br />
Values for pH and dissolved oxygen were below reference values for the Northern Creeks. However,<br />
these creeks are dystrophic systems, which are characterised by naturally low concentrations of these<br />
indicators. Reference values for pH and dissolved oxygen for these water types need to be<br />
determined to ensure that water quality can be assessed against guidelines that reflect “natural”<br />
conditions more adequately.<br />
The heavily industrialised areas had high concentrations of some toxicants in sediments and some<br />
sites in close proximity to highways and major roads had elevated concentrations of total petroleum<br />
hydrocarbons and lead in the sediments.<br />
Faecal contamination was evident near some industrial sites and in canal developments, the latter<br />
probably due to poor flushing, urban run-off and inputs from congregations of waterbirds. Despite<br />
being suggestive of faecal contamination in Saltwater Creek and in some canals on Bribie Island,<br />
these results were not derived from a sampling regime recommended by the National Guidelines<br />
(ANZECC & ARMCANZ, 2000) and were therefore not directly comparable with the guidelines.<br />
Overall, water quality, sediment and faecal coliform monitoring has resolved important trends in the<br />
ecological condition of major waterways in the <strong>Caboolture</strong> region, and has highlighted “hotspots”<br />
which present opportunities for management intervention to improve water quality.<br />
37
<strong>Caboolture</strong> <strong>Water</strong> <strong>Quality</strong> <strong>Study</strong><br />
REFERENCES<br />
<strong>Bay</strong>ly, I.A.E. (1966) Queensland’s Coastal Dune Lakes and their Life. Wildlife Australia 3: 154 – 157.<br />
Cullen, E. L. (2000). Surface <strong>Water</strong> <strong>Quality</strong> of the Freshwater section of Elimbah Creek, Pumicestone<br />
Passage. Hons Thesis, School of Natural Resource Sciences. Queensland University of Technology.<br />
EPA (2001) Draft Queensland <strong>Water</strong> <strong>Quality</strong> Guidelines (version 2), Queensland Environmental<br />
Protection Agency, Brisbane.<br />
Langdon, S. (2001). Prioritising stream regeneration works to protect and restore fish habitat NHT<br />
project - Progress report. CSC/Griffith Uni.<br />
SoR (2001). State of the Rivers: Pumicestone <strong>Region</strong> Subcatchments. Prepared by Eberhard, R. and<br />
van Manen, N. Department of Natural Resources and Mines. Natural Resource Sciences, Brisbane.<br />
Burgess, R., Tapsall, A., Juniper, M., Morton, R. (1998). Atlas of Natural Assets, Riparian and<br />
Reserve Vegetation. Report prepared by WBM Oceanics Australia for <strong>Caboolture</strong> Shire Council.<br />
SCCMAP. (1999). Saltwater Creek Catchment Management Plan. Volume 1. Prepared by Geo-End<br />
Australia, Willing & Partners and Natural Resource Assessments for Pine Rivers Shire Council,<br />
<strong>Caboolture</strong> Shire Council and Redcliffe City Council.<br />
38
<strong>Caboolture</strong> <strong>Water</strong> <strong>Quality</strong> <strong>Study</strong><br />
APPENDICES<br />
Appendix A: <strong>Water</strong> quality monitoring programs, sites and indicators<br />
Table 18. Indicators assessed at the sites monitored by the <strong>Caboolture</strong> Shire Council’s Environmental Monitoring Program.<br />
Physico-chemical parameters include dissolved oxygen, conductivity, turbidity, temperature, pH. Various species of nutrients<br />
were monitored at different sites.<br />
Report<br />
site name<br />
CSC site<br />
code<br />
Stream<br />
Start of<br />
monitoring<br />
Physicochemical<br />
Nutrients<br />
Secchi Chlorophyll-a<br />
Toxicants in<br />
sediments<br />
BRI-1 C1 Pacific Harbour Canals 1/1999 <br />
BRI-2 C2 Pacific Harbour Canals 1/1999 <br />
BRI-3 C3 Pacific Harbour Canals 1/1999 <br />
BRI-4 C4 Lagoon 1/1999 <br />
BRI-5 C5 Bribie Gardens 1/1999 <br />
BRI-6 C6 Bribie Gardens 1/1999 <br />
BRI-7 C7 Bribie Gardens 1/1999 <br />
BRI-8 C8 Bribie Gardens 1/1999 <br />
SHI-1 S1 Shirley Ck 1/1999 <br />
SHI-2 S2 Shirley Ck 1/1999 <br />
SHI-3 S3 Shirley Ck 1/1999 <br />
SHI-4 S4 Shirley Ck 1/1999 <br />
BUR-1 BC1 Burpengary Ck 3/2000 <br />
BUR-2 BC2 Burpengary Ck 3/2000 <br />
BUR-3 BC3 Burpengary Ck 3/2000 <br />
BUR-4 BC4 Burpengary Ck 3/2000 <br />
BUR-5 BC5 Burpengary Ck 3/2000 <br />
BUR-6 BC6 Burpengary Ck 1/2001 <br />
CAB-1 CBa <strong>Caboolture</strong> Rv 2/1999 <br />
CAB-3 CBb <strong>Caboolture</strong> Rv 2/1999 <br />
CAB-4 CBc <strong>Caboolture</strong> Rv 2/1999 <br />
CAB-2 CBd <strong>Caboolture</strong> Rv 2/1999 <br />
CAB-8 1R <strong>Caboolture</strong> Rv 3/1999 <br />
CAB-7 2C <strong>Caboolture</strong> Rv 3/1999 <br />
CAB-6 3S <strong>Caboolture</strong> Rv 3/1999 <br />
CAB-5 4D <strong>Caboolture</strong> Rv 3/1999 <br />
LAG-1 LC1 Lagoon Ck 3/1999 <br />
LAG-2 LC2 Lagoon Ck 3/1999 <br />
LAG-3 LC3 Lagoon Ck 3/1999 <br />
LAG-4 LC4 Lagoon Ck 3/1999 <br />
LAG-5 LC5 Lagoon Ck 3/1999 <br />
LAG-6 LC6 Lagoon Ck 3/1999 <br />
LAG-7 LC7 Lagoon Ck 3/1999 <br />
LAG-8 LC8 Lagoon Ck 3/1999 <br />
SAL-1 SC1 Saltwater Ck 3/1999 <br />
SAL-2 SC2 Saltwater Ck 3/1999 <br />
SAL-3 SC3 Saltwater Ck 3/1999 <br />
SAL-4 SC4 Saltwater Ck 3/1999 <br />
SAL-5 SC5 Saltwater Ck 3/1999 <br />
SAL-6 SC6 Saltwater Ck 3/1999 <br />
SAL-7 SC7 Saltwater Ck 3/1999 <br />
SAL-8 SC8 Saltwater Ck 3/1999 <br />
SAL-9 SC9 Saltwater Ck 3/1999 <br />
SHE-1 SSC1 Sheepstation Ck 1/1999 <br />
SHE-2 SSC2 Sheepstation Ck 1/1999 <br />
SHE-3 SSC3 Sheepstation Ck 1/1999 <br />
SHE-4 SSC4 Sheepstation Ck 1/1999 <br />
WAR-1 W1 Wararba Ck 2/2000 <br />
WAR-2 W2 Wararba Ck 2/2000 <br />
WAR-3 W3 Wararba Ck 2/2000 <br />
WAR-4 W4 Wararba Ck 2/2000 <br />
WAR-5 W5 Wararba Ck 2/2000 <br />
WAR-6 W6 Wararba Ck 2/1999 <br />
39
<strong>Caboolture</strong> <strong>Water</strong> <strong>Quality</strong> <strong>Study</strong><br />
Table 19. Indicators assessed at the sites monitored by the Queensland Environmental Protection Agency. Physico-chemical<br />
parameters include dissolved oxygen, conductivity, turbidity, temperature, pH. Various species of nutrients were monitored at<br />
different sites.<br />
Report site<br />
name<br />
Stream<br />
Commencement of<br />
monitoring reported<br />
herein<br />
Physicochemical<br />
Nutrients Secchi Chlorophyll-a<br />
Cab-0 <strong>Caboolture</strong> Rv 3/2000 <br />
Cab-1.0 <strong>Caboolture</strong> Rv 3/2000 <br />
Cab-1.6 <strong>Caboolture</strong> Rv 1/1995 <br />
Cab-4.8 <strong>Caboolture</strong> Rv 3/2000 <br />
Cab-7.6 <strong>Caboolture</strong> Rv 1/1995 <br />
Cab-9.5 <strong>Caboolture</strong> Rv 3/2000 <br />
Cab-11.4 <strong>Caboolture</strong> Rv 3/2000 <br />
Cab-13.4 <strong>Caboolture</strong> Rv 3/2000 <br />
Cab-15.1 <strong>Caboolture</strong> Rv 1/1995 <br />
Cab-17.1 <strong>Caboolture</strong> Rv 3/2000 <br />
Cab-18.8 <strong>Caboolture</strong> Rv 1/1995 <br />
Cab-19.9 <strong>Caboolture</strong> Rv 3/2000 <br />
Cab-41 <strong>Caboolture</strong> Rv 3/2000 <br />
Dec-a Deception <strong>Bay</strong> 3/2000 <br />
Dec-b Deception <strong>Bay</strong> 3/2000 <br />
Dec-c Deception <strong>Bay</strong> 3/2000 <br />
Dec-d Deception <strong>Bay</strong> 3/2000 <br />
Dec-e Deception <strong>Bay</strong> 3/2000 <br />
Dec-f Deception <strong>Bay</strong> 3/2000 <br />
Dec-g Deception <strong>Bay</strong> 3/2000 <br />
Dec-h Deception <strong>Bay</strong> 3/2000 <br />
Dec-i Deception <strong>Bay</strong> 3/2000 <br />
Dec-j Deception <strong>Bay</strong> 3/2000 <br />
Dec-k Deception <strong>Bay</strong> 3/2000 <br />
Dec-l Deception <strong>Bay</strong> 3/2000 <br />
Dec-m Deception <strong>Bay</strong> 1/1995 <br />
Dec-n Deception <strong>Bay</strong> 3/2000 <br />
Dec-o Deception <strong>Bay</strong> 3/2000 <br />
Dec-p Deception <strong>Bay</strong> 3/2000 <br />
Dec-q Deception <strong>Bay</strong> 3/2000 <br />
Dec-r Deception <strong>Bay</strong> 3/2000 <br />
Dec-s Deception <strong>Bay</strong> 3/2000 <br />
Dec-t Deception <strong>Bay</strong> 3/2000 <br />
Dec-u Deception <strong>Bay</strong> 3/2000 <br />
Dec-v Deception <strong>Bay</strong> 3/2000 <br />
Dec-w Deception <strong>Bay</strong> 3/2000 <br />
Dec-x Deception <strong>Bay</strong> 3/2000 <br />
Dec-y Deception <strong>Bay</strong> 3/2000 <br />
Dec-z Deception <strong>Bay</strong> 3/2000 <br />
Pum-a Pumicestone 1/1995 <br />
Pum-b Pumicestone 1/1995 <br />
Pum-c Pumicestone 1/1995 <br />
Pum-d Pumicestone 1/1995 <br />
Pum-e Pumicestone 1/1995 <br />
Pum-f Pumicestone 1/1995 <br />
Pum-g Pumicestone 1/1995 <br />
Pum-h Pumicestone 1/1995 <br />
Pum-i Pumicestone 1/1995 <br />
Pum-j Pumicestone 1/1995 <br />
Pum-k Pumicestone 1/1995 <br />
Pum-l Pumicestone 1/1995 <br />
Pum-m Pumicestone 1/1995 <br />
War-0 Wararba Ck 3/2000 <br />
War-2.0 Wararba Ck 3/2000 <br />
40
<strong>Caboolture</strong> <strong>Water</strong> <strong>Quality</strong> <strong>Study</strong><br />
Table 20. Indicators assessed at the sites monitored by the Pumicestone Catchment Coordination Association (PRCMP).<br />
Physico-chemical parameters include dissolved oxygen, conductivity, turbidity, temperature, pH. Various nutrients were<br />
monitored at different sites.<br />
Report site<br />
name<br />
Stream<br />
Commencement of<br />
monitoring reported<br />
herein<br />
Physicochemical<br />
Secchi<br />
Nutrients<br />
BE-a Bells Ck. 12/2000 <br />
BE-b Bells Ck. 4/1998 <br />
BE-c Bells Ck. 12/2000 <br />
BE-d Bells Ck. 2/1998 <br />
BE-e Bells Ck. 6/1998 <br />
BE-f Bells Ck. 2/1998 <br />
BU-a Bullock Ck. 12/2000 <br />
BU-b Bullock Ck. 4/1998 <br />
BU-c Bullock Ck. 12/2000 <br />
BU-d Bullock Ck. 4/1998 <br />
CO-a Coochin Ck. 10/1997 <br />
CO-b Coochin Ck. 10/1997 <br />
CO-c Coochin Ck. 10/1997 <br />
CO-d Coochin Ck. 10/1997 <br />
EL-a Elimbah Ck. 2/2000 <br />
EL-b Elimbah Ck. 1/1998 <br />
EL-c Elimbah Ck. 1/1998 <br />
EL-d Elimbah Ck. 1/1998 <br />
EL-e Elimbah Ck. 1/1998 <br />
EL-f Elimbah Ck. 1/1998 <br />
EL-g Elimbah Ck. 2/1999 <br />
GM-a Glass Mountain Ck. 12/2000 <br />
GM-b Glass Mountain Ck. 10/1997 <br />
HU-a Hussey Ck. 4/1998 <br />
HU-b Hussey Ck. 10/1997 <br />
HU-c Hussey Ck. 10/1997 <br />
LC-a Lamerough Canal 2/1998 <br />
ML-a Mellum Ck. 6/1998 <br />
ML-b Mellum Ck. 6/1998 <br />
ML-c Mellum Ck. 1/1998 <br />
NG-a Ningi Ck. 12/2000 <br />
NG-b Ningi Ck. 4/1998 <br />
NG-c Ningi Ck. 2/1998 <br />
PH-a Pacific Harbour 6/1998 <br />
PH-b Pacific Harbour 6/1998 <br />
PP-a Pumicestone 6/1998 <br />
PP-b Pumicestone 10/1997 <br />
PP-c Pumicestone 10/1997 <br />
PP-d Pumicestone 10/1997 <br />
PP-e Pumicestone 10/1997 <br />
PP-f Pumicestone 10/1997 <br />
PP-g Pumicestone 10/1997 <br />
PP-h Tripcony Bight 10/1997 <br />
PP-i Pumicestone 10/1997 <br />
PP-j Pumicestone 10/1997 <br />
PP-k Pumicestone 12/2000 <br />
PP-l Pumicestone 10/1997 <br />
PP-m Pumicestone 12/2000 <br />
PP-n Pumicestone 10/1997 <br />
PP-o Pumicestone 10/1997 <br />
PP-p Shirley Ck. 6/1998 <br />
PP-q Pumicestone 10/1997 <br />
PV-a Poverty Ck. 12/1999 <br />
PV-b Poverty Ck. 6/1998<br />
SW-a Saltwater Ck. 8/1999 <br />
SW-b Saltwater Ck. 1/1998<br />
WE-a Westaways Ck. 6/1998 <br />
41
<strong>Caboolture</strong> <strong>Water</strong> <strong>Quality</strong> <strong>Study</strong><br />
Table 21. Sites monitored by all agencies including geographic basin information, stream information and geographical<br />
locations.<br />
Report<br />
site name<br />
CSC/PRCMP<br />
Code<br />
Source Basin Basin Name Stream Stream Name Latitude Longitude<br />
CAB-8 1R CSC 142 PINE RIVER 10 <strong>Caboolture</strong> Rv -27.10568 153.01180<br />
CAB-7 2C CSC 142 PINE RIVER 10 <strong>Caboolture</strong> Rv -27.09112 152.97492<br />
CAB-6 3S CSC 142 PINE RIVER 10 <strong>Caboolture</strong> Rv -27.09498 152.97010<br />
CAB-5 4D CSC 142 PINE RIVER 10 <strong>Caboolture</strong> Rv -27.09110 152.96320<br />
BUR-1 BC1 CSC 142 PINE RIVER 11 Burpengary Ck -27.15170 153.00955<br />
BUR-2 BC2 CSC 142 PINE RIVER 11 Burpengary Ck -27.15270 152.95553<br />
BUR-3 BC3 CSC 142 PINE RIVER 11 Burpengary Ck -27.16112 152.95400<br />
BUR-4 BC4 CSC 142 PINE RIVER 11 Burpengary Ck -27.16540 152.94098<br />
BUR-5 BC5 CSC 142 PINE RIVER 11 Burpengary Ck -27.17545 152.92210<br />
BUR-6 BC6 CSC 142 PINE RIVER 11 Burpengary Ck -27.16342 152.87610<br />
BRI-1 C1 CSC 141 MAROOCHY RIVER 65 Bribie Canals -27.07188 153.15688<br />
BRI-2 C2 CSC 141 MAROOCHY RIVER 65 Bribie Canals -27.06982 153.15778<br />
BRI-3 C3 CSC 141 MAROOCHY RIVER 65 Bribie Canals -27.06768 153.16672<br />
BRI-4 C4 CSC 141 MAROOCHY RIVER 65 Bribie Canals -27.06253 153.14985<br />
BRI-5 C5 CSC 141 MAROOCHY RIVER 65 Bribie Canals -27.04068 153.14233<br />
BRI-6 C6 CSC 141 MAROOCHY RIVER 65 Bribie Canals -27.03918 153.13858<br />
BRI-7 C7 CSC 141 MAROOCHY RIVER 65 Bribie Canals -27.04535 153.13978<br />
BRI-8 C8 CSC 141 MAROOCHY RIVER 65 Bribie Canals -27.04103 153.13168<br />
CAB-1 CBa CSC 142 PINE RIVER 10 <strong>Caboolture</strong> Rv -27.09597 152.83473<br />
CAB-3 CBb CSC 142 PINE RIVER 10 <strong>Caboolture</strong> Rv -27.10985 152.88523<br />
CAB-4 CBc CSC 142 PINE RIVER 10 <strong>Caboolture</strong> Rv -27.08850 152.93892<br />
CAB-2 CBd CSC 142 PINE RIVER 10 <strong>Caboolture</strong> Rv -27.12200 152.85827<br />
LAG-1 LC1 CSC 142 PINE RIVER 51 Lagoon Ck -27.00512 152.85075<br />
LAG-2 LC2 CSC 142 PINE RIVER 51 Lagoon Ck -27.02483 152.87028<br />
LAG-3 LC3 CSC 142 PINE RIVER 51 Lagoon Ck -27.05083 152.91232<br />
LAG-4 LC4 CSC 142 PINE RIVER 51 Lagoon Ck -27.06637 152.94467<br />
LAG-5 LC5 CSC 142 PINE RIVER 51 Lagoon Ck -27.07512 152.95032<br />
LAG-6 LC6 CSC 142 PINE RIVER 51 Lagoon Ck -27.06833 152.96292<br />
LAG-7 LC7 CSC 142 PINE RIVER 51 Lagoon Ck -27.06467 152.97768<br />
LAG-8 LC8 CSC 142 PINE RIVER 51 Lagoon Ck -27.07628 153.00955<br />
SHI-1 S1 CSC 141 MAROOCHY RIVER 66 Shirley Ck -27.07847 153.16553<br />
SHI-2 S2 CSC 141 MAROOCHY RIVER 66 Shirley Ck -27.07855 153.16565<br />
SHI-3 S3 CSC 141 MAROOCHY RIVER 66 Shirley Ck -27.07877 153.16127<br />
SHI-4 S4 CSC 141 MAROOCHY RIVER 66 Shirley Ck -27.07900 153.15873<br />
SAL-1 SC1 CSC 142 PINE RIVER 60 Saltwater Ck -27.19127 152.98415<br />
SAL-10 SC10 CSC 142 PINE RIVER 60 Saltwater Ck -27.20842 153.02585<br />
SAL-2 SC2 CSC 142 PINE RIVER 60 Saltwater Ck -27.20645 152.99628<br />
SAL-3 SC3 CSC 142 PINE RIVER 60 Saltwater Ck -27.19627 152.99665<br />
SAL-4 SC4 CSC 142 PINE RIVER 60 Saltwater Ck -27.19890 153.00097<br />
SAL-5 SC5 CSC 142 PINE RIVER 60 Saltwater Ck -27.19525 153.00637<br />
SAL-6 SC6 CSC 142 PINE RIVER 60 Saltwater Ck -27.19558 153.00775<br />
SAL-7 SC7 CSC 142 PINE RIVER 60 Saltwater Ck -27.19537 153.00775<br />
SAL-8 SC8 CSC 142 PINE RIVER 60 Saltwater Ck -27.20303 153.01473<br />
SAL-9 SC9 CSC 142 PINE RIVER 60 Saltwater Ck -27.20652 153.03145<br />
SHE-1 SSC1 CSC 142 PINE RIVER 50 Sheepstation Ck -27.12668 152.89308<br />
SHE-2 SSC2 CSC 142 PINE RIVER 50 Sheepstation Ck -27.12713 152.91110<br />
SHE-3 SSC3 CSC 142 PINE RIVER 50 Sheepstation Ck -27.11080 152.93337<br />
SHE-4 SSC4 CSC 142 PINE RIVER 50 Sheepstation Ck -27.10627 152.95272<br />
WAR-1 W1 CSC 142 PINE RIVER 13 Wararba Ck -27.00665 152.83245<br />
WAR-2 W2 CSC 142 PINE RIVER 13 Wararba Ck -27.04802 152.82685<br />
WAR-3 W3 CSC 142 PINE RIVER 13 Wararba Ck -27.06278 152.87237<br />
WAR-4 W4 CSC 142 PINE RIVER 13 Wararba Ck -27.08497 152.90913<br />
WAR-5 W5 CSC 142 PINE RIVER 13 Wararba Ck -27.07770 152.91890<br />
WAR-6 W6 CSC 142 PINE RIVER 13 Wararba Ck -27.08690 152.93480<br />
Cab-0 Cab-0 EPA 142 PINE RIVER 10 <strong>Caboolture</strong> Rv -27.15307 153.04035<br />
Cab-0 Cab-0 EPA 142 PINE RIVER 10 <strong>Caboolture</strong> Rv -27.15307 153.04035<br />
42
<strong>Caboolture</strong> <strong>Water</strong> <strong>Quality</strong> <strong>Study</strong><br />
Table 21. (cont)<br />
Report<br />
site name<br />
CSC/PRCMP<br />
Code<br />
Source Basin Basin Name Stream Stream Name Latitude Longitude<br />
Cab-1.0 Cab-1.0 EPA 143 BRISBANE RIVER 9544 Deception <strong>Bay</strong> -27.14775 153.03340<br />
Cab-1.6 Cab-1.6 EPA 142 PINE RIVER 10 <strong>Caboolture</strong> Rv -27.13050 153.03431<br />
Cab-1.6 Cab-1.6 EPA 142 PINE RIVER 10 <strong>Caboolture</strong> Rv -27.10928 153.01319<br />
Cab-11.4 Cab-11.4 EPA 142 PINE RIVER 10 <strong>Caboolture</strong> Rv -27.10658 153.00605<br />
Cab-11.4 Cab-11.4 EPA 142 PINE RIVER 10 <strong>Caboolture</strong> Rv -27.10658 153.00605<br />
Cab-13.4 Cab-13.4 EPA 142 PINE RIVER 10 <strong>Caboolture</strong> Rv -27.10342 152.99849<br />
Cab-13.4 Cab-13.4 EPA 142 PINE RIVER 10 <strong>Caboolture</strong> Rv -27.10342 152.99849<br />
Cab-15.1 Cab-15.1 EPA 142 PINE RIVER 10 <strong>Caboolture</strong> Rv -27.10061 152.99481<br />
Cab-15.1 Cab-15.1 EPA 142 PINE RIVER 10 <strong>Caboolture</strong> Rv -27.10061 152.99481<br />
Cab-17.1 Cab-17.1 EPA 142 PINE RIVER 10 <strong>Caboolture</strong> Rv -27.09619 152.97832<br />
Cab-17.1 Cab-17.1 EPA 142 PINE RIVER 10 <strong>Caboolture</strong> Rv -27.09619 152.97832<br />
Cab-18.8 Cab-18.8 EPA 142 PINE RIVER 10 <strong>Caboolture</strong> Rv -27.09447 152.96808<br />
Cab-19.9 Cab-19.9 EPA 142 PINE RIVER 10 <strong>Caboolture</strong> Rv -27.09438 152.96018<br />
Cab-19.9 Cab-19.9 EPA 142 PINE RIVER 10 <strong>Caboolture</strong> Rv -27.09438 152.96018<br />
Cab-4.8 Cab-4.8 EPA 142 PINE RIVER 10 <strong>Caboolture</strong> Rv -27.12734 153.02269<br />
Cab-4.8 Cab-4.8 EPA 142 PINE RIVER 10 <strong>Caboolture</strong> Rv -27.12734 153.02269<br />
Cab-41 Cab-41 EPA 142 PINE RIVER 10 <strong>Caboolture</strong> Rv -27.11149 152.88505<br />
Cab-41 Cab-41 EPA 142 PINE RIVER 10 <strong>Caboolture</strong> Rv -27.15856 153.04049<br />
Cab-7.6 Cab-7.6 EPA 142 PINE RIVER 10 <strong>Caboolture</strong> Rv -27.10928 153.01319<br />
Cab-9.5 Cab-9.5 EPA 142 PINE RIVER 10 <strong>Caboolture</strong> Rv -27.11335 153.00202<br />
Cab-9.5 Cab-9.5 EPA 142 PINE RIVER 10 <strong>Caboolture</strong> Rv -27.11335 153.00202<br />
Dec-a Dec-a EPA 143 BRISBANE RIVER 9544 Deception <strong>Bay</strong> -27.10000 153.10833<br />
Dec-a Dec-a EPA 143 BRISBANE RIVER 9544 Deception <strong>Bay</strong> -27.10000 153.10833<br />
Dec-b Dec-b EPA 143 BRISBANE RIVER 9544 Deception <strong>Bay</strong> -27.10000 153.22000<br />
Dec-b Dec-b EPA 143 BRISBANE RIVER 9544 Deception <strong>Bay</strong> -27.10000 153.22000<br />
Dec-c Dec-c EPA 143 BRISBANE RIVER 9544 Deception <strong>Bay</strong> -27.11167 153.16833<br />
Dec-c Dec-c EPA 143 BRISBANE RIVER 9544 Deception <strong>Bay</strong> -27.11167 153.16833<br />
Dec-d Dec-d EPA 143 BRISBANE RIVER 9544 Deception <strong>Bay</strong> -27.12000 153.07667<br />
Dec-d Dec-d EPA 143 BRISBANE RIVER 9544 Deception <strong>Bay</strong> -27.12000 153.07667<br />
Dec-e Dec-e EPA 143 BRISBANE RIVER 9544 Deception <strong>Bay</strong> -27.13000 153.09167<br />
Dec-e Dec-e EPA 143 BRISBANE RIVER 9544 Deception <strong>Bay</strong> -27.13000 153.09167<br />
Dec-f Dec-f EPA 143 BRISBANE RIVER 9544 Deception <strong>Bay</strong> -27.13500 153.07833<br />
Dec-f Dec-f EPA 143 BRISBANE RIVER 9544 Deception <strong>Bay</strong> -27.13500 153.07833<br />
Dec-g Dec-g EPA 143 BRISBANE RIVER 9544 Deception <strong>Bay</strong> -27.13333 153.17667<br />
Dec-g Dec-g EPA 143 BRISBANE RIVER 9544 Deception <strong>Bay</strong> -27.13333 153.17667<br />
Dec-h Dec-h EPA 143 BRISBANE RIVER 9544 Deception <strong>Bay</strong> -27.14167 153.05500<br />
Dec-h Dec-h EPA 143 BRISBANE RIVER 9544 Deception <strong>Bay</strong> -27.14167 153.05500<br />
Dec-i Dec-i EPA 143 BRISBANE RIVER 9544 Deception <strong>Bay</strong> -27.14493 153.06556<br />
Dec-j Dec-j EPA 143 BRISBANE RIVER 9544 Deception <strong>Bay</strong> -27.15000 153.05833<br />
Dec-k Dec-k EPA 143 BRISBANE RIVER 9544 Deception <strong>Bay</strong> -27.15397 153.04539<br />
Dec-l Dec-l EPA 143 BRISBANE RIVER 9544 Deception <strong>Bay</strong> -27.15333 153.04833<br />
Dec-m Dec-m EPA 143 BRISBANE RIVER 9544 Deception <strong>Bay</strong> -27.15405 153.05567<br />
Dec-n Dec-n EPA 143 BRISBANE RIVER 9544 Deception <strong>Bay</strong> -27.16167 153.04667<br />
Dec-o Dec-o EPA 143 BRISBANE RIVER 9544 Deception <strong>Bay</strong> -27.16300 153.04540<br />
Dec-p Dec-p EPA 143 BRISBANE RIVER 9544 Deception <strong>Bay</strong> -27.15667 153.06667<br />
Dec-q Dec-q EPA 143 BRISBANE RIVER 9544 Deception <strong>Bay</strong> -27.16299 153.06557<br />
Dec-r Dec-r EPA 143 BRISBANE RIVER 9544 Deception <strong>Bay</strong> -27.15500 153.12000<br />
Dec-r Dec-r EPA 143 BRISBANE RIVER 9544 Deception <strong>Bay</strong> -27.15500 153.12000<br />
Dec-s Dec-s EPA 143 BRISBANE RIVER 9544 Deception <strong>Bay</strong> -27.18333 153.03833<br />
Dec-t Dec-t EPA 143 BRISBANE RIVER 9544 Deception <strong>Bay</strong> -27.18167 153.06000<br />
Dec-u Dec-u EPA 143 BRISBANE RIVER 9544 Deception <strong>Bay</strong> -27.18104 153.06558<br />
Dec-v Dec-v EPA 143 BRISBANE RIVER 9544 Deception <strong>Bay</strong> -27.17167 153.08667<br />
Dec-v Dec-v EPA 143 BRISBANE RIVER 9544 Deception <strong>Bay</strong> -27.17201 153.08576<br />
Dec-w Dec-w EPA 143 BRISBANE RIVER 9544 Deception <strong>Bay</strong> -27.17667 153.18833<br />
Dec-w Dec-w EPA 143 BRISBANE RIVER 9544 Deception <strong>Bay</strong> -27.17667 153.18833<br />
Dec-x Dec-x EPA 143 BRISBANE RIVER 9544 Deception <strong>Bay</strong> -27.19167 153.13667<br />
Dec-x Dec-x EPA 143 BRISBANE RIVER 9544 Deception <strong>Bay</strong> -27.19167 153.13667<br />
Dec-y Dec-y EPA 143 BRISBANE RIVER 9544 Deception <strong>Bay</strong> -27.19833 153.09500<br />
43
<strong>Caboolture</strong> <strong>Water</strong> <strong>Quality</strong> <strong>Study</strong><br />
Table 21 (cont).<br />
Report<br />
site name<br />
CSC/PRCMP<br />
Code<br />
Source Basin Basin Name Stream Stream Name Latitude Longitude<br />
Dec-y Dec-y EPA 143 BRISBANE RIVER 9544 Deception <strong>Bay</strong> -27.19833 153.09500<br />
Dec-z Dec-z EPA 143 BRISBANE RIVER 9544 Deception <strong>Bay</strong> -27.21667 153.13500<br />
Dec-z Dec-z EPA 143 BRISBANE RIVER 9544 Deception <strong>Bay</strong> -27.21667 153.13500<br />
Pum-a Pum-a EPA 141 MAROOCHY RIVER 9544 Pumicestone Passage -26.82333 153.12953<br />
Pum-b Pum-b EPA 141 MAROOCHY RIVER 9544 Pumicestone Passage -26.84514 153.11689<br />
Pum-c Pum-c EPA 141 MAROOCHY RIVER 9544 Pumicestone Passage -26.87336 153.11500<br />
Pum-d Pum-d EPA 141 MAROOCHY RIVER 9544 Pumicestone Passage -26.89725 153.09847<br />
Pum-e Pum-e EPA 141 MAROOCHY RIVER 9544 Pumicestone Passage -26.91611 153.07322<br />
Pum-f Pum-f EPA 141 MAROOCHY RIVER 9544 Pumicestone Passage -26.93822 153.06664<br />
Pum-g Pum-g EPA 141 MAROOCHY RIVER 9544 Pumicestone Passage -26.95436 153.05719<br />
Pum-h Pum-h EPA 141 MAROOCHY RIVER 9544 Pumicestone Passage -26.95253 153.08622<br />
Pum-i Pum-i EPA 141 MAROOCHY RIVER 9544 Pumicestone Passage -26.98475 153.07206<br />
Pum-j Pum-j EPA 141 MAROOCHY RIVER 9544 Pumicestone Passage -27.00564 153.09342<br />
Pum-k Pum-k EPA 141 MAROOCHY RIVER 9544 Pumicestone Passage -27.02944 153.09972<br />
Pum-l Pum-l EPA 141 MAROOCHY RIVER 9544 Pumicestone Passage -27.05508 153.13042<br />
Pum-m Pum-m EPA 141 MAROOCHY RIVER 9544 Pumicestone Passage -27.08544 153.15414<br />
War-0 War-0 EPA 142 PINE RIVER 13 Wararba Ck -27.08715 152.93346<br />
War-2.0 War-2.0 EPA 142 PINE RIVER 10 Wararba Ck -27.08173 152.92339<br />
BE-a BE-a PRCMP 141 MAROOCHY RIVER 53 Bells Ck -26.84337 153.11281<br />
BE-b BE-b PRCMP 141 MAROOCHY RIVER 53 Bells Ck -26.84813 153.10539<br />
BE-c BE-c PRCMP 141 MAROOCHY RIVER 53 Bells Ck -26.85476 153.09307<br />
BE-d BE-d PRCMP 141 MAROOCHY RIVER 53 Bells Ck -26.84058 153.08745<br />
BE-e BE-e PRCMP 141 MAROOCHY RIVER 53 Bells Ck -26.83670 153.08196<br />
BE-f BE-f PRCMP 141 MAROOCHY RIVER 53 Bells Ck -26.83426 153.06418<br />
BU-a BU-a PRCMP 141 MAROOCHY RIVER 47 Bullock Ck -27.01808 153.07659<br />
BU-b BU-b PRCMP 141 MAROOCHY RIVER 47 Bullock Ck -27.02351 153.06988<br />
BU-c BU-c PRCMP 141 MAROOCHY RIVER 47 Bullock Ck -27.01743 153.05781<br />
BU-d BU-d PRCMP 141 MAROOCHY RIVER 47 Bullock Ck -27.01827 153.05608<br />
CO-a CO-a PRCMP 141 MAROOCHY RIVER 52 Coochin Ck -26.89496 153.06104<br />
CO-b CO-b PRCMP 141 MAROOCHY RIVER 52 Coochin Ck -26.88797 153.04329<br />
CO-c CO-c PRCMP 141 MAROOCHY RIVER 52 Coochin Ck -26.88393 153.03666<br />
CO-d CO-d PRCMP 141 MAROOCHY RIVER 52 Coochin Ck -26.88470 153.02255<br />
EL-a EL-a PRCMP 141 MAROOCHY RIVER 50 Elimbah Ck -27.03559 153.08047<br />
EL-b EL-b PRCMP 141 MAROOCHY RIVER 50 Elimbah Ck -27.04101 153.08069<br />
EL-c EL-c PRCMP 141 MAROOCHY RIVER 50 Elimbah Ck -27.03447 153.06688<br />
EL-d EL-d PRCMP 141 MAROOCHY RIVER 50 Elimbah Ck -27.03334 153.05275<br />
EL-e EL-e PRCMP 141 MAROOCHY RIVER 50 Elimbah Ck -27.03022 153.03942<br />
EL-f EL-f PRCMP 141 MAROOCHY RIVER 50 Elimbah Ck -27.02154 153.03211<br />
EL-g EL-g PRCMP 141 MAROOCHY RIVER 50 Elimbah Ck -26.99595 152.99244<br />
GM-a GM-a PRCMP 141 MAROOCHY RIVER 60 Glass Mountain Ck -26.98178 153.04752<br />
GM-b GM-b PRCMP 141 MAROOCHY RIVER 60 Glass Mountain Ck -26.99054 153.02814<br />
HU-a HU-a PRCMP 141 MAROOCHY RIVER 54 Hussey Ck -26.92397 153.05561<br />
HU-b HU-b PRCMP 141 MAROOCHY RIVER 54 Hussey Ck -26.92669 153.04821<br />
HU-c HU-c PRCMP 141 MAROOCHY RIVER 54 Hussey Ck -26.93237 153.03471<br />
HU-d HU-d PRCMP 141 MAROOCHY RIVER 54 Hussey Ck -26.93412 152.99356<br />
LC-a LC-a PRCMP 141 MAROOCHY RIVER 55 Lamerough Canal -26.83247 153.11102<br />
ML-a ML-a PRCMP 141 MAROOCHY RIVER 57 Mellum Ck -26.87583 153.03232<br />
ML-b ML-b PRCMP 141 MAROOCHY RIVER 57 Mellum Ck -26.86787 153.02946<br />
ML-c ML-c PRCMP 141 MAROOCHY RIVER 57 Mellum Ck -26.86575 153.02294<br />
NG-a NG-a PRCMP 141 MAROOCHY RIVER 51 Ningi Ck -27.05851 153.08392<br />
NG-b NG-b PRCMP 141 MAROOCHY RIVER 51 Ningi Ck -27.05508 153.07625<br />
NG-c NG-c PRCMP 141 MAROOCHY RIVER 51 Ningi Ck -27.05254 153.05434<br />
PH-a PH-a PRCMP 141 MAROOCHY RIVER 65 Pacific Harbour -27.05176 153.14166<br />
PH-b PH-b PRCMP 141 MAROOCHY RIVER 65 Pacific Harbour -27.05162 153.13785<br />
PP-a PP-a PRCMP 141 MAROOCHY RIVER 9544 Pumicestone Passage -26.82026 153.12822<br />
PP-b PP-b PRCMP 141 MAROOCHY RIVER 9544 Pumicestone Passage -26.83352 153.12023<br />
PP-c PP-c PRCMP 141 MAROOCHY RIVER 9544 Pumicestone Passage -26.84565 153.11763<br />
PP-d PP-d PRCMP 141 MAROOCHY RIVER 9544 Pumicestone Passage -26.87162 153.11607<br />
44
Table 21. (cont).<br />
Report<br />
site name<br />
<strong>Caboolture</strong> <strong>Water</strong> <strong>Quality</strong> <strong>Study</strong><br />
CSC/PRCMP<br />
Code<br />
Source Basin Basin Name Stream Stream Name Latitude Longitude<br />
PP-e PP-e PRCMP 141 MAROOCHY RIVER 9544 Pumicestone Passage -26.89664 153.09872<br />
PP-f PP-f PRCMP 141 MAROOCHY RIVER 9544 Pumicestone Passage -26.91525 153.07368<br />
PP-g PP-g PRCMP 141 MAROOCHY RIVER 9544 Pumicestone Passage -26.93667 153.06742<br />
PP-h PP-h PRCMP 141 MAROOCHY RIVER 9544 Tripcony Bight -26.94834 153.05436<br />
PP-ii PP-ii PRCMP 141 MAROOCHY RIVER 9544 Pumicestone Passage -26.95347 153.08454<br />
PP-j PP-j PRCMP 141 MAROOCHY RIVER 9544 Pumicestone Passage -26.98469 153.07176<br />
PP-k PP-k PRCMP 141 MAROOCHY RIVER 9544 Pumicestone Passage -27.00479 153.07259<br />
PP-l PP-l PRCMP 141 MAROOCHY RIVER 9544 Pumicestone Passage -27.00701 153.09241<br />
PP-m PP-m PRCMP 141 MAROOCHY RIVER 9544 Pumicestone Passage -27.01545 153.08826<br />
PP-n PP-n PRCMP 141 MAROOCHY RIVER 9544 Pumicestone Passage -27.03047 153.09878<br />
PP-o PP-o PRCMP 141 MAROOCHY RIVER 9544 Pumicestone Passage -27.05433 153.13134<br />
PP-p PP-p PRCMP 141 MAROOCHY RIVER 66 Shirley Ck -27.08147 153.15598<br />
PP-q PP-q PRCMP 141 MAROOCHY RIVER 9544 Pumicestone Passage -27.08617 153.15154<br />
PV-a PV-a PRCMP 141 MAROOCHY RIVER 301 Poverty Ck -26.99222 153.09160<br />
PV-b PV-b PRCMP 141 MAROOCHY RIVER 301 Poverty Ck -26.98752 153.09049<br />
SW-a SW-a PRCMP 141 MAROOCHY RIVER 302 Saltwater Ck -26.90545 153.06272<br />
SW-b SW-b PRCMP 141 MAROOCHY RIVER 302 Saltwater Ck -26.90997 153.05425<br />
WE-a WE-a PRCMP 141 MAROOCHY RIVER 303 Westaways Ck -26.90791 153.09692<br />
45
<strong>Caboolture</strong> <strong>Water</strong> <strong>Quality</strong> <strong>Study</strong><br />
Appendix B: Data presentation- Box and Whisker plots<br />
Box and whisker plots are a widely accepted way of presenting water quality data (Figure 17). They show<br />
where the data points are concentrated (the box) and the outlying values (the whiskers, asterisks and<br />
circles). Box and whisker plots are therefore a useful way of visually presenting the distribution of the data.<br />
Box and whisker plots are used in this report to assess compliance with guidelines. For easy comparison<br />
with the guidelines (derived from the 20 th and 80 percentiles of reference values for most parameters) the<br />
boxes represent the 20 th and 80 th percentiles. The top of the box in these plots is the 80 th percentile (80<br />
percent of the data fall below this line), while the bottom of the box represents the 20 th percentile (20<br />
percent of the data fall below this line). The dot in the middle of the box represents the median (50 percent<br />
of the data fall above and 50 percent below this number).<br />
The whiskers on the box extend to data points that are up to 1½ times the Inter Quartile Range (IQR). The<br />
IQR is defined as the difference between the 75 th and the 25 th percentiles, and is equal to the range of<br />
about half the data. Outliers which are less than three times the IQR are shown as asterisks, while those<br />
greater than three times the IQR are shown as circles. The statistical and graphical package S-Plus 4.5<br />
was used to produce all box plots and calculate percentiles.<br />
Values within 3 times the Inter<br />
Quartile Range<br />
80th percentile: 80 percent of<br />
values fall below this line<br />
Median<br />
20th percentile: 20 percent of<br />
values fall below this line<br />
Whiskers: values within 1½<br />
times the Inter Quartile Range<br />
Values greater than 3 times<br />
the Inter Quartile Range<br />
Figure 18. Schematic representation of box and whisker plots.<br />
Box and whisker plots are used in this report to assess compliance of each indicator at each site with<br />
the appropriate guidelines. The data for one or more waterways are presented together with the<br />
reference values for those watertypes (Figure 18). For easy comparison with the reference values, the<br />
boxes are colour coded according to their watertype (Figure 18, Table 21). The label for the box for<br />
each site is also colour coded according to compliance with the guidelines. If the site complied with the<br />
guidelines for that indicator, the site label is printed in black; if the site did not comply the label is<br />
printed in red. The number of data points in both the site and reference data is also recorded below<br />
each box.<br />
Figure 1k Chlorophyll-a (g/L) at sites in an example waterway<br />
20<br />
Chlorophyll-a (g/L)<br />
15<br />
10<br />
5<br />
0<br />
(N=10) (N=12) (N=12) (N=12) (N=12) (N=12) (N=12) (N=49) (N=57) (N=336) (N=110) (N=111) (N=169) (N=54)<br />
SITE-1 SITE-2 SITE-3 SITE-4 SITE-5 SITE-6 SITE-7 O OC ECLE ME UE LC UC<br />
Monitoring Sites<br />
Reference Sites<br />
Figure 19. Example of a box and whisker plot, showing values recorded at monitoring sites (left) and reference sites<br />
(right) for chlorophyll-a. <strong>Water</strong>types are colour-coded, and descriptions for the watertype-code are presented in<br />
Table 22. Note that sites 1, 2, and 6 complied with water quality guidelines, whereas sites 3, 4, 5 and 7 exceeded<br />
guidelines.<br />
46
<strong>Caboolture</strong> <strong>Water</strong> <strong>Quality</strong> <strong>Study</strong><br />
The monitoring sites are shown on the left, and the reference values on the right. In this case, there is<br />
one example site shown for each water-type. Sites 4, 5 and 6 failed to comply with the guidelines, and<br />
the labels for these sites are shown in purple. It is evident from the graph that the median of these<br />
sites is greater than the 80 th percentile of the relevant reference values. The number of samples<br />
represented by each box is also shown below the graph. The data for the monitoring sites are based<br />
on one year’s sampling, while those for the reference sites are based on at least 3 years of monitoring.<br />
The abbreviations for each water-type are listed in Table 21.<br />
Table 22. Abbreviations for watertypes relevant for the present study.<br />
Abbreviation<br />
O<br />
OC<br />
ECLE<br />
ME<br />
UE<br />
LC<br />
UC<br />
<strong>Water</strong>-type<br />
Ocean<br />
Open Coastal<br />
Enclosed Coastal Lower Estuary<br />
Mid Estuary<br />
Upper Estuary<br />
Lower Catchment<br />
Upper Catchment<br />
47
Appendix C: Results of water quality assessments<br />
C1: Assessments of changes in water quality assessments in recent years<br />
pH<br />
Conductivity<br />
Dissolved<br />
Oxygen<br />
Turbidity<br />
Secchi Depth<br />
Oxidised<br />
Nitrogen<br />
Ammonia<br />
Total Nitrogen<br />
Total<br />
Phosphorous<br />
Chlorophyll a<br />
Organic<br />
Nitrogen<br />
Filterable<br />
Reactive<br />
Phosphorous<br />
Table 23. <strong>Water</strong> quality assessments for all indicators at<br />
all sites from 1999 to 2001.<br />
2001<br />
2000<br />
1999<br />
2001<br />
2000<br />
1999<br />
2001<br />
2000<br />
1999<br />
2001<br />
2000<br />
1999<br />
2001<br />
2000<br />
1999<br />
2001<br />
2000<br />
1999<br />
2001<br />
2000<br />
1999<br />
2001<br />
2000<br />
1999<br />
2001<br />
2000<br />
1999<br />
2001<br />
2000<br />
1999<br />
2001<br />
2000<br />
1999<br />
2001<br />
2000<br />
1999<br />
<strong>Water</strong><br />
Site<br />
Basin Stream Source<br />
Type<br />
Cab-0 ECLE 142 <strong>Caboolture</strong> River EPA <br />
Cab-1.0 ECLE 143 Deception <strong>Bay</strong> EPA <br />
Cab-1.6 ME 142 <strong>Caboolture</strong> River EPA <br />
Cab-11.4 ME 142 <strong>Caboolture</strong> River EPA <br />
Cab-13.4 ME 142 <strong>Caboolture</strong> River EPA <br />
Cab-15.1 ME 142 <strong>Caboolture</strong> River EPA <br />
Cab-17.1 UE 142 <strong>Caboolture</strong> River EPA <br />
Cab-18.8 UE 142 <strong>Caboolture</strong> River EPA <br />
Cab-19.9 UE 142 <strong>Caboolture</strong> River EPA <br />
Cab-4.8 ME 142 <strong>Caboolture</strong> River EPA <br />
Cab-41 LC 142 <strong>Caboolture</strong> River EPA <br />
Cab-7.6 ME 142 <strong>Caboolture</strong> River EPA <br />
Cab-9.5 ME 142 <strong>Caboolture</strong> River EPA <br />
Dec-a ECLE 143 Deception <strong>Bay</strong> EPA <br />
Dec-b ECLE 143 Deception <strong>Bay</strong> EPA <br />
Dec-c ECLE 143 Deception <strong>Bay</strong> EPA <br />
Dec-d ECLE 143 Deception <strong>Bay</strong> EPA <br />
Dec-e ECLE 143 Deception <strong>Bay</strong> EPA <br />
Dec-f ECLE 143 Deception <strong>Bay</strong> EPA <br />
Dec-g ECLE 143 Deception <strong>Bay</strong> EPA <br />
Dec-h ECLE 143 Deception <strong>Bay</strong> EPA <br />
Dec-i ECLE 143 Deception <strong>Bay</strong> EPA <br />
Dec-j ECLE 143 Deception <strong>Bay</strong> EPA <br />
Dec-k ECLE 143 Deception <strong>Bay</strong> EPA <br />
Dec-l ECLE 143 Deception <strong>Bay</strong> EPA <br />
Dec-m ECLE 143 Deception <strong>Bay</strong> EPA <br />
Dec-n ECLE 143 Deception <strong>Bay</strong> EPA <br />
Dec-o ECLE 143 Deception <strong>Bay</strong> EPA <br />
Dec-p ECLE 143 Deception <strong>Bay</strong> EPA <br />
Dec-q ECLE 143 Deception <strong>Bay</strong> EPA<br />
<br />
48
pH<br />
Conductivity<br />
Dissolved<br />
Oxygen<br />
Turbidity<br />
Secchi Depth<br />
Oxidised<br />
Nitrogen<br />
Ammonia<br />
Total Nitrogen<br />
Total<br />
Phosphorous<br />
Chlorophyll a<br />
Organic<br />
Nitrogen<br />
Filterable<br />
Reactive<br />
Phosphorous<br />
Table 23. <strong>Water</strong> quality assessments for all indicators at<br />
all sites from 1999 to 2001.<br />
2001<br />
2000<br />
1999<br />
2001<br />
2000<br />
1999<br />
2001<br />
2000<br />
1999<br />
2001<br />
2000<br />
1999<br />
2001<br />
2000<br />
1999<br />
2001<br />
2000<br />
1999<br />
2001<br />
2000<br />
1999<br />
2001<br />
2000<br />
1999<br />
2001<br />
2000<br />
1999<br />
2001<br />
2000<br />
1999<br />
2001<br />
2000<br />
1999<br />
2001<br />
2000<br />
1999<br />
<strong>Water</strong><br />
Site<br />
Basin Stream Source<br />
Type<br />
Dec-r ECLE 143 Deception <strong>Bay</strong> EPA <br />
Dec-s ECLE 143 Deception <strong>Bay</strong> EPA <br />
Dec-t ECLE 143 Deception <strong>Bay</strong> EPA <br />
Dec-u ECLE 143 Deception <strong>Bay</strong> EPA <br />
Dec-v ECLE 143 Deception <strong>Bay</strong> EPA <br />
Dec-w ECLE 143 Deception <strong>Bay</strong> EPA <br />
Dec-x ECLE 143 Deception <strong>Bay</strong> EPA <br />
Dec-y ECLE 143 Deception <strong>Bay</strong> EPA <br />
Dec-z ECLE 143 Deception <strong>Bay</strong> EPA <br />
Pum-a ECLE 141 Pumicestone EPA <br />
Pum-b ECLE 141 Pumicestone EPA <br />
Pum-c ECLE 141 Pumicestone EPA <br />
Pum-d ECLE 141 Pumicestone EPA <br />
Pum-e ECLE 141 Pumicestone EPA <br />
Pum-f ECLE 141 Pumicestone EPA <br />
Pum-g ECLE 141 Pumicestone EPA <br />
Pum-h ECLE 141 Pumicestone EPA <br />
Pum-i ECLE 141 Pumicestone EPA <br />
Pum-j ECLE 141 Pumicestone EPA <br />
Pum-k ECLE 141 Pumicestone EPA <br />
Pum-l ECLE 141 Pumicestone EPA <br />
Pum-m ECLE 141 Pumicestone EPA <br />
War-0 LC 142 Wararba Creek EPA <br />
War-2.0 LC 142 <strong>Caboolture</strong> River EPA <br />
BRI-1 ECLE 141 Bribie Canals CSC <br />
BRI-2 ECLE 141 Bribie Canals CSC <br />
BRI-3 ECLE 141 Bribie Canals CSC <br />
BRI-4 UE 141 Bribie Canals CSC <br />
BRI-5 ECLE 141 Bribie Canals CSC <br />
BRI-6 ECLE 141 Bribie Canals CSC <br />
BRI-7 ECLE 141 Bribie Canals CSC <br />
BRI-8 ECLE 141 Bribie Canals CSC <br />
BUR-1 ME 142 Burpengary Ck CSC <br />
BUR-2 LC 142 Burpengary Ck CSC <br />
49
Table 23. <strong>Water</strong> quality assessments for all indicators at<br />
all sites from 1999 to 2001.<br />
50<br />
2001<br />
2000<br />
1999<br />
2001<br />
2000<br />
1999<br />
2001<br />
2000<br />
1999<br />
2001<br />
2000<br />
1999<br />
2001<br />
2000<br />
1999<br />
2001<br />
2000<br />
1999<br />
2001<br />
2000<br />
1999<br />
2001<br />
2000<br />
1999<br />
2001<br />
2000<br />
1999<br />
2001<br />
2000<br />
1999<br />
pH<br />
Conductivity<br />
Dissolved<br />
Oxygen<br />
Turbidity<br />
Secchi Depth<br />
Oxidised<br />
Nitrogen<br />
Ammonia<br />
Total Nitrogen<br />
Total<br />
Phosphorous<br />
Chlorophyll a<br />
2001<br />
2000<br />
1999<br />
Organic<br />
Nitrogen<br />
2001<br />
2000<br />
1999<br />
Filterable<br />
Reactive<br />
Phosphorous<br />
<strong>Water</strong><br />
Site<br />
Basin Stream Source<br />
Type<br />
BUR-3 LC 142 Burpengary Ck CSC <br />
BUR-4 LC 142 Burpengary Ck CSC <br />
BUR-5 LC 142 Burpengary Ck CSC <br />
BUR-6 LC 142 Burpengary Ck CSC <br />
CAB-1 UC 142 <strong>Caboolture</strong> Rv CSC <br />
CAB-2 LC 142 <strong>Caboolture</strong> Rv CSC <br />
CAB-3 LC 142 <strong>Caboolture</strong> Rv CSC <br />
CAB-4 LC 142 <strong>Caboolture</strong> Rv CSC <br />
CAB-5 ME 142 <strong>Caboolture</strong> Rv CSC <br />
CAB-6 ME 142 <strong>Caboolture</strong> Rv CSC <br />
CAB-7 ME 142 <strong>Caboolture</strong> Rv CSC <br />
CAB-8 ME 142 <strong>Caboolture</strong> Rv CSC <br />
LAG-1 LC 142 Lagoon Ck CSC <br />
LAG-2 LC 142 Lagoon Ck CSC <br />
LAG-3 LC 142 Lagoon Ck CSC <br />
LAG-4 LC 142 Lagoon Ck CSC <br />
LAG-5 LC 142 Lagoon Ck CSC <br />
LAG-6 LC 142 Lagoon Ck CSC <br />
LAG-7 LC 142 Lagoon Ck CSC <br />
LAG-8 LC 142 Lagoon Ck CSC <br />
SAL-1 LC 142 Saltwater Ck CSC <br />
SAL-2 LC 142 Saltwater Ck CSC <br />
SAL-3 LC 142 Saltwater Ck CSC <br />
SAL-4 LC 142 Saltwater Ck CSC <br />
SAL-5 LC 142 Saltwater Ck CSC <br />
SAL-6 LC 142 Saltwater Ck CSC <br />
SAL-7 LC 142 Saltwater Ck CSC <br />
SAL-8 LC 142 Saltwater Ck CSC <br />
SAL-9 LC 142 Saltwater Ck CSC <br />
SHE-1 LC 142 Sheepstation Ck CSC <br />
SHE-2 LC 142 Sheepstation Ck CSC <br />
SHE-3 LC 142 Sheepstation Ck CSC <br />
SHE-4 LC 142 Sheepstation Ck CSC <br />
SHI-1 UE 141 Shirley Ck CSC
pH<br />
Conductivity<br />
Dissolved<br />
Oxygen<br />
Turbidity<br />
Secchi Depth<br />
Oxidised<br />
Nitrogen<br />
Ammonia<br />
Total Nitrogen<br />
Total<br />
Phosphorous<br />
Chlorophyll a<br />
Organic<br />
Nitrogen<br />
Filterable<br />
Reactive<br />
Phosphorous<br />
Table 23. <strong>Water</strong> quality assessments for all indicators at<br />
all sites from 1999 to 2001.<br />
2001<br />
2000<br />
1999<br />
2001<br />
2000<br />
1999<br />
2001<br />
2000<br />
1999<br />
2001<br />
2000<br />
1999<br />
2001<br />
2000<br />
1999<br />
2001<br />
2000<br />
1999<br />
2001<br />
2000<br />
1999<br />
2001<br />
2000<br />
1999<br />
2001<br />
2000<br />
1999<br />
2001<br />
2000<br />
1999<br />
2001<br />
2000<br />
1999<br />
2001<br />
2000<br />
1999<br />
<strong>Water</strong><br />
Site<br />
Basin Stream Source<br />
Type<br />
SHI-2 UE 141 Shirley Ck CSC <br />
SHI-3 ME 141 Shirley Ck CSC <br />
SHI-4 ME 141 Shirley Ck CSC <br />
WAR-1 LC 142 Wararba Ck CSC <br />
WAR-2 LC 142 Wararba Ck CSC <br />
WAR-3 LC 142 Wararba Ck CSC <br />
WAR-4 LC 142 Wararba Ck CSC <br />
WAR-5 LC 142 Wararba Ck CSC <br />
WAR-6 LC 142 Wararba Ck CSC <br />
BE-a ECLE 141 Bells Creek PRCMP <br />
BE-b ME 141 Bells Creek PRCMP <br />
BE-c ME 141 Bells Creek PRCMP <br />
BE-d ME 141 Bells Creek PRCMP <br />
BE-e ME 141 Bells Creek PRCMP <br />
BE-f ME 141 Bells Creek PRCMP <br />
BU-a ECLE 141 Bullock Creek PRCMP <br />
BU-b ME 141 Bullock Creek PRCMP <br />
BU-c ME 141 Bullock Creek PRCMP <br />
BU-d ME 141 Bullock Creek PRCMP <br />
CO-a ME 141 Coochin Creek PRCMP <br />
CO-b ME 141 Coochin Creek PRCMP <br />
CO-c ME 141 Coochin Creek PRCMP <br />
CO-d ME 141 Coochin Creek PRCMP <br />
EL-a ME 141 Elimbah Creek PRCMP <br />
EL-b ME 141 Elimbah Creek PRCMP <br />
EL-c ME 141 Elimbah Creek PRCMP <br />
EL-d ME 141 Elimbah Creek PRCMP <br />
EL-e UE 141 Elimbah Creek PRCMP <br />
EL-f UE 141 Elimbah Creek PRCMP <br />
EL-g LC 141 Elimbah Creek PRCMP <br />
GM-a ME 141 Glass Mountain PRCMP <br />
GM-b ME 141 Glass Mountain PRCMP <br />
HU-a ME 141 Hussey Creek PRCMP <br />
HU-b ME 141 Hussey Creek PRCMP <br />
51
pH<br />
Conductivity<br />
Dissolved<br />
Oxygen<br />
Turbidity<br />
Secchi Depth<br />
Oxidised<br />
Nitrogen<br />
Ammonia<br />
Total Nitrogen<br />
Total<br />
Phosphorous<br />
Chlorophyll a<br />
Organic<br />
Nitrogen<br />
Filterable<br />
Reactive<br />
Phosphorous<br />
Table 23. <strong>Water</strong> quality assessments for all indicators at<br />
all sites from 1999 to 2001.<br />
2001<br />
2000<br />
1999<br />
2001<br />
2000<br />
1999<br />
2001<br />
2000<br />
1999<br />
2001<br />
2000<br />
1999<br />
2001<br />
2000<br />
1999<br />
2001<br />
2000<br />
1999<br />
2001<br />
2000<br />
1999<br />
2001<br />
2000<br />
1999<br />
2001<br />
2000<br />
1999<br />
2001<br />
2000<br />
1999<br />
2001<br />
2000<br />
1999<br />
2001<br />
2000<br />
1999<br />
<strong>Water</strong><br />
Site<br />
Basin Stream Source<br />
Type<br />
HU-c ME 141 Hussey Creek PRCMP <br />
LC-a ECLE 141 Lamerough Canal PRCMP <br />
ML-a ME 141 Mellum Creek PRCMP <br />
ML-b ME 141 Mellum Creek PRCMP <br />
ML-c UE 141 Mellum Creek PRCMP <br />
NG-a ECLE 141 Ningi Creek PRCMP <br />
NG-b ME 141 Ningi Creek PRCMP <br />
NG-c ME 141 Ningi Creek PRCMP <br />
PH-a ECLE 141 Pacific Harbour PRCMP <br />
PH-b ECLE 141 Pacific Harbour PRCMP <br />
PP-a ECLE 141 Pumicestone PRCMP <br />
PP-b ECLE 141 Pumicestone PRCMP <br />
PP-c ECLE 141 Pumicestone PRCMP <br />
PP-d ECLE 141 Pumicestone PRCMP <br />
PP-e ECLE 141 Pumicestone PRCMP <br />
PP-f ECLE 141 Pumicestone PRCMP <br />
PP-g ECLE 141 Pumicestone PRCMP <br />
PP-h ECLE 141 Tripcony Bight PRCMP <br />
PP- ECLE 141 Pumicestone PRCMP <br />
PP-j ECLE 141 Pumicestone PRCMP <br />
PP-k ECLE 141 Pumicestone PRCMP <br />
PP-l ECLE 141 Pumicestone PRCMP <br />
PP-m ECLE 141 Pumicestone PRCMP <br />
PP-n ECLE 141 Pumicestone PRCMP <br />
PP-o ECLE 141 Pumicestone PRCMP <br />
PP-p ECLE 141 Shirley Creek PRCMP <br />
PP-q ECLE 141 Pumicestone PRCMP <br />
PV-a ECLE 141 Poverty Creek PRCMP <br />
PV-b ECLE 141 Poverty Creek PRCMP <br />
SW-a ME 141 Saltwater Creek PRCMP <br />
SW-b ME 141 Saltwater Creek PRCMP <br />
WE-a ME 141 Westaways Creek PRCMP <br />
52
C2: Medians of water quality data for selected indicators at all sites<br />
Table 24. Medians for selected water quality indicators at sites in the Northern Creeks, 2000<br />
Site<br />
<strong>Water</strong><br />
Type<br />
Basin<br />
Stream Name<br />
pH<br />
Conductivity<br />
(mS/cm)<br />
Dissolved<br />
Oxygen<br />
(%sat.)<br />
Turbidity<br />
(NTU)<br />
Secchi (m)<br />
Oxidised<br />
nitrogen (μg/l)<br />
Ammonia<br />
(μg/l)<br />
Total nitrogen<br />
(μg/l)<br />
Total<br />
phosphorus<br />
(μg/l)<br />
FRP (μg/l)<br />
BE-a ECLE 141 Bells Creek 8.02 43.00 77.9 7.0 1.2 0.005 0.01 0.27 0.02 0.002<br />
BE-b ME 141 Bells Creek 7.78 35.20 87.1 8.5 1.0<br />
BE-c ME 141 Bells Creek 7.78 41.10 69.7 6.0 1.4<br />
BE-d ME 141 Bells Creek 7.47 38.20 66.3 5.0 1.4<br />
BE-e ME 141 Bells Creek 7.29 37.00 55.0 6.0 1.3<br />
BE-f ME 141 Bells Creek 6.98 33.20 43.7 7.0 1.0 0.003 0.01 0.48 0.02 0.002<br />
BU-a ECLE 141 Bullock Creek 8.09 45.60 82.3 8.0 1.1 0.002 0.00 0.25 0.02 0.002<br />
BU-b ME 141 Bullock Creek 7.92 44.55 89.7 12.0 0.6 0.002 0.01 0.26 0.02 0.002<br />
BU-c ME 141 Bullock Creek 7.75 45.40 76.0 11.0 0.8 0.002 0.01 0.37 0.03 0.002<br />
BU-d ME 141 Bullock Creek 7.52 40.65 99.9 32.5 0.3<br />
CO-a ME 141 Coochin Creek 7.63 32.90 76.7 7.0 1.0 0.320 0.03 0.59 0.01 0.002<br />
CO-b ME 141 Coochin Creek 7.26 24.20 72.9 6.5 1.0<br />
CO-c ME 141 Coochin Creek 6.72 4.34 64.4 3.5 1.1 2.400 0.02 2.60 0.01 0.002<br />
EL-a ME 141 Elimbah Creek 7.82 34.65 83.1 4.0 1.2 0.007 0.01 0.30 0.01 0.002<br />
EL-b ME 141 Elimbah Creek 7.50 22.75 84.8 8.0 1.1<br />
EL-c ME 141 Elimbah Creek 7.48 16.60 75.8 5.0 0.5<br />
EL-d ME 141 Elimbah Creek 7.18 11.35 66.8 4.0 1.1<br />
EL-e UE 141 Elimbah Creek 6.55 0.40 60.5 4.5 0.8<br />
EL-f UE 141 Elimbah Creek 6.47 0.25 60.8 5.5 0.6<br />
GM-a ME 141 Glass Mountain Creek 7.77 43.85 81.4 21.0 0.7 0.003 0.01 0.35 0.02 0.002<br />
GM-b ME 141 Glass Mountain Creek 7.32 35.00 75.7 14.5 0.7<br />
HU-a ME 141 Hussey Creek 7.44 31.30 74.6 7.0 0.9 0.031 0.02 0.31 0.01 0.002<br />
HU-b ME 141 Hussey Creek 7.18 15.20 66.2 6.0 0.9<br />
LC-a ECLE 141 Lamerough Canal 7.88 39.30 98.0 5.0 1.4<br />
ML-b ME 141 Mellum Creek 6.81 7.88 58.1 6.0 0.8 0.780 0.04 1.00 0.01 0.003<br />
NG-a ECLE 141 Ningi Creek 7.95 46.30 73.5 7.0 1.1 0.003 0.01 0.28 0.03 0.004<br />
NG-b ME 141 Ningi Creek 7.87 37.25 79.1 9.5 0.9<br />
NG-c ME 141 Ningi Creek 6.92 32.70 44.0 7.0 0.9 0.010 0.03 0.47 0.03 0.002<br />
SW-a ME 141 Saltwater Creek 7.24 21.55 81.0 11.5 0.3 0.017 0.01 0.33 0.02 0.002<br />
SW-b ME 141 Saltwater Creek 7.45 31.70 75.4 8.0 1.1<br />
Table 25. Medians for selected water quality indicators at sites on Bribie Island for 2001<br />
Site<br />
<strong>Water</strong><br />
Type<br />
Basin Stream Name<br />
pH<br />
Conductivity<br />
(mS/cm)<br />
Dissolved<br />
Oxygen (%sat.)<br />
Turbidity (NTU)<br />
Secchi (m)<br />
Oxidised<br />
nitrogen (μg/l)<br />
Ammonia (μg/l)<br />
Total nitrogen<br />
(μg/l)<br />
Total<br />
phosphorus<br />
(μg/l)<br />
Chlorophyll a<br />
(μg/l)<br />
BRI-1 ECLE 141 Bribie Canals 7.93 56.10 72.71 2.00 2.00 0.010 0.060 0.550 0.160 1.48<br />
BRI-2 ECLE 141 Bribie Canals 7.92 55.70 75.60 3.00 1.30 0.010 0.020 0.500 0.140 1.73<br />
BRI-3 ECLE 141 Bribie Canals 7.76 54.40 70.57 2.00 1.50 0.010 0.040 0.500 0.120 1.31<br />
BRI-4 UE 141 Bribie Canals 7.28 0.72 41.57 16.00 0.020 0.040 0.500 0.180 6.14<br />
BRI-5 ECLE 141 Bribie Canals 7.95 55.50 73.82 5.00 1.85 0.010 0.030 0.500 0.120 1.61<br />
BRI-6 ECLE 141 Bribie Canals 7.97 55.50 76.77 4.00 1.80 0.010 0.020 0.500 0.140 1.34<br />
BRI-7 ECLE 141 Bribie Canals 8.01 55.60 78.37 4.00 1.80 0.010 0.020 0.500 0.160 1.60<br />
BRI-8 ECLE 141 Bribie Canals 8.05 56.00 79.08 22.00 0.010 0.030 0.500 0.120 1.60<br />
PH-a ECLE 141 Pacific Harbour 8.07 45.55 97.0 8.0 0.6<br />
PH-b ECLE 141 Pacific Harbour 8.08 46.30 95.2 4.5 1.4<br />
PV-a ECLE 141 Poverty Creek 7.93 43.50 99.5 21.0 0.5<br />
SHI-1 UE 141 Shirley Ck 7.67 0.51 67.87 18.00 0.045 0.050 0.500 0.270 3.75<br />
SHI-2 UE 141 Shirley Ck 7.01 0.42 28.91 16.00 0.010 0.170 0.500 0.340 5.39<br />
SHI-3 ME 141 Shirley Ck 7.07 29.00 47.29 10.00 0.010 0.070 0.500 0.200 3.21<br />
SHI-4 ME 141 Shirley Ck 7.24 50.50 60.71 6.00 0.010 0.060 0.500 0.200 2.95<br />
WE-a ME 141 Westaways Ck 7.00 31.40 57.4 6.5 0.7<br />
53
Table 26. Medians for selected water quality indicators at sites in Pumicestone Passage (2001 for EPA sites, 2000 for PRCMP<br />
sites)<br />
Site<br />
<strong>Water</strong><br />
Type<br />
Basin<br />
Stream Name<br />
pH<br />
Conductivity<br />
(mS/cm)<br />
Dissolved Oxygen<br />
(%sat.)<br />
Turbidity (NTU)<br />
Secchi (m)<br />
Oxidised nitrogen<br />
(μg/l)<br />
Ammonia (μg/l)<br />
Total nitrogen<br />
(μg/l)<br />
Total phosphorus<br />
(μg/l)<br />
Chlorophyll a<br />
(μg/l)<br />
Organic Nitrogen<br />
(μg/l)<br />
FRP<br />
Pum-a ECLE 141 P’stone Passage 8.18 52.89 102.5 1.0 2.5 1.27<br />
Pum-b ECLE 141 P’stone Passage 8.08 52.13 97.5 4.0 1.5<br />
Pum-c ECLE 141 P’stone Passage 7.98 49.99 94.0 9.5 1.0 3.87<br />
Pum-d ECLE 141 P’stone Passage 7.94 51.02 93.5 11.5 1.0 0.006 0.004 0.290 0.023 3.55 0.280 0.002<br />
Pum-e ECLE 141 P’stone Passage 7.92 49.69 92.5 9.0 0.9<br />
Pum-f ECLE 141 P’stone Passage 8.04 51.75 96.5 7.5 1.0<br />
Pum-g ECLE 141 P’stone Passage 8.09 53.03 98.0 10.0 0.9<br />
Pum-h ECLE 141 P’stone Passage 8.08 53.08 94.5 7.0 1.2 2.40<br />
Pum-i ECLE 141 P’stone Passage 8.11 52.97 98.0 5.5 1.7<br />
Pum-j ECLE 141 P’stone Passage 8.13 53.12 96.0 4.0 1.7<br />
Pum-k ECLE 141 P’stone Passage 8.16 53.39 96.0 6.0 1.5 0.002 0.002 0.200 0.021 2.07 0.190 0.007<br />
Pum-l ECLE 141 P’stone Passage 8.18 53.59 97.5 4.0 1.7<br />
Pum-m ECLE 141 P’stone Passage 8.18 53.48 98.0 4.0 2.4 1.57<br />
PP-a ECLE 141 P’stone Passage 8.23 47.25 86.8 2.0 2.8<br />
PP-b ECLE 141 P’stone Passage 8.18 45.60 86.3 4.0 1.9<br />
PP-c ECLE 141 P’stone Passage 8.09 42.80 83.1 7.0 1.1<br />
PP-d ECLE 141 P’stone Passage 7.87 41.80 77.0 16.0 0.7<br />
PP-e ECLE 141 P’stone Passage 7.84 37.05 89.7 10.0 0.8<br />
PP-f ECLE 141 P’stone Passage 7.70 37.70 91.7 7.0 0.9<br />
PP-g ECLE 141 P’stone Passage 7.72 33.45 88.8 10.5 0.7<br />
PP-h ECLE 141 Tripcony Bight 8.00 40.25 92.9 10.5 0.7<br />
PP-i ECLE 141 P’stone Passage 8.08 42.50 89.7 14.0 0.7<br />
PP-j ECLE 141 P’stone Passage 8.05 44.50 92.3 7.5 1.2 0.002 0.01 0.21 0.01 0.002<br />
PP-k ECLE 141 P’stone Passage 8.11 45.40 90.6 11.0 1.0 0.002 0.01 0.24 0.02 0.002<br />
PP-l ECLE 141 P’stone Passage 8.05 43.35 86.4 5.0 1.4 0.002 0.00 0.21 0.02 0.002<br />
PP-m ECLE 141 P’stone Passage 8.11 45.00 91.0 10.0 1.3 0.002 0.00 0.24 0.02 0.002<br />
PP-n ECLE 141 P’stone Passage 8.17 45.80 97.7 7.0 1.3<br />
PP-o ECLE 141 P’stone Passage 8.22 47.60 90.6 4.0 1.7<br />
PP-p ECLE 141 Shirley Creek 8.16 47.95 80.6 4.0 1.0<br />
PP-q ECLE 141 P’stone Passage 8.25 48.00 90.6 2.5 2.3<br />
54
Table 27. Medians for selected water quality indicators at sites in the <strong>Caboolture</strong> River, 2001<br />
Site<br />
<strong>Water</strong><br />
Type<br />
Basin<br />
Stream Name<br />
pH<br />
Conductivity<br />
(mS/cm)<br />
Dissolved Oxygen<br />
(% sat.)<br />
Turbidity (NTU)<br />
Secchi (m)<br />
Oxidised Nitrogen<br />
(μg/l)<br />
Ammonia (μg/l)<br />
Total Nitrogen (μg/l)<br />
Total Phosphorous<br />
(μg/l)<br />
Chlorophyll a (μg/l)<br />
Organic Nitrogen<br />
(μg/l)<br />
FRP (μg/l)<br />
CAB-1 UC 142 <strong>Caboolture</strong> Rv 8.11 0.36 90.13 2.00 0.010 0.010 0.110<br />
CAB-2 LC 142 <strong>Caboolture</strong> Rv 8.13 0.39 100.88 2.00 0.010 0.010 0.120<br />
CAB-3 LC 142 <strong>Caboolture</strong> Rv 7.83 0.47 89.60 2.00 0.010 0.010 0.140<br />
CAB-4 LC 142 <strong>Caboolture</strong> Rv 7.60 0.37 71.89 8.00 0.040 0.065 0.130<br />
CAB-5 ME 142 <strong>Caboolture</strong> Rv 7.37 17.25 66.00 18.00 0.425 0.180 0.170<br />
CAB-6 ME 142 <strong>Caboolture</strong> Rv 7.33 18.40 62.77 16.50 0.705 0.230 0.150<br />
CAB-7 ME 142 <strong>Caboolture</strong> Rv 7.38 20.75 63.38 18.50 0.540 0.240 0.180<br />
CAB-8 ME 142 <strong>Caboolture</strong> Rv 7.44 43.15 69.35 23.00 0.115 0.070 0.150<br />
LAG-1 LC 142 Lagoon Ck 6.45 0.31 33.30 8.00 0.010 0.035 0.140<br />
LAG-2 LC 142 Lagoon Ck 6.98 0.23 44.55 11.50 0.050 0.045 0.190<br />
LAG-3 LC 142 Lagoon Ck 7.00 0.22 46.84 21.00 0.095 0.175 0.200<br />
LAG-4 LC 142 Lagoon Ck 7.03 0.23 47.97 11.50 0.065 0.080 0.200<br />
LAG-5 LC 142 Lagoon Ck 6.88 0.29 45.54 14.00 0.150 0.275 0.200<br />
LAG-6 LC 142 Lagoon Ck 7.20 0.25 58.04 13.50 0.035 0.090 0.160<br />
LAG-7 LC 142 Lagoon Ck 6.62 0.21 21.25 8.50 0.010 0.055 0.110<br />
LAG-8 LC 142 Lagoon Ck 6.12 0.17 4.48 14.50 0.010 0.085 0.080<br />
SHE-1 LC 142 Sheepstation Ck 6.89 0.77 14.67 33.00 0.010 0.200<br />
SHE-2 LC 142 Sheepstation Ck 7.47 0.46 71.55 18.00 0.010 0.050 0.020 0.165<br />
SHE-3 LC 142 Sheepstation Ck 7.31 0.35 49.99 11.50 0.025 0.010 0.030 0.200<br />
SHE-4 LC 142 Sheepstation Ck 7.07 0.27 31.84 9.50 0.010 0.010 0.015 0.165<br />
WAR-1 LC 142 Wararba Ck 7.51 0.43 63.16 12.00 0.040 0.016 0.170<br />
WAR-2 LC 142 Wararba Ck 7.57 0.51 77.59 3.50 0.010 0.010 0.130<br />
WAR-3 LC 142 Wararba Ck 7.54 0.39 65.14 5.00 0.050 0.020 0.095<br />
WAR-4 LC 142 Wararba Ck 6.84 0.47 26.11 17.50 0.010 0.060 0.170<br />
WAR-5 LC 142 Wararba Ck 7.33 0.38 69.39 10.00 0.110 0.020 0.150<br />
WAR-6 LC 142 Wararba Ck 7.37 0.34 66.69 9.00 0.040 0.050 0.100<br />
Cab-0 ECLE 142 <strong>Caboolture</strong> Rv 8.10 50.70 96.0 7.0 1.3 0.002 0.003 0.265 0.041 3.02 0.245 0.017<br />
Cab-1.6 ME 142 <strong>Caboolture</strong> Rv 8.07 49.79 97.0 8.0 1.2 0.002 0.003 0.285 0.042 3.30 0.265 0.017<br />
Cab-4.8 ME 142 <strong>Caboolture</strong> Rv 7.85 46.82 87.0 8.0 0.9 0.020 0.025 0.390 0.039 4.26 0.300 0.017<br />
Cab-7.6 ME 142 <strong>Caboolture</strong> Rv 7.66 44.93 83.0 9.0 0.9 0.045 0.045 0.475 0.044 5.08 0.360 0.015<br />
Cab-9.5 ME 142 <strong>Caboolture</strong> Rv 7.53 37.75 81.0 11.0 0.8 0.090 0.047 0.545 0.050 5.28 0.435 0.018<br />
Cab-11.4 ME 142 <strong>Caboolture</strong> Rv 7.42 32.93 74.5 10.0 0.8 0.124 0.051 0.655 0.052 5.81 0.455 0.019<br />
Cab-13.4 ME 142 <strong>Caboolture</strong> Rv 7.34 25.70 69.5 11.0 0.8 0.165 0.067 0.735 0.055 8.22 0.495 0.019<br />
Cab-15.1 ME 142 <strong>Caboolture</strong> Rv 7.36 21.90 69.0 9.0 0.8 0.230 0.093 0.920 0.079 8.85 0.560 0.031<br />
Cab-17.1 UE 142 <strong>Caboolture</strong> Rv 7.35 15.76 66.5 11.0 0.8 0.430 0.107 1.150 0.110 10.38 0.605 0.053<br />
Cab-18.8 UE 142 <strong>Caboolture</strong> Rv 7.27 12.39 72.0 8.0 0.8 11.96<br />
Cab-19.9 UE 142 <strong>Caboolture</strong> Rv 7.35 9.60 87.0 8.0 0.8 0.250 0.027 0.960 0.065 18.10 0.645 0.010<br />
Cab-41 LC 142 <strong>Caboolture</strong> Rv 7.87 0.51 89.0 1.0 0.3 0.010 0.007 0.285 0.022 1.47 0.265 0.007<br />
War-0 LC 142 Wararba Creek 7.26 0.38 71.0 5.0 1.1 0.049 0.027 0.545 0.030 13.69 0.490 0.004<br />
55
Table 28. Medians for selected water quality indicators at sites in Burpengary Creek, 2001<br />
Site<br />
<strong>Water</strong><br />
Type<br />
Basin<br />
Stream<br />
Name<br />
pH<br />
Conductivity<br />
(mS/cm)<br />
Dissolved Oxygen<br />
(% sat.)<br />
Turbidity (NTU)<br />
Oxidised Nitrogen<br />
(μg/l)<br />
Ammonia (μg/l)<br />
Total phosphorous<br />
(μg/l)<br />
BUR-1 ME 142 Burpengary Ck 7.19 0.80 24.59 12.00 0.050 0.050 0.100<br />
BUR-2 LC 142 Burpengary Ck 7.24 0.84 31.30 5.00 0.040 0.070 0.120<br />
BUR-3 LC 142 Burpengary Ck 7.12 0.70 25.88 16.00 0.100 0.090 0.100<br />
BUR-4 LC 142 Burpengary Ck 7.47 1.63 53.43 22.00 0.030 0.070 0.100<br />
BUR-5 LC 142 Burpengary Ck 7.75 0.99 56.90 12.00 0.010 0.010 0.100<br />
BUR-6 LC 142 Burpengary Ck 8.06 0.78 69.29 4.00 0.015 0.010 0.120<br />
Table 29. Medians for selected water quality indicators at sites in Saltwater Creek, 2001<br />
Site<br />
<strong>Water</strong><br />
Type<br />
Basin<br />
Stream<br />
Name<br />
pH<br />
Conductivity<br />
(mS/cm)<br />
Dissolved Oxygen<br />
(% sat.)<br />
Turbidity (NTU)<br />
Oxidised Nitrogen<br />
(μg/l)<br />
Ammonia (μg/l)<br />
Total phosphorous<br />
(μg/l)<br />
SAL-1 LC 142 Saltwater Ck 6.71 0.42 14.40 26.00 0.010 0.020 0.170<br />
SAL-2 LC 142 Saltwater Ck 6.29 0.50 14.36 77.00 0.010 0.400 0.320<br />
SAL-3 LC 142 Saltwater Ck 7.32 0.26 72.60 48.50 0.044 0.110 0.250<br />
SAL-4 LC 142 Saltwater Ck 6.97 2.17 23.70 41.00 0.010 0.090 0.320<br />
SAL-5 LC 142 Saltwater Ck 7.06 0.26 53.67 10.00 0.030 0.060 0.180<br />
SAL-6 LC 142 Saltwater Ck 7.10 1.32 24.40 46.50 1.300 1.900 0.680<br />
SAL-7 LC 142 Saltwater Ck 7.12 0.67 32.43 36.50 0.160 1.210 0.390<br />
SAL-8 LC 142 Saltwater Ck 6.84 0.43 26.25 44.00 0.010 0.100 0.210<br />
SAL-9 LC 142 Saltwater Ck 7.11 0.37 54.74 66.00 0.010 0.010 0.160<br />
Table 30. Medians for selected water quality indicators at sites in Deception <strong>Bay</strong>, 2001<br />
Site<br />
<strong>Water</strong><br />
Type<br />
Basin<br />
Stream Name<br />
pH<br />
Conductivity<br />
(mS/cm)<br />
Dissolved Oxygen<br />
(% sat.)<br />
Turbidity (NTU)<br />
Secchi (m)<br />
Oxidised Nitrogen<br />
(μg/l)<br />
Ammonia (μg/l)<br />
Total Nitrogen (μg/l)<br />
Total phosphorous<br />
(μg/l)<br />
Chlorophyll a (μg/l)<br />
Organic Nitrogen<br />
(μg/l)<br />
FRP (μg/l)<br />
Dec-a ECLE 143 Deception <strong>Bay</strong> 8.22 52.98 100.0 4.0 1.7 0.002 0.002 0.185 0.027 1.87 0.175 0.010<br />
Dec-c ECLE 143 Deception <strong>Bay</strong> 8.21 53.68 102.0 1.5 2.4 0.002 0.002 0.150 0.019 1.67 0.140 0.008<br />
Dec-d ECLE 143 Deception <strong>Bay</strong> 8.21 52.92 101.0 4.0 1.6 0.002 0.002 0.185 0.033 2.56 0.175 0.015<br />
Dec-j ECLE 143 Deception <strong>Bay</strong> 8.19 52.70 100.0 6.0 1.4 0.002 0.002 0.205 0.041 2.54 0.195 0.019<br />
Dec-l ECLE 143 Deception <strong>Bay</strong> 8.15 52.27 100.0 6.0 1.1 0.002 0.002 0.240 0.043 3.87 0.230 0.016<br />
Dec-m ECLE 143 Deception <strong>Bay</strong> 8.07 51.92 98.0 7.0 1.3 2.72<br />
Dec-r ECLE 143 Deception <strong>Bay</strong> 8.20 53.55 101.0 4.0 1.7 0.002 0.002 0.165 0.028 2.00 0.150 0.014<br />
Dec-u ECLE 143 Deception <strong>Bay</strong> 8.21 53.24 100.0 6.5 1.2 0.002 0.002 0.190 0.033 3.52 0.180 0.020<br />
Dec-v ECLE 143 Deception <strong>Bay</strong> 8.23 53.44 104.0 5.0 1.4 0.002 0.002 0.180 0.033 3.03 0.170 0.017<br />
Dec-x ECLE 143 Deception <strong>Bay</strong> 8.19 53.48 102.0 5.0 1.7 0.002 0.002 0.175 0.041 2.47 0.160 0.020<br />
Dec-y ECLE 143 Deception <strong>Bay</strong> 8.24 53.28 107.0 6.0 1.2 0.002 0.002 0.215 0.046 2.40 0.205 0.024<br />
56
C3: Box plots - Northern Creeks (PRCMP DATA)<br />
Bells Creek and Lamerough Canals, 2000<br />
Figure 1a pH at sites in Bells Ck and Lamerough Cnl<br />
9<br />
8<br />
pH<br />
7<br />
6<br />
(N=8) (N=8) (N=9) (N=17) (N=16) (N=16) (N=9) (N=673) (N=453)<br />
BE-a BE-b BE-c BE-d BE-e BE-f LC-a ECLE ME<br />
Monitoring Sites<br />
Reference Sites<br />
Figure 1b Conductivity at sites in Bells Ck and Lamerough Cnl<br />
80<br />
Conductivity (mS/cm)<br />
60<br />
40<br />
20<br />
0<br />
(N=6) (N=8) (N=7) (N=15) (N=14) (N=14) (N=9) (N=671) (N=452)<br />
BE-a BE-b BE-c BE-d BE-e BE-f LC-a ECLE ME<br />
Monitoring Sites<br />
Reference Sites<br />
Figure 1c Dissolved oxygen at sites in Bells Ck and Lamerough Cnl<br />
100<br />
Dissolved oxygen (% saturation)<br />
80<br />
60<br />
40<br />
20<br />
(N=8) (N=8) (N=9) (N=17) (N=16) (N=16) (N=9) (N=663) (N=450)<br />
BE-a BE-b BE-c BE-d BE-e BE-f LC-a ECLE ME<br />
Monitoring Sites<br />
Reference Sites<br />
57
C3: Box plots - Northern Creeks (PRCMP DATA) (Cont.)<br />
Bells Creek and Lamerough Canals, 2000<br />
Figure 1d Turbidity at sites in Bells Ck and Lamerough Cnl<br />
80<br />
Turbidity (NTU)<br />
60<br />
40<br />
20<br />
0<br />
(N=8) (N=8) (N=9) (N=17) (N=16) (N=16) (N=9) (N=656) (N=440)<br />
BE-a BE-b BE-c BE-d BE-e BE-f LC-a ECLE ME<br />
Monitoring Sites<br />
Reference Sites<br />
Figure 1e Secchi depth at sites in Bells Ck and Lamerough Cnl<br />
4<br />
3<br />
Secchi depth (m)<br />
2<br />
1<br />
0<br />
(N=7) (N=7) (N=8) (N=16) (N=15) (N=15) (N=9) (N=674) (N=454)<br />
BE-a BE-b BE-c BE-d BE-e BE-f LC-a ECLE ME<br />
Monitoring Sites<br />
Reference Sites<br />
0.08<br />
Figure 1f Nitrate plus nitrite at sites in Bells Ck and Lamerough Cnl<br />
Nitrate plus nitrite (mg N/L)<br />
0.06<br />
0.04<br />
0.02<br />
0.00<br />
(N=10) (N=0) (N=0) (N=0) (N=0) (N=9) (N=0) (N=437) (N=481)<br />
BE-a BE-b BE-c BE-d BE-e BE-f LC-a ECLE ME<br />
Monitoring Sites<br />
Reference Sites<br />
58
C3: Box plots - Northern Creeks (PRCMP DATA) (Cont.)<br />
Bells Creek and Lamerough Canals, 2000<br />
0.04<br />
Figure 1g Ammonia at sites in Bells Ck and Lamerough Cnl<br />
0.03<br />
Ammonia (mg N/L)<br />
0.02<br />
0.01<br />
0.00<br />
(N=10) (N=0) (N=0) (N=0) (N=0) (N=9) (N=0) (N=437) (N=481)<br />
BE-a BE-b BE-c BE-d BE-e BE-f LC-a ECLE ME<br />
Monitoring Sites<br />
Reference Sites<br />
Figure 1h Total nitrogen at sites in Bells Ck and Lamerough Cnl<br />
0.6<br />
Total nitrogen (mg N/L)<br />
0.4<br />
0.2<br />
0.0<br />
(N=10) (N=0) (N=0) (N=0) (N=0) (N=9) (N=0) (N=436) (N=481)<br />
BE-a BE-b BE-c BE-d BE-e BE-f LC-a ECLE ME<br />
Monitoring Sites<br />
Reference Sites<br />
0.06<br />
Figure 1i Total phosphorus at sites in Bells Ck and Lamerough Cnl<br />
0.05<br />
Total phosphorus (mg P/L)<br />
0.04<br />
0.03<br />
0.02<br />
0.01<br />
0.00<br />
(N=10) (N=0) (N=0) (N=0) (N=0) (N=9) (N=0) (N=437) (N=481)<br />
BE-a BE-b BE-c BE-d BE-e BE-f LC-a ECLE ME<br />
Monitoring Sites<br />
Reference Sites<br />
59
C3: Box plots - Northern Creeks (PRCMP DATA) (Cont.)<br />
Bells Creek and Lamerough Canals, 2000<br />
Figure 1j Filterable reactive phosphorus at sites in Bells Ck and Lamerough Cnl<br />
0.025<br />
Filterable reactive phosphorus (mg P/L)<br />
0.020<br />
0.015<br />
0.010<br />
0.005<br />
0.000<br />
(N=10) (N=0) (N=0) (N=0) (N=0) (N=9) (N=0) (N=437) (N=481)<br />
BE-a BE-b BE-c BE-d BE-e BE-f LC-a ECLE ME<br />
Monitoring Sites<br />
Reference Sites<br />
60
C3: Box plots - Northern Creeks (PRCMP DATA) (Cont.)<br />
Coochin and Mellum Creeks, 2000<br />
Figure 2a pH at sites in Coochin and Mellum Cks<br />
9.0<br />
8.5<br />
8.0<br />
pH<br />
7.5<br />
7.0<br />
6.5<br />
6.0<br />
(N=16) (N=16) (N=15) (N=16) (N=453)<br />
CO-a CO-b CO-c ML-b ME<br />
Monitoring Sites<br />
Reference Sites<br />
Figure 2b Conductivity at sites in Coochin and Mellum Cks<br />
80<br />
Conductivity (mS/cm)<br />
60<br />
40<br />
20<br />
0<br />
(N=14) (N=15) (N=13) (N=14) (N=452)<br />
CO-a CO-b CO-c ML-b ME<br />
Monitoring Sites<br />
Reference Sites<br />
Figure 2c Dissolved oxygen at sites in Coochin and Mellum Cks<br />
100<br />
Dissolved oxygen (% saturation)<br />
90<br />
80<br />
70<br />
60<br />
50<br />
(N=16) (N=16) (N=15) (N=16) (N=450)<br />
CO-a CO-b CO-c ML-b ME<br />
Monitoring Sites<br />
Reference Sites<br />
61
C3: Box plots - Northern Creeks (PRCMP DATA) (Cont.)<br />
Coochin and Mellum Creeks, 2000<br />
Figure 2d Turbidity at sites in Coochin and Mellum Cks<br />
25<br />
20<br />
Turbidity (NTU)<br />
15<br />
10<br />
5<br />
0<br />
(N=16) (N=16) (N=15) (N=16) (N=440)<br />
CO-a CO-b CO-c ML-b ME<br />
Monitoring Sites<br />
Reference Sites<br />
Figure 2e Secchi depth at sites in Coochin and Mellum Cks<br />
3.0<br />
2.5<br />
Secchi depth (m)<br />
2.0<br />
1.5<br />
1.0<br />
0.5<br />
0.0<br />
(N=15) (N=16) (N=14) (N=15) (N=454)<br />
CO-a CO-b CO-c ML-b ME<br />
Monitoring Sites<br />
Reference Sites<br />
Figure 2f Nitrate plus nitrite at sites in Coochin and Mellum Cks<br />
2.0<br />
Nitrate plus nitrite (mg N/L)<br />
1.5<br />
1.0<br />
0.5<br />
0.0<br />
(N=7) (N=0) (N=1) (N=1) (N=481)<br />
CO-a CO-b CO-c ML-b ME<br />
Monitoring Sites<br />
Reference Sites<br />
62
C3: Box plots - Northern Creeks (PRCMP DATA) (Cont.)<br />
Coochin and Mellum Creeks, 2000<br />
Figure 2g Ammonia at sites in Coochin and Mellum Cks<br />
0.08<br />
Ammonia (mg N/L)<br />
0.06<br />
0.04<br />
0.02<br />
0.00<br />
(N=7) (N=0) (N=1) (N=1) (N=481)<br />
CO-a CO-b CO-c ML-b ME<br />
Monitoring Sites<br />
Reference Sites<br />
Figure 2h Total nitrogen at sites in Coochin and Mellum Cks<br />
2.5<br />
Total nitrogen (mg N/L)<br />
2.0<br />
1.5<br />
1.0<br />
0.5<br />
0.0<br />
(N=7) (N=0) (N=1) (N=1) (N=481)<br />
CO-a CO-b CO-c ML-b ME<br />
Monitoring Sites<br />
Reference Sites<br />
Figure 2i Total phosphorus at sites in Coochin and Mellum Cks<br />
0.05<br />
Total phosphorus (mg P/L)<br />
0.04<br />
0.03<br />
0.02<br />
0.01<br />
0.00<br />
(N=7) (N=0) (N=1) (N=1) (N=481)<br />
CO-a CO-b CO-c ML-b ME<br />
Monitoring Sites<br />
Reference Sites<br />
63
C3: Box plots - Northern Creeks (PRCMP DATA) (Cont.)<br />
Coochin and Mellum Creeks, 2000<br />
Figure 2j Filterable reactive phosphorus at sites in Coochin and Mellum Cks<br />
Filterable reactive phosphorus (mg P/L)<br />
0.020<br />
0.015<br />
0.010<br />
0.005<br />
0.000<br />
(N=7) (N=0) (N=1) (N=1) (N=481)<br />
CO-a CO-b CO-c ML-b ME<br />
Monitoring Sites<br />
Reference Sites<br />
64
C3: Box plots - Northern Creeks (PRCMP DATA) (Cont.)<br />
Hussey and Saltwater Creeks, 2000<br />
Figure 3a pH at sites in Hussey and Saltwater Cks<br />
9.0<br />
8.5<br />
8.0<br />
pH<br />
7.5<br />
7.0<br />
6.5<br />
(N=16) (N=16) (N=2) (N=15) (N=453)<br />
HU-a HU-b SW-a SW-b ME<br />
Monitoring Sites<br />
Reference Sites<br />
Figure 3b Conductivity at sites in Hussey and Saltwater Cks<br />
80<br />
Conductivity (mS/cm)<br />
60<br />
40<br />
20<br />
0<br />
(N=14) (N=14) (N=2) (N=13) (N=452)<br />
HU-a HU-b SW-a SW-b ME<br />
Monitoring Sites<br />
Reference Sites<br />
Figure 3c Dissolved oxygen at sites in Hussey and Saltwater Cks<br />
100<br />
Dissolved oxygen (% saturation)<br />
90<br />
80<br />
70<br />
60<br />
50<br />
(N=16) (N=16) (N=2) (N=15) (N=450)<br />
HU-a HU-b SW-a SW-b ME<br />
Monitoring Sites<br />
Reference Sites<br />
65
C3: Box plots - Northern Creeks (PRCMP DATA) (Cont.)<br />
Hussey and Saltwater Creeks, 2000<br />
Figure 3d Turbidity at sites in Hussey and Saltwater Cks<br />
20<br />
15<br />
Turbidity (NTU)<br />
10<br />
5<br />
0<br />
(N=16) (N=16) (N=2) (N=15) (N=440)<br />
HU-a HU-b SW-a SW-b ME<br />
Monitoring Sites<br />
Reference Sites<br />
Figure 3e Secchi depth at sites in Hussey and Saltwater Cks<br />
3.0<br />
2.5<br />
Secchi depth (m)<br />
2.0<br />
1.5<br />
1.0<br />
0.5<br />
0.0<br />
(N=15) (N=15) (N=1) (N=13) (N=454)<br />
HU-a HU-b SW-a SW-b ME<br />
Monitoring Sites<br />
Reference Sites<br />
Figure 3f Nitrate plus nitrite at sites in Hussey and Saltwater Cks<br />
0.20<br />
Nitrate plus nitrite (mg N/L)<br />
0.15<br />
0.10<br />
0.05<br />
0.00<br />
(N=8) (N=0) (N=3) (N=0) (N=481)<br />
HU-a HU-b SW-a SW-b ME<br />
Monitoring Sites<br />
Reference Sites<br />
66
C3: Box plots - Northern Creeks (PRCMP DATA) (Cont.)<br />
Hussey and Saltwater Creeks, 2000<br />
Figure 3g Ammonia at sites in Hussey and Saltwater Cks<br />
0.06<br />
Ammonia (mg N/L)<br />
0.04<br />
0.02<br />
0.00<br />
(N=8) (N=0) (N=3) (N=0) (N=481)<br />
HU-a HU-b SW-a SW-b ME<br />
Monitoring Sites<br />
Reference Sites<br />
Figure 3h Total nitrogen at sites in Hussey and Saltwater Cks<br />
0.6<br />
Total nitrogen (mg N/L)<br />
0.4<br />
0.2<br />
0.0<br />
(N=8) (N=0) (N=3) (N=0) (N=481)<br />
HU-a HU-b SW-a SW-b ME<br />
Monitoring Sites<br />
Reference Sites<br />
Figure 3i Total phosphorus at sites in Hussey and Saltwater Cks<br />
0.05<br />
Total phosphorus (mg P/L)<br />
0.04<br />
0.03<br />
0.02<br />
0.01<br />
0.00<br />
(N=8) (N=0) (N=3) (N=0) (N=481)<br />
HU-a HU-b SW-a SW-b ME<br />
Monitoring Sites<br />
Reference Sites<br />
67
C3: Box plots - Northern Creeks (PRCMP DATA) (Cont.)<br />
Hussey and Saltwater Creeks, 2000<br />
Figure 3j Filterable reactive phosphorus at sites in Hussey and Saltwater Cks<br />
Filterable reactive phosphorus (mg P/L)<br />
0.020<br />
0.015<br />
0.010<br />
0.005<br />
0.000<br />
(N=8) (N=0) (N=3) (N=0) (N=481)<br />
HU-a HU-b SW-a SW-b ME<br />
Monitoring Sites<br />
Reference Sites<br />
68
C3: Box plots - Northern Creeks (PRCMP DATA) (Cont.)<br />
Glass Mountain, Bullock and Ningi Creeks, 2000<br />
9.0<br />
Figure 4a pH at sites in Glass Mountain, Bullock and Ningi Cks<br />
8.5<br />
8.0<br />
pH<br />
7.5<br />
7.0<br />
6.5<br />
6.0<br />
(N=7) (N=15) (N=7) (N=4) (N=8) (N=16) (N=8) (N=8) (N=16) (N=673) (N=453)<br />
BU-a BU-b BU-c BU-d GM-a GM-b NG-a NG-b NG-c ECLE ME<br />
Monitoring Sites<br />
Reference Sites<br />
Figure 4b Conductivity at sites in Glass Mountain, Bullock and Ningi Cks<br />
80<br />
Conductivity (mS/cm)<br />
60<br />
40<br />
20<br />
0<br />
(N=7) (N=15) (N=7) (N=4) (N=7) (N=15) (N=8) (N=8) (N=16) (N=671) (N=452)<br />
BU-a BU-b BU-c BU-d GM-a GM-b NG-a NG-b NG-c ECLE ME<br />
Monitoring Sites<br />
Reference Sites<br />
Figure 4c Dissolved oxygen at sites in Glass Mountain, Bullock and Ningi Cks<br />
120<br />
Dissolved oxygen (% saturation)<br />
100<br />
80<br />
60<br />
40<br />
(N=7) (N=15) (N=7) (N=4) (N=7) (N=15) (N=8) (N=8) (N=16) (N=663) (N=450)<br />
BU-a BU-b BU-c BU-d GM-a GM-b NG-a NG-b NG-c ECLE ME<br />
Monitoring Sites<br />
Reference Sites<br />
69
C3: Box plots - Northern Creeks (PRCMP DATA) (Cont.)<br />
Glass Mountain, Bullock and Ningi Creeks, 2000<br />
60<br />
Figure 4d Turbidity at sites in Glass Mountain, Bullock and Ningi Cks<br />
50<br />
Turbidity (NTU)<br />
40<br />
30<br />
20<br />
10<br />
0<br />
(N=8) (N=16) (N=8) (N=4) (N=8) (N=16) (N=9) (N=8) (N=17) (N=656) (N=440)<br />
BU-a BU-b BU-c BU-d GM-a GM-b NG-a NG-b NG-c ECLE ME<br />
Monitoring Sites<br />
Reference Sites<br />
Figure 4e Secchi depth at sites in Glass Mountain, Bullock and Ningi Cks<br />
6<br />
Secchi depth (m)<br />
4<br />
2<br />
0<br />
(N=7) (N=15) (N=7) (N=4) (N=7) (N=15) (N=8) (N=8) (N=16) (N=674) (N=454)<br />
BU-a BU-b BU-c BU-d GM-a GM-b NG-a NG-b NG-c ECLE ME<br />
Monitoring Sites<br />
Reference Sites<br />
Figure 4f Nitrate plus nitrite at sites in Glass Mountain, Bullock and Ningi Cks<br />
0.025<br />
Nitrate plus nitrite (mg N/L)<br />
0.020<br />
0.015<br />
0.010<br />
0.005<br />
0.000<br />
(N=11) (N=11) (N=12) (N=0) (N=11) (N=0) (N=11) (N=0) (N=0) (N=437) (N=481)<br />
BU-a BU-b BU-c BU-d GM-a GM-b NG-a NG-b NG-c ECLE ME<br />
Monitoring Sites<br />
Reference Sites<br />
70
C3: Box plots - Northern Creeks (PRCMP DATA) (Cont.)<br />
Glass Mountain, Bullock and Ningi Creeks, 2000<br />
0.05<br />
Figure 4g Ammonia at sites in Glass Mountain, Bullock and Ningi Cks<br />
0.04<br />
Ammonia (mg N/L)<br />
0.03<br />
0.02<br />
0.01<br />
0.00<br />
(N=11) (N=11) (N=12) (N=0) (N=11) (N=0) (N=11) (N=0) (N=0) (N=437) (N=481)<br />
BU-a BU-b BU-c BU-d GM-a GM-b NG-a NG-b NG-c ECLE ME<br />
Monitoring Sites<br />
Reference Sites<br />
Figure 4h Total nitrogen at sites in Glass Mountain, Bullock and Ningi Cks<br />
0.6<br />
Total nitrogen (mg N/L)<br />
0.4<br />
0.2<br />
0.0<br />
(N=11) (N=11) (N=12) (N=0) (N=11) (N=0) (N=11) (N=0) (N=0) (N=436) (N=481)<br />
BU-a BU-b BU-c BU-d GM-a GM-b NG-a NG-b NG-c ECLE ME<br />
Monitoring Sites<br />
Reference Sites<br />
0.06<br />
Figure 4i Total phosphorus at sites in Glass Mountain, Bullock and Ningi Cks<br />
0.05<br />
Total phosphorus (mg P/L)<br />
0.04<br />
0.03<br />
0.02<br />
0.01<br />
0.00<br />
(N=11) (N=11) (N=12) (N=0) (N=11) (N=0) (N=11) (N=0) (N=0) (N=437) (N=481)<br />
BU-a BU-b BU-c BU-d GM-a GM-b NG-a NG-b NG-c ECLE ME<br />
Monitoring Sites<br />
Reference Sites<br />
71
C3: Box plots - Northern Creeks (PRCMP DATA) (Cont.)<br />
Glass Mountain, Bullock and Ningi Creeks, 2000<br />
0.14<br />
Figure 4j Filterable reactive phosphorus at sites in Glass Mountain, Bullock and Ningi Cks<br />
Filterable reactive phosphorus (mg P/L)<br />
0.12<br />
0.10<br />
0.08<br />
0.06<br />
0.04<br />
0.02<br />
0.00<br />
(N=11) (N=11) (N=12) (N=0) (N=11) (N=0) (N=11) (N=0) (N=0) (N=437) (N=481)<br />
BU-a BU-b BU-c BU-d GM-a GM-b NG-a NG-b NG-c ECLE ME<br />
Monitoring Sites<br />
Reference Sites<br />
72
C3: Box plots - Northern Creeks (PRCMP DATA) (Cont.)<br />
Elimbah Creek, 2000<br />
Figure 5a pH at sites in Elimbah Ck<br />
9.0<br />
8.5<br />
8.0<br />
pH<br />
7.5<br />
7.0<br />
6.5<br />
6.0<br />
(N=9) (N=8) (N=15) (N=16) (N=6) (N=6) (N=453) (N=158)<br />
EL-a EL-b EL-c EL-d EL-e EL-f ME UE<br />
Monitoring Sites<br />
Reference Sites<br />
Figure 5b Conductivity at sites in Elimbah Ck<br />
80<br />
Conductivity (mS/cm)<br />
60<br />
40<br />
20<br />
0<br />
(N=7) (N=8) (N=13) (N=14) (N=6) (N=6) (N=452) (N=159)<br />
EL-a EL-b EL-c EL-d EL-e EL-f ME UE<br />
Monitoring Sites<br />
Reference Sites<br />
Figure 5c Dissolved oxygen at sites in Elimbah Ck<br />
Dissolved oxygen (% saturation)<br />
100<br />
80<br />
60<br />
(N=8) (N=8) (N=14) (N=15) (N=6) (N=6) (N=450) (N=158)<br />
EL-a EL-b EL-c EL-d EL-e EL-f ME UE<br />
Monitoring Sites<br />
Reference Sites<br />
73
C3: Box plots - Northern Creeks (PRCMP DATA) (Cont.)<br />
Elimbah Creek, 2000<br />
Figure 5d Turbidity at sites in Elimbah Ck<br />
30<br />
Turbidity (NTU)<br />
20<br />
10<br />
0<br />
(N=9) (N=8) (N=15) (N=16) (N=6) (N=6) (N=440) (N=153)<br />
EL-a EL-b EL-c EL-d EL-e EL-f ME UE<br />
Monitoring Sites<br />
Reference Sites<br />
Figure 5e Secchi depth at sites in Elimbah Ck<br />
3.0<br />
2.5<br />
Secchi depth (m)<br />
2.0<br />
1.5<br />
1.0<br />
0.5<br />
0.0<br />
(N=7) (N=8) (N=14) (N=15) (N=6) (N=5) (N=454) (N=160)<br />
EL-a EL-b EL-c EL-d EL-e EL-f ME UE<br />
Monitoring Sites<br />
Reference Sites<br />
Figure 5f Nitrate plus nitrite at sites in Elimbah Ck<br />
0.6<br />
Nitrate plus nitrite (mg N/L)<br />
0.4<br />
0.2<br />
0.0<br />
(N=10) (N=0) (N=0) (N=0) (N=0) (N=0) (N=481) (N=79)<br />
EL-a EL-b EL-c EL-d EL-e EL-f ME UE<br />
Monitoring Sites<br />
Reference Sites<br />
74
C3: Box plots - Northern Creeks (PRCMP DATA) (Cont.)<br />
Elimbah Creek, 2000<br />
Figure 5g Ammonia at sites in Elimbah Ck<br />
0.15<br />
Ammonia (mg N/L)<br />
0.10<br />
0.05<br />
0.00<br />
(N=10) (N=0) (N=0) (N=0) (N=0) (N=0) (N=481) (N=79)<br />
EL-a EL-b EL-c EL-d EL-e EL-f ME UE<br />
Monitoring Sites<br />
Reference Sites<br />
Figure 5h Total nitrogen at sites in Elimbah Ck<br />
1.2<br />
1.0<br />
Total nitrogen (mg N/L)<br />
0.8<br />
0.6<br />
0.4<br />
0.2<br />
0.0<br />
(N=10) (N=0) (N=0) (N=0) (N=0) (N=0) (N=481) (N=79)<br />
EL-a EL-b EL-c EL-d EL-e EL-f ME UE<br />
Monitoring Sites<br />
Reference Sites<br />
Figure 5i Total phosphorus at sites in Elimbah Ck<br />
0.10<br />
Total phosphorus (mg P/L)<br />
0.08<br />
0.06<br />
0.04<br />
0.02<br />
0.00<br />
(N=10) (N=0) (N=0) (N=0) (N=0) (N=0) (N=481) (N=79)<br />
EL-a EL-b EL-c EL-d EL-e EL-f ME UE<br />
Monitoring Sites<br />
Reference Sites<br />
75
C3: Box plots - Northern Creeks (PRCMP DATA) (Cont.)<br />
Elimbah Creek, 2000<br />
Figure 5j Filterable reactive phosphorus at sites in Elimbah Ck<br />
Filterable reactive phosphorus (mg P/L)<br />
0.03<br />
0.02<br />
0.01<br />
0.00<br />
(N=10) (N=0) (N=0) (N=0) (N=0) (N=0) (N=481) (N=79)<br />
EL-a EL-b EL-c EL-d EL-e EL-f ME UE<br />
Monitoring Sites<br />
Reference Sites<br />
76
C4: Box plots – Bribie Island (CSC DATA)<br />
Bribie Canals, 2001<br />
Figure 6a 1a pH at sites in Bribie Canals<br />
8.5<br />
8.0<br />
pH<br />
7.5<br />
7.0<br />
6.5<br />
(N=9) (N=9) (N=9) (N=9) (N=9) (N=9) (N=9) (N=9) (N=673) (N=271)<br />
BRI-1 BRI-2 BRI-3 BRI-4 BRI-5 BRI-6 BRI-7 BRI-8 ECLE LC<br />
Monitoring Sites<br />
Reference Sites<br />
Figure 6b 1b Conductivity at sites in Bribie Canals<br />
60<br />
50<br />
Conductivity (mS/cm)<br />
40<br />
30<br />
20<br />
10<br />
0<br />
(N=9) (N=9) (N=9) (N=9) (N=9) (N=9) (N=9) (N=9) (N=671) (N=272)<br />
BRI-1 BRI-2 BRI-3 BRI-4 BRI-5 BRI-6 BRI-7 BRI-8 ECLE LC<br />
Monitoring Sites<br />
Reference Sites<br />
Figure 6c 1c Dissolved oxygen at sites in Bribie Canals<br />
140<br />
Dissolved oxygen (% saturation)<br />
120<br />
100<br />
80<br />
60<br />
40<br />
20<br />
(N=9) (N=9) (N=9) (N=9) (N=9) (N=9) (N=9) (N=9) (N=663) (N=269)<br />
BRI-1 BRI-2 BRI-3 BRI-4 BRI-5 BRI-6 BRI-7 BRI-8 ECLE LC<br />
Monitoring Sites<br />
Reference Sites<br />
77
C4: Box plots – Bribie Island (CSC DATA) (Cont.)<br />
Bribie Canals, 2001<br />
Figure 1d 6d Turbidity at sites in Bribie Canals<br />
60<br />
50<br />
Turbidity (NTU)<br />
40<br />
30<br />
20<br />
10<br />
0<br />
(N=9) (N=9) (N=9) (N=9) (N=9) (N=9) (N=9) (N=9) (N=656) (N=261)<br />
BRI-1 BRI-2 BRI-3 BRI-4 BRI-5 BRI-6 BRI-7 BRI-8 ECLE LC<br />
Monitoring Sites<br />
Reference Sites<br />
Figure 1e 6e Secchi depth at sites in Bribie Canals<br />
3<br />
Secchi depth (m)<br />
2<br />
1<br />
0<br />
(N=8) (N=9) (N=7) (N=0) (N=8) (N=8) (N=7) (N=0) (N=674) (N=242)<br />
BRI-1 BRI-2 BRI-3 BRI-4 BRI-5 BRI-6 BRI-7 BRI-8 ECLE LC<br />
Monitoring Sites<br />
Reference Sites<br />
0.10<br />
Figure 1f 6f Nitrate plus nitrite at sites in Bribie Canals<br />
Nitrate plus nitrite (mg N/L)<br />
0.08<br />
0.06<br />
0.04<br />
0.02<br />
0.00<br />
(N=9) (N=9) (N=9) (N=9) (N=9) (N=9) (N=9) (N=9) (N=437) (N=276)<br />
BRI-1 BRI-2 BRI-3 BRI-4 BRI-5 BRI-6 BRI-7 BRI-8 ECLE LC<br />
Monitoring Sites<br />
Reference Sites<br />
78
C4: Box plots – Bribie Island (CSC DATA) (Cont.)<br />
Bribie Canals, 2001<br />
Figure 1g 6g Ammonia at sites in Bribie Canals<br />
0.08<br />
Ammonia (mg N/L)<br />
0.06<br />
0.04<br />
0.02<br />
0.00<br />
(N=3) (N=3) (N=3) (N=3) (N=3) (N=3) (N=3) (N=3) (N=437) (N=276)<br />
BRI-1 BRI-2 BRI-3 BRI-4 BRI-5 BRI-6 BRI-7 BRI-8 ECLE LC<br />
Monitoring Sites<br />
Reference Sites<br />
Figure 1h 6h Total nitrogen at sites in Bribie Canals<br />
1.4<br />
1.2<br />
Total nitrogen (mg N/L)<br />
1.0<br />
0.8<br />
0.6<br />
0.4<br />
0.2<br />
0.0<br />
(N=8) (N=8) (N=8) (N=8) (N=8) (N=8) (N=8) (N=8) (N=436) (N=276)<br />
BRI-1 BRI-2 BRI-3 BRI-4 BRI-5 BRI-6 BRI-7 BRI-8 ECLE LC<br />
Monitoring Sites<br />
Reference Sites<br />
Figure 1i 6i Total phosphorus at sites in Bribie Canals<br />
0.8<br />
Total phosphorus (mg P/L)<br />
0.6<br />
0.4<br />
0.2<br />
0.0<br />
(N=9) (N=9) (N=9) (N=9) (N=9) (N=9) (N=9) (N=9) (N=437) (N=276)<br />
BRI-1 BRI-2 BRI-3 BRI-4 BRI-5 BRI-6 BRI-7 BRI-8 ECLE LC<br />
Monitoring Sites<br />
Reference Sites<br />
79
C4: Box plots – Bribie Island (CSC DATA) (Cont.)<br />
Bribie Canals, 2001<br />
Figure 6j 1j Chlorophyll-a at sites in Bribie Canals<br />
15<br />
Chlorophyll-a (μg/L)<br />
10<br />
5<br />
0<br />
(N=7) (N=7) (N=7) (N=7) (N=6) (N=7) (N=7) (N=7) (N=676) (N=254)<br />
BRI-1 BRI-2 BRI-3 BRI-4 BRI-5 BRI-6 BRI-7 BRI-8 ECLE LC<br />
Monitoring Sites<br />
Reference Sites<br />
80
C4: Box plots – Bribie Island (CSC DATA) (Cont.)<br />
Shirley Creek, 2001<br />
Figure 7a 2a pH at sites in Shirley Ck<br />
9.0<br />
8.5<br />
8.0<br />
pH<br />
7.5<br />
7.0<br />
6.5<br />
(N=8) (N=9) (N=9) (N=9) (N=453) (N=158)<br />
SHI-1 SHI-2 SHI-3 SHI-4 ME UE<br />
Monitoring Sites<br />
Reference Sites<br />
Figure 7b 2b Conductivity at sites in Shirley Ck<br />
80<br />
Conductivity (mS/cm)<br />
60<br />
40<br />
20<br />
0<br />
(N=8) (N=9) (N=9) (N=9) (N=452) (N=159)<br />
SHI-1 SHI-2 SHI-3 SHI-4 ME UE<br />
Monitoring Sites<br />
Reference Sites<br />
Figure 7c 2c Dissolved oxygen at sites in Shirley Ck<br />
Dissolved oxygen (% saturation)<br />
100<br />
80<br />
60<br />
40<br />
20<br />
(N=8) (N=9) (N=9) (N=9) (N=450) (N=158)<br />
SHI-1 SHI-2 SHI-3 SHI-4 ME UE<br />
Monitoring Sites<br />
Reference Sites<br />
81
C4: Box plots – Bribie Island (CSC DATA) (Cont.)<br />
Shirley Creek, 2001<br />
Figure 7d 2d Turbidity at sites in Shirley Ck<br />
200<br />
150<br />
Turbidity (NTU)<br />
100<br />
50<br />
0<br />
(N=8) (N=9) (N=9) (N=9) (N=440) (N=153)<br />
SHI-1 SHI-2 SHI-3 SHI-4 ME UE<br />
Monitoring Sites<br />
Reference Sites<br />
Figure 7e 2f Nitrate plus nitrite at sites in Shirley Ck<br />
0.4<br />
Nitrate plus nitrite (mg N/L)<br />
0.3<br />
0.2<br />
0.1<br />
0.0<br />
(N=8) (N=9) (N=9) (N=9) (N=481) (N=79)<br />
SHI-1 SHI-2 SHI-3 SHI-4 ME UE<br />
Monitoring Sites<br />
Reference Sites<br />
82
C4: Box plots – Bribie Island (CSC DATA) (Cont.)<br />
Shirley Creek, 2001<br />
Figure 7f 2g Ammonia at sites in Shirley Ck<br />
1.2<br />
1.0<br />
Ammonia (mg N/L)<br />
0.8<br />
0.6<br />
0.4<br />
0.2<br />
0.0<br />
(N=3) (N=4) (N=4) (N=4) (N=481) (N=79)<br />
SHI-1 SHI-2 SHI-3 SHI-4 ME UE<br />
Monitoring Sites<br />
Reference Sites<br />
Figure 7g 2h Total nitrogen at sites in Shirley Ck<br />
1.5<br />
Total nitrogen (mg N/L)<br />
1.0<br />
0.5<br />
0.0<br />
(N=7) (N=8) (N=8) (N=8) (N=481) (N=79)<br />
SHI-1 SHI-2 SHI-3 SHI-4 ME UE<br />
Monitoring Sites<br />
Reference Sites<br />
Figure 7h 2i Total phosphorus at sites in Shirley Ck<br />
3.0<br />
2.5<br />
Total phosphorus (mg P/L)<br />
2.0<br />
1.5<br />
1.0<br />
0.5<br />
0.0<br />
(N=8) (N=9) (N=9) (N=9) (N=481) (N=79)<br />
SHI-1 SHI-2 SHI-3 SHI-4 ME UE<br />
Monitoring Sites<br />
Reference Sites<br />
83
C4: Box plots – Bribie Island (CSC DATA) (Cont.)<br />
Shirley Creek, 2001<br />
Figure 7i 2g Ammonia at sites in Shirley Ck<br />
1.2<br />
1.0<br />
Ammonia (mg N/L)<br />
0.8<br />
0.6<br />
0.4<br />
0.2<br />
0.0<br />
(N=3) (N=4) (N=4) (N=4) (N=481) (N=79)<br />
SHI-1 SHI-2 SHI-3 SHI-4 ME UE<br />
Monitoring Sites<br />
Reference Sites<br />
Figure 7j 2h Total nitrogen at sites in Shirley Ck<br />
1.5<br />
Total nitrogen (mg N/L)<br />
1.0<br />
0.5<br />
0.0<br />
(N=7) (N=8) (N=8) (N=8) (N=481) (N=79)<br />
SHI-1 SHI-2 SHI-3 SHI-4 ME UE<br />
Monitoring Sites<br />
Reference Sites<br />
Figure 7k 2i Total phosphorus at sites in Shirley Ck<br />
3.0<br />
2.5<br />
Total phosphorus (mg P/L)<br />
2.0<br />
1.5<br />
1.0<br />
0.5<br />
0.0<br />
(N=8) (N=9) (N=9) (N=9) (N=481) (N=79)<br />
SHI-1 SHI-2 SHI-3 SHI-4 ME UE<br />
Monitoring Sites<br />
Reference Sites<br />
84
C5: Box plots – Bribie Island (PRCMP DATA)<br />
Westaways and Poverty Creeks and Pacific Harbour, 2000<br />
Figure Figure 8a 6a pH at sites in Bribie Island: Westaways and Poverty Cks and Pacific Harbour<br />
9<br />
8<br />
pH<br />
7<br />
6<br />
5<br />
(N=8) (N=8) (N=7) (N=15) (N=673) (N=453)<br />
PH-a PH-b PV-a WE-a ECLE ME<br />
Monitoring Sites<br />
Reference Sites<br />
Figure 6b 8b Conductivity at sites in Bribie Island: Westaways and Poverty Cks and Pacific Harbour<br />
80<br />
Conductivity (mS/cm)<br />
60<br />
40<br />
20<br />
0<br />
(N=8) (N=8) (N=7) (N=13) (N=671) (N=452)<br />
PH-a PH-b PV-a WE-a ECLE ME<br />
Monitoring Sites<br />
Reference Sites<br />
Figure 6c 8c Dissolved oxygen at sites in Bribie Island: Westaways and Poverty Cks and Pacific Harbour<br />
100<br />
Dissolved oxygen (% saturation)<br />
80<br />
60<br />
40<br />
(N=8) (N=8) (N=7) (N=15) (N=663) (N=450)<br />
PH-a PH-b PV-a WE-a ECLE ME<br />
Monitoring Sites<br />
Reference Sites<br />
85
C5: Box plots – Bribie Island (PRCMP DATA) (Cont.)<br />
Westaways and Poverty Creeks and Pacific Harbour, 2000<br />
Figure 6d 8d Turbidity at sites in Bribie Island: Westaways and Poverty Cks and Pacific Harbour<br />
30<br />
Turbidity (NTU)<br />
20<br />
10<br />
0<br />
(N=7) (N=8) (N=7) (N=15) (N=656) (N=440)<br />
PH-a PH-b PV-a WE-a ECLE ME<br />
Monitoring Sites<br />
Reference Sites<br />
Figure 6e 8e Secchi depth at sites in Bribie Island: Westaways and Poverty Cks and Pacific Harbour<br />
3<br />
Secchi depth (m)<br />
2<br />
1<br />
0<br />
(N=8) (N=8) (N=2) (N=14) (N=674) (N=454)<br />
PH-a PH-b PV-a WE-a ECLE ME<br />
Monitoring Sites<br />
Reference Sites<br />
Figure 8f 6f Nitrate plus nitrite at sites in Bribie Island: Westaways and Poverty Cks and Pacific Harbour<br />
0.025<br />
Nitrate plus nitrite (mg N/L)<br />
0.020<br />
0.015<br />
0.010<br />
0.005<br />
0.000<br />
(N=0) (N=0) (N=0) (N=10) (N=437) (N=481)<br />
PH-a PH-b PV-a WE-a ECLE ME<br />
Monitoring Sites<br />
Reference Sites<br />
86
C5: Box plots – Bribie Island (PRCMP DATA) (Cont.)<br />
Westaways and Poverty Creeks and Pacific Harbour, 2000<br />
Figure 8g6g Ammonia at sites in Bribie Island: Westaways and Poverty Cks and Pacific Harbour<br />
0.03<br />
Ammonia (mg N/L)<br />
0.02<br />
0.01<br />
0.00<br />
(N=0) (N=0) (N=0) (N=10) (N=437) (N=481)<br />
PH-a PH-b PV-a WE-a ECLE ME<br />
Monitoring Sites<br />
Reference Sites<br />
Figure 8h 6h Total nitrogen at sites in Bribie Island: Westaways and Poverty Cks and Pacific Harbour<br />
0.4<br />
Total nitrogen (mg N/L)<br />
0.3<br />
0.2<br />
0.1<br />
0.0<br />
(N=0) (N=0) (N=0) (N=10) (N=436) (N=481)<br />
PH-a PH-b PV-a WE-a ECLE ME<br />
Monitoring Sites<br />
Reference Sites<br />
Figure 8i 6i Total phosphorus at sites in Bribie Island: Westaways and Poverty Cks and Pacific Harbour<br />
0.06<br />
0.05<br />
Total phosphorus (mg P/L)<br />
0.04<br />
0.03<br />
0.02<br />
0.01<br />
0.00<br />
(N=0) (N=0) (N=0) (N=10) (N=437) (N=481)<br />
PH-a PH-b PV-a WE-a ECLE ME<br />
Monitoring Sites<br />
Reference Sites<br />
87
C5: Box plots – Bribie Island (PRCMP DATA) (Cont.)<br />
Westaways and Poverty Creeks and Pacific Harbour, 2000<br />
Figure Figure 8j 6j Filterable reactive phosphorus at sites in Bribie Island: Westaways and Poverty Cks and Pacific<br />
Harbour<br />
0.025<br />
Filterable reactive phosphorus (mg P/L)<br />
0.020<br />
0.015<br />
0.010<br />
0.005<br />
0.000<br />
(N=0) (N=0) (N=0) (N=10) (N=437) (N=481)<br />
PH-a PH-b PV-a WE-a ECLE ME<br />
Monitoring Sites<br />
Reference Sites<br />
88
C6: Box plots – <strong>Caboolture</strong> <strong>Region</strong> (EPA DATA)<br />
<strong>Caboolture</strong> River, 2001<br />
9.0<br />
Figure 9a 1a pH at sites in <strong>Caboolture</strong> Rv<br />
8.5<br />
8.0<br />
pH<br />
7.5<br />
7.0<br />
6.5<br />
(N=11) (N=11) (N=11) (N=12) (N=11) (N=11) (N=11) (N=12) (N=11) (N=11) (N=11) (N=11) (N=11) (N=673) (N=453) (N=158) (N=271)<br />
Cab-0<br />
Cab-1.6<br />
Cab-4.8<br />
Cab-7.6<br />
Cab-9.5<br />
Cab-11.4<br />
Cab-13.4<br />
Cab-15.1<br />
Monitoring Sites<br />
Cab-17.1<br />
Cab-18.8<br />
Cab-19.9<br />
Cab-41<br />
War-0<br />
ECLE<br />
ME<br />
UE<br />
Reference Sites<br />
LC<br />
Figure 9b 1b Conductivity at sites in <strong>Caboolture</strong> Rv<br />
80<br />
Conductivity (mS/cm)<br />
60<br />
40<br />
20<br />
0<br />
(N=11) (N=11) (N=11) (N=12) (N=11) (N=11) (N=11) (N=12) (N=11) (N=11) (N=11) (N=11) (N=11) (N=671) (N=452) (N=159) (N=272)<br />
Cab-0<br />
Cab-1.6<br />
Cab-4.8<br />
Cab-7.6<br />
Cab-9.5<br />
Cab-11.4<br />
Cab-13.4<br />
Cab-15.1<br />
Monitoring Sites<br />
Cab-17.1<br />
Cab-18.8<br />
Cab-19.9<br />
Cab-41<br />
War-0<br />
ECLE<br />
ME<br />
UE<br />
Reference Sites<br />
LC<br />
Figure 9c 1c Dissolved oxygen at sites in <strong>Caboolture</strong> Rv<br />
Dissolved oxygen (% saturation)<br />
120<br />
100<br />
80<br />
60<br />
40<br />
(N=11) (N=11) (N=11) (N=12) (N=10) (N=10) (N=10) (N=11) (N=10) (N=10) (N=10) (N=11) (N=11) (N=663) (N=450) (N=158) (N=269)<br />
Cab-0<br />
Cab-1.6<br />
Cab-4.8<br />
Cab-7.6<br />
Cab-9.5<br />
Cab-11.4<br />
Cab-13.4<br />
Cab-15.1<br />
Monitoring Sites<br />
Cab-17.1<br />
Cab-18.8<br />
Cab-19.9<br />
Cab-41<br />
War-0<br />
ECLE<br />
ME<br />
UE<br />
Reference Sites<br />
LC<br />
89
C6: Box plots – <strong>Caboolture</strong> <strong>Region</strong> (EPA DATA) (Cont.)<br />
<strong>Caboolture</strong> River, 2001<br />
Figure 9d 1d Turbidity at sites in <strong>Caboolture</strong> Rv<br />
50<br />
Turbidity (NTU)<br />
40<br />
30<br />
20<br />
10<br />
0<br />
(N=11) (N=11) (N=11) (N=12) (N=11) (N=11) (N=11) (N=12) (N=11) (N=11) (N=11) (N=11) (N=11) (N=656) (N=440) (N=153) (N=261)<br />
Cab-0<br />
Cab-1.6<br />
Cab-4.8<br />
Cab-7.6<br />
Cab-9.5<br />
Cab-11.4<br />
Cab-13.4<br />
Cab-15.1<br />
Monitoring Sites<br />
Cab-17.1<br />
Cab-18.8<br />
Cab-19.9<br />
Cab-41<br />
War-0<br />
ECLE<br />
ME<br />
UE<br />
Reference Sites<br />
LC<br />
Figure 9e 1e Secchi depth at sites in <strong>Caboolture</strong> Rv<br />
3<br />
Secchi depth (m)<br />
2<br />
1<br />
0<br />
(N=11) (N=11) (N=11) (N=12) (N=11) (N=11) (N=11) (N=12) (N=11) (N=11) (N=11) (N=6) (N=8) (N=674) (N=454) (N=160) (N=242)<br />
Cab-0<br />
Cab-1.6<br />
Cab-4.8<br />
Cab-7.6<br />
Cab-9.5<br />
Cab-11.4<br />
Cab-13.4<br />
Cab-15.1<br />
Monitoring Sites<br />
Cab-17.1<br />
Cab-18.8<br />
Cab-19.9<br />
Cab-41<br />
War-0<br />
ECLE<br />
ME<br />
UE<br />
Reference Sites<br />
LC<br />
Figure 9f 1f Nitrate plus nitrite at sites in <strong>Caboolture</strong> Rv<br />
0.6<br />
Nitrate plus nitrite (mg N/L)<br />
0.4<br />
0.2<br />
0.0<br />
(N=10) (N=10) (N=10) (N=10) (N=10) (N=10) (N=10) (N=10) (N=10) (N=0) (N=10) (N=10) (N=10) (N=437) (N=481) (N=79) (N=276)<br />
Cab-0<br />
Cab-1.6<br />
Cab-4.8<br />
Cab-7.6<br />
Cab-9.5<br />
Cab-11.4<br />
Cab-13.4<br />
Cab-15.1<br />
Monitoring Sites<br />
Cab-17.1<br />
Cab-18.8<br />
Cab-19.9<br />
Cab-41<br />
War-0<br />
ECLE<br />
ME<br />
UE<br />
Reference Sites<br />
LC<br />
90
C6: Box plots – <strong>Caboolture</strong> <strong>Region</strong> (EPA DATA) (Cont.)<br />
<strong>Caboolture</strong> River, 2001<br />
0.25<br />
Figure 9g 1g Ammonia at sites in <strong>Caboolture</strong> Rv<br />
0.20<br />
Ammonia (mg N/L)<br />
0.15<br />
0.10<br />
0.05<br />
0.00<br />
(N=10) (N=10) (N=10) (N=10) (N=10) (N=10) (N=10) (N=10) (N=10) (N=0) (N=10) (N=10) (N=10) (N=437) (N=481) (N=79) (N=276)<br />
Cab-0<br />
Cab-1.6<br />
Cab-4.8<br />
Cab-7.6<br />
Cab-9.5<br />
Cab-11.4<br />
Cab-13.4<br />
Cab-15.1<br />
Monitoring Sites<br />
Cab-17.1<br />
Cab-18.8<br />
Cab-19.9<br />
Cab-41<br />
War-0<br />
ECLE<br />
ME<br />
UE<br />
Reference Sites<br />
LC<br />
1.5<br />
Figure 9h 1h Total nitrogen at sites in <strong>Caboolture</strong> Rv<br />
Total nitrogen (mg N/L)<br />
1.0<br />
0.5<br />
0.0<br />
(N=10) (N=10) (N=10) (N=10) (N=10) (N=10) (N=10) (N=10) (N=10) (N=0) (N=10) (N=10) (N=10) (N=436) (N=481) (N=79) (N=276)<br />
Cab-0<br />
Cab-1.6<br />
Cab-4.8<br />
Cab-7.6<br />
Cab-9.5<br />
Cab-11.4<br />
Cab-13.4<br />
Cab-15.1<br />
Monitoring Sites<br />
Cab-17.1<br />
Cab-18.8<br />
Cab-19.9<br />
Cab-41<br />
War-0<br />
ECLE<br />
ME<br />
UE<br />
Reference Sites<br />
LC<br />
Figure 9i 1i Total phosphorus at sites in <strong>Caboolture</strong> Rv<br />
Total phosphorus (mg P/L)<br />
0.15<br />
0.10<br />
0.05<br />
0.00<br />
(N=10) (N=10) (N=10) (N=10) (N=10) (N=10) (N=10) (N=10) (N=10) (N=0) (N=10) (N=10) (N=10) (N=437) (N=481) (N=79) (N=276)<br />
Cab-0<br />
Cab-1.6<br />
Cab-4.8<br />
Cab-7.6<br />
Cab-9.5<br />
Cab-11.4<br />
Cab-13.4<br />
Cab-15.1<br />
Monitoring Sites<br />
Cab-17.1<br />
Cab-18.8<br />
Cab-19.9<br />
Cab-41<br />
War-0<br />
ECLE<br />
ME<br />
UE<br />
Reference Sites<br />
LC<br />
91
C6: Box plots – <strong>Caboolture</strong> <strong>Region</strong> (EPA DATA) (Cont.)<br />
<strong>Caboolture</strong> River, 2001<br />
Figure 9j 1j Chlorophyll-a at sites in <strong>Caboolture</strong> Rv<br />
25<br />
Chlorophyll-a (μg/L)<br />
20<br />
15<br />
10<br />
5<br />
0<br />
(N=8) (N=8) (N=8) (N=9) (N=8) (N=8) (N=8) (N=9) (N=8) (N=8) (N=8) (N=8) (N=8) (N=676) (N=465) (N=154) (N=254)<br />
Cab-0<br />
Cab-1.6<br />
Cab-4.8<br />
Cab-7.6<br />
Cab-9.5<br />
Cab-11.4<br />
Cab-13.4<br />
Cab-15.1<br />
Monitoring Sites<br />
Cab-17.1<br />
Cab-18.8<br />
Cab-19.9<br />
Cab-41<br />
War-0<br />
ECLE<br />
ME<br />
UE<br />
Reference Sites<br />
LC<br />
Figure 9k 1k Organic nitrogen at sites in <strong>Caboolture</strong> Rv<br />
0.8<br />
Organic nitrogen (mg N/L)<br />
0.6<br />
0.4<br />
0.2<br />
0.0<br />
(N=10) (N=10) (N=10) (N=10) (N=10) (N=10) (N=10) (N=10) (N=10) (N=0) (N=10) (N=10) (N=10) (N=437) (N=481) (N=79) (N=276)<br />
Cab-0<br />
Cab-1.6<br />
Cab-4.8<br />
Cab-7.6<br />
Cab-9.5<br />
Cab-11.4<br />
Cab-13.4<br />
Cab-15.1<br />
Monitoring Sites<br />
Cab-17.1<br />
Cab-18.8<br />
Cab-19.9<br />
Cab-41<br />
War-0<br />
ECLE<br />
ME<br />
UE<br />
Reference Sites<br />
LC<br />
Figure 9l 1l Filterable reactive phosphorus at sites in <strong>Caboolture</strong> Rv<br />
Filterable reactive phosphorus (mg P/L)<br />
0.06<br />
0.04<br />
0.02<br />
0.00<br />
(N=10) (N=10) (N=10) (N=10) (N=10) (N=10) (N=10) (N=10) (N=10) (N=0) (N=10) (N=10) (N=10) (N=437) (N=481) (N=79) (N=276)<br />
Cab-0<br />
Cab-1.6<br />
Cab-4.8<br />
Cab-7.6<br />
Cab-9.5<br />
Cab-11.4<br />
Cab-13.4<br />
Cab-15.1<br />
Monitoring Sites<br />
Cab-17.1<br />
Cab-18.8<br />
Cab-19.9<br />
Cab-41<br />
War-0<br />
ECLE<br />
ME<br />
UE<br />
Reference Sites<br />
LC<br />
92
C7: Box plots - <strong>Caboolture</strong> <strong>Region</strong> (CSC DATA)<br />
<strong>Caboolture</strong> River, 2001<br />
Figure 10a 5a pH at sites in <strong>Caboolture</strong> Rv<br />
9<br />
8<br />
pH<br />
7<br />
6<br />
5<br />
(N=12) (N=12) (N=12) (N=11) (N=12) (N=12) (N=12) (N=12) (N=453) (N=271) (N=472)<br />
CAB-1 CAB-2 CAB-3 CAB-4 CAB-5 CAB-6 CAB-7 CAB-8 ME LC UC<br />
Monitoring Sites<br />
Reference Sites<br />
Figure 10b 5b Conductivity at sites in <strong>Caboolture</strong> Rv<br />
80<br />
Conductivity (mS/cm)<br />
60<br />
40<br />
20<br />
0<br />
(N=12) (N=12) (N=12) (N=11) (N=12) (N=12) (N=12) (N=12) (N=452) (N=272) (N=478)<br />
CAB-1 CAB-2 CAB-3 CAB-4 CAB-5 CAB-6 CAB-7 CAB-8 ME LC UC<br />
Monitoring Sites<br />
Reference Sites<br />
Figure 10c 5c Dissolved oxygen at sites in <strong>Caboolture</strong> Rv<br />
120<br />
Dissolved oxygen (% saturation)<br />
100<br />
80<br />
60<br />
40<br />
(N=12) (N=12) (N=12) (N=11) (N=12) (N=12) (N=12) (N=12) (N=450) (N=269) (N=475)<br />
CAB-1 CAB-2 CAB-3 CAB-4 CAB-5 CAB-6 CAB-7 CAB-8 ME LC UC<br />
Monitoring Sites<br />
Reference Sites<br />
93
C7: Box plots - <strong>Caboolture</strong> <strong>Region</strong> (CSC DATA) (Cont.)<br />
<strong>Caboolture</strong> River, 2001<br />
Figure 10d 5d Turbidity at sites in <strong>Caboolture</strong> Rv<br />
300<br />
250<br />
Turbidity (NTU)<br />
200<br />
150<br />
100<br />
50<br />
0<br />
(N=12) (N=12) (N=12) (N=11) (N=12) (N=12) (N=12) (N=12) (N=440) (N=261) (N=409)<br />
CAB-1 CAB-2 CAB-3 CAB-4 CAB-5 CAB-6 CAB-7 CAB-8 ME LC UC<br />
Monitoring Sites<br />
Reference Sites<br />
Figure 10e 5f Nitrate plus nitrite at sites in <strong>Caboolture</strong> Rv<br />
1.2<br />
Nitrate plus nitrite (mg N/L)<br />
1.0<br />
0.8<br />
0.6<br />
0.4<br />
0.2<br />
0.0<br />
(N=12) (N=12) (N=12) (N=12) (N=12) (N=12) (N=12) (N=12) (N=481) (N=276) (N=483)<br />
CAB-1 CAB-2 CAB-3 CAB-4 CAB-5 CAB-6 CAB-7 CAB-8 ME LC UC<br />
Monitoring Sites<br />
Reference Sites<br />
94
C7: Box plots - <strong>Caboolture</strong> <strong>Region</strong> (CSC DATA) (Cont.)<br />
<strong>Caboolture</strong> River, 2001<br />
300<br />
Figure 10f 5d Turbidity at sites in <strong>Caboolture</strong> Rv<br />
250<br />
Turbidity (NTU)<br />
200<br />
150<br />
100<br />
50<br />
0<br />
(N=12) (N=12) (N=12) (N=11) (N=12) (N=12) (N=12) (N=12) (N=440) (N=261) (N=409)<br />
CAB-1 CAB-2 CAB-3 CAB-4 CAB-5 CAB-6 CAB-7 CAB-8 ME LC UC<br />
Monitoring Sites<br />
Reference Sites<br />
Figure 10g 5f Nitrate plus nitrite at sites in <strong>Caboolture</strong> Rv<br />
1.2<br />
Nitrate plus nitrite (mg N/L)<br />
1.0<br />
0.8<br />
0.6<br />
0.4<br />
0.2<br />
0.0<br />
(N=12) (N=12) (N=12) (N=12) (N=12) (N=12) (N=12) (N=12) (N=481) (N=276) (N=483)<br />
CAB-1 CAB-2 CAB-3 CAB-4 CAB-5 CAB-6 CAB-7 CAB-8 ME LC UC<br />
Monitoring Sites<br />
Reference Sites<br />
95
C7: Box plots - <strong>Caboolture</strong> <strong>Region</strong> (CSC DATA) (Cont.)<br />
<strong>Caboolture</strong> River, 2001<br />
Figure 10h 5g Ammonia at sites in <strong>Caboolture</strong> Rv<br />
0.4<br />
Ammonia (mg N/L)<br />
0.3<br />
0.2<br />
0.1<br />
0.0<br />
(N=5) (N=4) (N=4) (N=4) (N=5) (N=5) (N=5) (N=5) (N=481) (N=276) (N=483)<br />
CAB-1 CAB-2 CAB-3 CAB-4 CAB-5 CAB-6 CAB-7 CAB-8 ME LC UC<br />
Monitoring Sites<br />
Reference Sites<br />
Figure 10i 5i Total phosphorus at sites in <strong>Caboolture</strong> Rv<br />
1.2<br />
Total phosphorus (mg P/L)<br />
1.0<br />
0.8<br />
0.6<br />
0.4<br />
0.2<br />
0.0<br />
(N=12) (N=12) (N=12) (N=12) (N=12) (N=12) (N=12) (N=12) (N=481) (N=276) (N=482)<br />
CAB-1 CAB-2 CAB-3 CAB-4 CAB-5 CAB-6 CAB-7 CAB-8 ME LC UC<br />
Monitoring Sites<br />
Reference Sites<br />
96
C7: Box plots - <strong>Caboolture</strong> <strong>Region</strong> (CSC DATA) (Cont.)<br />
Lagoon Creek, 2001<br />
Figure 11a 3a pH at sites in Lagoon Ck<br />
9<br />
8<br />
pH<br />
7<br />
6<br />
(N=11) (N=12) (N=12) (N=12) (N=12) (N=12) (N=12) (N=12) (N=271)<br />
LAG-1 LAG-2 LAG-3 LAG-4 LAG-5 LAG-6 LAG-7 LAG-8 LC<br />
Monitoring Sites<br />
Reference Sites<br />
Figure 11b 3b Conductivity at sites in Lagoon Ck<br />
0.6<br />
Conductivity (mS/cm)<br />
0.4<br />
0.2<br />
0.0<br />
(N=11) (N=12) (N=12) (N=12) (N=12) (N=12) (N=12) (N=12) (N=272)<br />
LAG-1 LAG-2 LAG-3 LAG-4 LAG-5 LAG-6 LAG-7 LAG-8 LC<br />
Monitoring Sites<br />
Reference Sites<br />
Figure 11c 3c Dissolved oxygen at sites in Lagoon Ck<br />
120<br />
Dissolved oxygen (% saturation)<br />
100<br />
80<br />
60<br />
40<br />
20<br />
0<br />
(N=11) (N=12) (N=12) (N=12) (N=12) (N=12) (N=12) (N=12) (N=269)<br />
LAG-1 LAG-2 LAG-3 LAG-4 LAG-5 LAG-6 LAG-7 LAG-8 LC<br />
Monitoring Sites<br />
Reference Sites<br />
97
C7: Box plots - <strong>Caboolture</strong> <strong>Region</strong> (CSC DATA) (Cont.)<br />
Lagoon Creek, 2001<br />
Figure 11d 3d Turbidity at sites in Lagoon Ck<br />
300<br />
Turbidity (NTU)<br />
200<br />
100<br />
0<br />
(N=11) (N=12) (N=12) (N=12) (N=12) (N=12) (N=12) (N=12) (N=261)<br />
LAG-1 LAG-2 LAG-3 LAG-4 LAG-5 LAG-6 LAG-7 LAG-8 LC<br />
Monitoring Sites<br />
Reference Sites<br />
Figure 11e 3f Nitrate plus nitrite at sites in Lagoon Ck<br />
1.0<br />
Nitrate plus nitrite (mg N/L)<br />
0.8<br />
0.6<br />
0.4<br />
0.2<br />
0.0<br />
(N=11) (N=12) (N=12) (N=12) (N=12) (N=12) (N=12) (N=12) (N=276)<br />
LAG-1 LAG-2 LAG-3 LAG-4 LAG-5 LAG-6 LAG-7 LAG-8 LC<br />
Monitoring Sites<br />
Reference Sites<br />
98
C7: Box plots - <strong>Caboolture</strong> <strong>Region</strong> (CSC DATA) (Cont.)<br />
Lagoon Creek, 2001<br />
Figure 11f 3g Ammonia at sites in Lagoon Ck<br />
0.8<br />
Ammonia (mg N/L)<br />
0.6<br />
0.4<br />
0.2<br />
0.0<br />
(N=4) (N=4) (N=4) (N=4) (N=4) (N=4) (N=4) (N=4) (N=276)<br />
LAG-1 LAG-2 LAG-3 LAG-4 LAG-5 LAG-6 LAG-7 LAG-8 LC<br />
Monitoring Sites<br />
Reference Sites<br />
Figure 11g 3i Total phosphorus at sites in Lagoon Ck<br />
2.0<br />
Total phosphorus (mg P/L)<br />
1.5<br />
1.0<br />
0.5<br />
0.0<br />
(N=11) (N=12) (N=12) (N=12) (N=12) (N=12) (N=12) (N=12) (N=276)<br />
LAG-1 LAG-2 LAG-3 LAG-4 LAG-5 LAG-6 LAG-7 LAG-8 LC<br />
Monitoring Sites<br />
Reference Sites<br />
99
C7: Box plots - <strong>Caboolture</strong> <strong>Region</strong> (CSC DATA) (Cont.)<br />
Lagoon Creek, 2001<br />
Figure 12a 6a pH at sites in Sheepstation Ck<br />
9<br />
8<br />
7<br />
pH<br />
6<br />
5<br />
4<br />
3<br />
(N=7) (N=12) (N=12) (N=12) (N=271)<br />
SHE-1 SHE-2 SHE-3 SHE-4 LC<br />
Monitoring Sites<br />
Reference Sites<br />
Figure 12b 6b Conductivity at sites in Sheepstation Ck<br />
1.2<br />
1.0<br />
Conductivity (mS/cm)<br />
0.8<br />
0.6<br />
0.4<br />
0.2<br />
0.0<br />
(N=7) (N=12) (N=12) (N=12) (N=272)<br />
SHE-1 SHE-2 SHE-3 SHE-4 LC<br />
Monitoring Sites<br />
Reference Sites<br />
Figure 12c 6c Dissolved oxygen at sites in Sheepstation Ck<br />
120<br />
Dissolved oxygen (% saturation)<br />
100<br />
80<br />
60<br />
40<br />
20<br />
0<br />
(N=7) (N=12) (N=12) (N=12) (N=269)<br />
SHE-1 SHE-2 SHE-3 SHE-4 LC<br />
Monitoring Sites<br />
Reference Sites<br />
100
C7: Box plots - <strong>Caboolture</strong> <strong>Region</strong> (CSC DATA) (Cont.)<br />
Lagoon Creek, 2001<br />
Figure 12d<br />
Figure 6d Turbidity at sites in Sheepstation Ck<br />
50<br />
40<br />
Turbidity (NTU)<br />
30<br />
20<br />
10<br />
0<br />
(N=7) (N=12) (N=12) (N=12) (N=261)<br />
SHE-1 SHE-2 SHE-3 SHE-4 LC<br />
Monitoring Sites<br />
Reference Sites<br />
Figure 12e<br />
Figure 6f Nitrate plus nitrite at sites in Sheepstation Ck<br />
0.25<br />
Nitrate plus nitrite (mg N/L)<br />
0.20<br />
0.15<br />
0.10<br />
0.05<br />
0.00<br />
(N=7) (N=12) (N=12) (N=12) (N=276)<br />
SHE-1 SHE-2 SHE-3 SHE-4 LC<br />
Monitoring Sites<br />
Reference Sites<br />
101
C7: Box plots - <strong>Caboolture</strong> <strong>Region</strong> (CSC DATA) (Cont.)<br />
Wararba Creek, 2001<br />
Figure 13a 4a pH at sites in Wararba Ck<br />
9.0<br />
8.5<br />
8.0<br />
pH<br />
7.5<br />
7.0<br />
6.5<br />
6.0<br />
(N=12) (N=12) (N=12) (N=12) (N=12) (N=12) (N=271)<br />
WAR-1 WAR-2 WAR-3 WAR-4 WAR-5 WAR-6 LC<br />
Monitoring Sites<br />
Reference Sites<br />
Figure 13b 4b Conductivity at sites in Wararba Ck<br />
1.2<br />
1.0<br />
Conductivity (mS/cm)<br />
0.8<br />
0.6<br />
0.4<br />
0.2<br />
0.0<br />
(N=12) (N=12) (N=12) (N=12) (N=12) (N=12) (N=272)<br />
WAR-1 WAR-2 WAR-3 WAR-4 WAR-5 WAR-6 LC<br />
Monitoring Sites<br />
Reference Sites<br />
Figure 13c 4c Dissolved oxygen at sites in Wararba Ck<br />
Dissolved oxygen (% saturation)<br />
150<br />
100<br />
50<br />
0<br />
(N=12) (N=12) (N=12) (N=12) (N=12) (N=12) (N=269)<br />
WAR-1 WAR-2 WAR-3 WAR-4 WAR-5 WAR-6 LC<br />
Monitoring Sites<br />
Reference Sites<br />
102
C7: Box plots - <strong>Caboolture</strong> <strong>Region</strong> (CSC DATA) (Cont.)<br />
Wararba Creek, 2001<br />
Figure 13d 4d Turbidity at sites in Wararba Ck<br />
120<br />
100<br />
Turbidity (NTU)<br />
80<br />
60<br />
40<br />
20<br />
0<br />
(N=12) (N=12) (N=12) (N=12) (N=12) (N=12) (N=261)<br />
WAR-1 WAR-2 WAR-3 WAR-4 WAR-5 WAR-6 LC<br />
Monitoring Sites<br />
Reference Sites<br />
Figure 13e 4f Nitrate plus nitrite at sites in Wararba Ck<br />
6<br />
5<br />
Nitrate plus nitrite (mg N/L)<br />
4<br />
3<br />
2<br />
1<br />
0<br />
(N=12) (N=12) (N=12) (N=12) (N=12) (N=12) (N=276)<br />
WAR-1 WAR-2 WAR-3 WAR-4 WAR-5 WAR-6 LC<br />
Monitoring Sites<br />
Reference Sites<br />
103
C7: Box plots - <strong>Caboolture</strong> <strong>Region</strong> (CSC DATA) (Cont.)<br />
Wararba Creek, 2001<br />
Figure 13f 4g Ammonia at sites in Wararba Ck<br />
0.10<br />
Ammonia (mg N/L)<br />
0.08<br />
0.06<br />
0.04<br />
0.02<br />
0.00<br />
(N=5) (N=5) (N=5) (N=5) (N=5) (N=5) (N=276)<br />
WAR-1 WAR-2 WAR-3 WAR-4 WAR-5 WAR-6 LC<br />
Monitoring Sites<br />
Reference Sites<br />
Figure 13g 4i Total phosphorus at sites in Wararba Ck<br />
1.2<br />
Total phosphorus (mg P/L)<br />
1.0<br />
0.8<br />
0.6<br />
0.4<br />
0.2<br />
0.0<br />
(N=12) (N=12) (N=12) (N=12) (N=12) (N=12) (N=276)<br />
WAR-1 WAR-2 WAR-3 WAR-4 WAR-5 WAR-6 LC<br />
Monitoring Sites<br />
Reference Sites<br />
104
C8: Box plots – Burpengary Creek (CSC DATA)<br />
Burpengary Creek, 2001<br />
Figure 14a 7a pH at sites in Burpengary Ck<br />
9.0<br />
8.5<br />
8.0<br />
pH<br />
7.5<br />
7.0<br />
6.5<br />
(N=11) (N=11) (N=11) (N=11) (N=11) (N=8) (N=453) (N=271)<br />
BUR-1 BUR-2 BUR-3 BUR-4 BUR-5 BUR-6 ME LC<br />
Monitoring Sites<br />
Reference Sites<br />
Figure 14b 7b Conductivity at sites in Burpengary Ck<br />
80<br />
Conductivity (mS/cm)<br />
60<br />
40<br />
20<br />
0<br />
(N=11) (N=11) (N=11) (N=11) (N=11) (N=8) (N=452) (N=272)<br />
BUR-1 BUR-2 BUR-3 BUR-4 BUR-5 BUR-6 ME LC<br />
Monitoring Sites<br />
Reference Sites<br />
Figure 14c 7c Dissolved oxygen at sites in Burpengary Ck<br />
120<br />
Dissolved oxygen (% saturation)<br />
100<br />
80<br />
60<br />
40<br />
20<br />
0<br />
(N=11) (N=11) (N=11) (N=11) (N=11) (N=8) (N=450) (N=269)<br />
BUR-1 BUR-2 BUR-3 BUR-4 BUR-5 BUR-6 ME LC<br />
Monitoring Sites<br />
Reference Sites<br />
105
C8: Box plots – Burpengary Creek (CSC DATA) (Cont.)<br />
Burpengary Creek, 2001<br />
Figure 14d 7d Turbidity at sites in Burpengary Ck<br />
150<br />
Turbidity (NTU)<br />
100<br />
50<br />
0<br />
(N=11) (N=11) (N=11) (N=11) (N=11) (N=8) (N=440) (N=261)<br />
BUR-1 BUR-2 BUR-3 BUR-4 BUR-5 BUR-6 ME LC<br />
Monitoring Sites<br />
Reference Sites<br />
Figure 14e 7f Nitrate plus nitrite at sites in Burpengary Ck<br />
0.3<br />
Nitrate plus nitrite (mg N/L)<br />
0.2<br />
0.1<br />
0.0<br />
(N=11) (N=11) (N=11) (N=11) (N=11) (N=8) (N=481) (N=276)<br />
BUR-1 BUR-2 BUR-3 BUR-4 BUR-5 BUR-6 ME LC<br />
Monitoring Sites<br />
Reference Sites<br />
106
C8: Box plots – Burpengary Creek (CSC DATA) (Cont.)<br />
Burpengary Creek, 2001<br />
Figure 14f 7g Ammonia at sites in Burpengary Ck<br />
0.30<br />
0.25<br />
Ammonia (mg N/L)<br />
0.20<br />
0.15<br />
0.10<br />
0.05<br />
0.00<br />
(N=5) (N=5) (N=5) (N=5) (N=5) (N=5) (N=481) (N=276)<br />
BUR-1 BUR-2 BUR-3 BUR-4 BUR-5 BUR-6 ME LC<br />
Monitoring Sites<br />
Reference Sites<br />
Figure 14g 7i Total phosphorus at sites in Burpengary Ck<br />
1.0<br />
Total phosphorus (mg P/L)<br />
0.8<br />
0.6<br />
0.4<br />
0.2<br />
0.0<br />
(N=11) (N=11) (N=11) (N=11) (N=11) (N=8) (N=481) (N=276)<br />
BUR-1 BUR-2 BUR-3 BUR-4 BUR-5 BUR-6 ME LC<br />
Monitoring Sites<br />
Reference Sites<br />
107
C9: Box plots – Saltwater Creek (CSC DATA)<br />
Saltwater Creek, 2001<br />
Figure 15a 8a pH at sites in Saltwater Ck<br />
9.0<br />
8.5<br />
8.0<br />
pH<br />
7.5<br />
7.0<br />
6.5<br />
6.0<br />
(N=12) (N=9) (N=12) (N=12) (N=12) (N=8) (N=12) (N=12) (N=12) (N=271)<br />
SAL-1 SAL-2 SAL-3 SAL-4 SAL-5 SAL-6 SAL-7 SAL-8 SAL-9 LC<br />
Monitoring Sites<br />
Reference Sites<br />
Figure 15b 8b Conductivity at sites in Saltwater Ck<br />
4<br />
Conductivity (mS/cm)<br />
3<br />
2<br />
1<br />
0<br />
(N=12) (N=9) (N=12) (N=12) (N=12) (N=8) (N=12) (N=12) (N=12) (N=272)<br />
SAL-1 SAL-2 SAL-3 SAL-4 SAL-5 SAL-6 SAL-7 SAL-8 SAL-9 LC<br />
Monitoring Sites<br />
Reference Sites<br />
Figure 15c 8c Dissolved oxygen at sites in Saltwater Ck<br />
140<br />
Dissolved oxygen (% saturation)<br />
120<br />
100<br />
80<br />
60<br />
40<br />
20<br />
0<br />
(N=12) (N=9) (N=12) (N=12) (N=12) (N=8) (N=11) (N=12) (N=12) (N=269)<br />
SAL-1 SAL-2 SAL-3 SAL-4 SAL-5 SAL-6 SAL-7 SAL-8 SAL-9 LC<br />
Monitoring Sites<br />
Reference Sites<br />
108
C9: Box plots – Saltwater Creek (CSC DATA) (Cont.)<br />
Saltwater Creek, 2001<br />
Figure 15d 8d Turbidity at sites in Saltwater Ck<br />
400<br />
300<br />
Turbidity (NTU)<br />
200<br />
100<br />
0<br />
(N=12) (N=8) (N=12) (N=12) (N=11) (N=8) (N=12) (N=12) (N=12) (N=261)<br />
SAL-1 SAL-2 SAL-3 SAL-4 SAL-5 SAL-6 SAL-7 SAL-8 SAL-9 LC<br />
Monitoring Sites<br />
Reference Sites<br />
Figure 15e 8f Nitrate plus nitrite at sites in Saltwater Ck<br />
1.5<br />
Nitrate plus nitrite (mg N/L)<br />
1.0<br />
0.5<br />
0.0<br />
(N=12) (N=9) (N=12) (N=12) (N=12) (N=8) (N=12) (N=12) (N=12) (N=276)<br />
SAL-1 SAL-2 SAL-3 SAL-4 SAL-5 SAL-6 SAL-7 SAL-8 SAL-9 LC<br />
Monitoring Sites<br />
Reference Sites<br />
109
C9: Box plots – Saltwater Creek (CSC DATA) (Cont.)<br />
Saltwater Creek, 2001<br />
Figure 15f 8g Ammonia at sites in Saltwater Ck<br />
3.0<br />
2.5<br />
Ammonia (mg N/L)<br />
2.0<br />
1.5<br />
1.0<br />
0.5<br />
0.0<br />
(N=5) (N=2) (N=5) (N=5) (N=5) (N=5) (N=5) (N=5) (N=5) (N=276)<br />
SAL-1 SAL-2 SAL-3 SAL-4 SAL-5 SAL-6 SAL-7 SAL-8 SAL-9 LC<br />
Monitoring Sites<br />
Reference Sites<br />
Figure 15g 8i Total phosphorus at sites in Saltwater Ck<br />
2.0<br />
Total phosphorus (mg P/L)<br />
1.5<br />
1.0<br />
0.5<br />
0.0<br />
(N=12) (N=9) (N=12) (N=12) (N=12) (N=8) (N=12) (N=12) (N=12) (N=276)<br />
SAL-1 SAL-2 SAL-3 SAL-4 SAL-5 SAL-6 SAL-7 SAL-8 SAL-9 LC<br />
Monitoring Sites<br />
Reference Sites<br />
110
C10: Box plots – Pumicestone Passage (EPA DATA)<br />
Pumicestone Passage, 2001<br />
Figure 16a 3a pH at sites in Pumicestone Psg<br />
8.5<br />
8.0<br />
pH<br />
7.5<br />
7.0<br />
(N=10) (N=10) (N=10) (N=10) (N=10) (N=10) (N=10) (N=10) (N=10) (N=10) (N=10) (N=10) (N=10) (N=673)<br />
Pum-a Pum-b Pum-c Pum-d Pum-e Pum-f Pum-g Pum-h Pum-i Pum-j Pum-k Pum-l Pum-m ECLE<br />
Monitoring Sites<br />
Reference Sites<br />
Figure 16b 3b Conductivity at sites in Pumicestone Psg<br />
60<br />
50<br />
Conductivity (mS/cm)<br />
40<br />
30<br />
20<br />
10<br />
0<br />
(N=10) (N=10) (N=10) (N=10) (N=10) (N=10) (N=10) (N=10) (N=10) (N=10) (N=10) (N=10) (N=10) (N=671)<br />
Pum-a Pum-b Pum-c Pum-d Pum-e Pum-f Pum-g Pum-h Pum-i Pum-j Pum-k Pum-l Pum-m ECLE<br />
Monitoring Sites<br />
Reference Sites<br />
130<br />
Figure 16c 3c Dissolved oxygen at sites in Pumicestone Psg<br />
120<br />
Dissolved oxygen (% saturation)<br />
110<br />
100<br />
90<br />
80<br />
70<br />
(N=10) (N=10) (N=10) (N=10) (N=10) (N=10) (N=10) (N=10) (N=10) (N=10) (N=10) (N=10) (N=10) (N=663)<br />
Pum-a Pum-b Pum-c Pum-d Pum-e Pum-f Pum-g Pum-h Pum-i Pum-j Pum-k Pum-l Pum-m ECLE<br />
Monitoring Sites<br />
Reference Sites<br />
111
C10: Box plots – Pumicestone Passage (EPA DATA) (Cont.)<br />
Pumicestone Passage, 2001<br />
Figure 16d 3d Turbidity at sites in Pumicestone Psg<br />
50<br />
40<br />
Turbidity (NTU)<br />
30<br />
20<br />
10<br />
0<br />
(N=10) (N=10) (N=10) (N=10) (N=10) (N=10) (N=10) (N=10) (N=10) (N=10) (N=10) (N=10) (N=10) (N=656)<br />
Pum-a Pum-b Pum-c Pum-d Pum-e Pum-f Pum-g Pum-h Pum-i Pum-j Pum-k Pum-l Pum-m ECLE<br />
Monitoring Sites<br />
Reference Sites<br />
Figure 16e 3e Secchi depth at sites in Pumicestone Psg<br />
4<br />
Secchi depth (m)<br />
3<br />
2<br />
1<br />
0<br />
(N=10) (N=10) (N=10) (N=10) (N=10) (N=10) (N=10) (N=10) (N=10) (N=10) (N=10) (N=10) (N=10) (N=674)<br />
Pum-a Pum-b Pum-c Pum-d Pum-e Pum-f Pum-g Pum-h Pum-i Pum-j Pum-k Pum-l Pum-m ECLE<br />
Monitoring Sites<br />
Reference Sites<br />
Figure 16f 3f Nitrate plus nitrite at sites in Pumicestone Psg<br />
0.20<br />
Nitrate plus nitrite (mg N/L)<br />
0.15<br />
0.10<br />
0.05<br />
0.00<br />
(N=0) (N=0) (N=0) (N=9) (N=0) (N=0) (N=0) (N=0) (N=0) (N=0) (N=9) (N=0) (N=0) (N=437)<br />
Pum-a Pum-b Pum-c Pum-d Pum-e Pum-f Pum-g Pum-h Pum-i Pum-j Pum-k Pum-l Pum-m ECLE<br />
Monitoring Sites<br />
Reference Sites<br />
112
C10: Box plots – Pumicestone Passage (EPA DATA) (Cont.)<br />
Pumicestone Passage, 2001<br />
Figure 16g 3g Ammonia at sites in Pumicestone Psg<br />
0.10<br />
Ammonia (mg N/L)<br />
0.08<br />
0.06<br />
0.04<br />
0.02<br />
0.00<br />
(N=0) (N=0) (N=0) (N=9) (N=0) (N=0) (N=0) (N=0) (N=0) (N=0) (N=9) (N=0) (N=0) (N=437)<br />
Pum-a Pum-b Pum-c Pum-d Pum-e Pum-f Pum-g Pum-h Pum-i Pum-j Pum-k Pum-l Pum-m ECLE<br />
Monitoring Sites<br />
Reference Sites<br />
1.0<br />
Figure 16h 3h Total nitrogen at sites in Pumicestone Psg<br />
0.8<br />
Total nitrogen (mg N/L)<br />
0.6<br />
0.4<br />
0.2<br />
0.0<br />
(N=0) (N=0) (N=0) (N=9) (N=0) (N=0) (N=0) (N=0) (N=0) (N=0) (N=9) (N=0) (N=0) (N=436)<br />
Pum-a Pum-b Pum-c Pum-d Pum-e Pum-f Pum-g Pum-h Pum-i Pum-j Pum-k Pum-l Pum-m ECLE<br />
Monitoring Sites<br />
Reference Sites<br />
Figure 16i 3i Total phosphorus at sites in Pumicestone Psg<br />
0.06<br />
Total phosphorus (mg P/L)<br />
0.05<br />
0.04<br />
0.03<br />
0.02<br />
0.01<br />
0.00<br />
(N=0) (N=0) (N=0) (N=9) (N=0) (N=0) (N=0) (N=0) (N=0) (N=0) (N=9) (N=0) (N=0) (N=437)<br />
Pum-a Pum-b Pum-c Pum-d Pum-e Pum-f Pum-g Pum-h Pum-i Pum-j Pum-k Pum-l Pum-m ECLE<br />
Monitoring Sites<br />
Reference Sites<br />
113
C10: Box plots – Pumicestone Passage (EPA DATA) (Cont.)<br />
Pumicestone Passage, 2001<br />
12<br />
Figure 16j 3j Chlorophyll-a at sites in Pumicestone Psg<br />
10<br />
Chlorophyll-a (μg/L)<br />
8<br />
6<br />
4<br />
2<br />
0<br />
(N=9) (N=0) (N=9) (N=8) (N=0) (N=0) (N=0) (N=9) (N=0) (N=0) (N=9) (N=0) (N=9) (N=676)<br />
Pum-a Pum-b Pum-c Pum-d Pum-e Pum-f Pum-g Pum-h Pum-i Pum-j Pum-k Pum-l Pum-m ECLE<br />
Monitoring Sites<br />
Reference Sites<br />
Figure 16k 3k Organic nitrogen at sites in Pumicestone Psg<br />
0.6<br />
Organic nitrogen (mg N/L)<br />
0.4<br />
0.2<br />
0.0<br />
(N=0) (N=0) (N=0) (N=9) (N=0) (N=0) (N=0) (N=0) (N=0) (N=0) (N=9) (N=0) (N=0) (N=437)<br />
Pum-a Pum-b Pum-c Pum-d Pum-e Pum-f Pum-g Pum-h Pum-i Pum-j Pum-k Pum-l Pum-m ECLE<br />
Monitoring Sites<br />
Reference Sites<br />
Figure 16l 3l Filterable reactive phosphorus at sites in Pumicestone Psg<br />
0.025<br />
Filterable reactive phosphorus (mg P/L)<br />
0.020<br />
0.015<br />
0.010<br />
0.005<br />
0.000<br />
(N=0) (N=0) (N=0) (N=9) (N=0) (N=0) (N=0) (N=0) (N=0) (N=0) (N=9) (N=0) (N=0) (N=437)<br />
Pum-a Pum-b Pum-c Pum-d Pum-e Pum-f Pum-g Pum-h Pum-i Pum-j Pum-k Pum-l Pum-m ECLE<br />
Monitoring Sites<br />
Reference Sites<br />
114
C11: Box plots – Pumicestone Passage (PRCMP DATA)<br />
Pumicestone Passage, 2000<br />
Figure Figure 17a7a pH at sites in Pumicestone Passage<br />
8.5<br />
pH<br />
8.0<br />
7.5<br />
(N=16) (N=17) (N=17) (N=17) (N=8) (N=7) (N=8) (N=8) (N=14) (N=15) (N=8) (N=15) (N=8) (N=8) (N=16) (N=8) (N=15) (N=673)<br />
PP-a PP-b PP-c PP-d PP-e PP-f PP-g PP-h PP-i PP-j PP-k PP-l PP-m PP-n PP-o PP-p PP-q ECLE<br />
Monitoring Sites<br />
Reference Sites<br />
Figure Figure 17b<br />
Conductivity at sites in Pumicestone Passage<br />
80<br />
Conductivity (mS/cm)<br />
60<br />
40<br />
20<br />
0<br />
(N=14) (N=15) (N=15) (N=15) (N=8) (N=7) (N=8) (N=8) (N=14) (N=13) (N=7) (N=13) (N=6) (N=8) (N=16) (N=8) (N=15) (N=671)<br />
PP-a PP-b PP-c PP-d PP-e PP-f PP-g PP-h PP-i PP-j PP-k PP-l PP-m PP-n PP-o PP-p PP-q ECLE<br />
Monitoring Sites<br />
Reference Sites<br />
Figure Figure 17c7c<br />
Dissolved oxygen at sites in Pumicestone Passage<br />
110<br />
Dissolved oxygen (% saturation)<br />
100<br />
90<br />
80<br />
70<br />
60<br />
(N=16) (N=17) (N=17) (N=17) (N=8) (N=7) (N=8) (N=8) (N=14) (N=14) (N=7) (N=14) (N=7) (N=8) (N=16) (N=8) (N=15) (N=663)<br />
PP-a PP-b PP-c PP-d PP-e PP-f PP-g PP-h PP-i PP-j PP-k PP-l PP-m PP-n PP-o PP-p PP-q ECLE<br />
Monitoring Sites<br />
Reference Sites<br />
115
C11: Box plots – Pumicestone Passage (PRCMP DATA) (Cont.)<br />
Pumicestone Passage, 2000<br />
Figure Figure 17d7d Turbidity at sites in Pumicestone Passage<br />
30<br />
Turbidity (NTU)<br />
20<br />
10<br />
0<br />
(N=16) (N=17) (N=17) (N=17) (N=8) (N=7) (N=8) (N=8) (N=14) (N=15) (N=8) (N=15) (N=8) (N=7) (N=17) (N=8) (N=16) (N=656)<br />
PP-a PP-b PP-c PP-d PP-e PP-f PP-g PP-h PP-i PP-j PP-k PP-l PP-m PP-n PP-o PP-p PP-q ECLE<br />
Monitoring Sites<br />
Reference Sites<br />
Figure Figure 17e7e Secchi depth at sites in Pumicestone Passage<br />
4<br />
3<br />
Secchi depth (m)<br />
2<br />
1<br />
0<br />
(N=15) (N=16) (N=16) (N=16) (N=7) (N=5) (N=8) (N=7) (N=14) (N=13) (N=7) (N=14) (N=7) (N=7) (N=16) (N=7) (N=14) (N=674)<br />
PP-a PP-b PP-c PP-d PP-e PP-f PP-g PP-h PP-i PP-j PP-k PP-l PP-m PP-n PP-o PP-p PP-q ECLE<br />
Monitoring Sites<br />
Reference Sites<br />
Figure Figure 17f7f<br />
Nitrate plus nitrite at sites in Pumicestone Passage<br />
0.010<br />
Nitrate plus nitrite (mg N/L)<br />
0.008<br />
0.006<br />
0.004<br />
0.002<br />
0.000<br />
(N=0) (N=0) (N=0) (N=0) (N=0) (N=0) (N=0) (N=0) (N=0) (N=11) (N=11) (N=10) (N=9) (N=0) (N=0) (N=0) (N=0) (N=437)<br />
PP-a PP-b PP-c PP-d PP-e PP-f PP-g PP-h PP-i PP-j PP-k PP-l PP-m PP-n PP-o PP-p PP-q ECLE<br />
Monitoring Sites<br />
Reference Sites<br />
116
C11: Box plots – Pumicestone Passage (PRCMP DATA) (Cont.)<br />
Pumicestone Passage, 2000<br />
Figure Figure 17g7g Ammonia at sites in Pumicestone Passage<br />
0.020<br />
Ammonia (mg N/L)<br />
0.015<br />
0.010<br />
0.005<br />
0.000<br />
(N=0) (N=0) (N=0) (N=0) (N=0) (N=0) (N=0) (N=0) (N=0) (N=11) (N=11) (N=10) (N=9) (N=0) (N=0) (N=0) (N=0) (N=437)<br />
PP-a PP-b PP-c PP-d PP-e PP-f PP-g PP-h PP-i PP-j PP-k PP-l PP-m PP-n PP-o PP-p PP-q ECLE<br />
Monitoring Sites<br />
Reference Sites<br />
Figure Figure 17h7h Total nitrogen at sites in Pumicestone Passage<br />
0.3<br />
Total nitrogen (mg N/L)<br />
0.2<br />
0.1<br />
0.0<br />
(N=0) (N=0) (N=0) (N=0) (N=0) (N=0) (N=0) (N=0) (N=0) (N=11) (N=11) (N=10) (N=9) (N=0) (N=0) (N=0) (N=0) (N=436)<br />
PP-a PP-b PP-c PP-d PP-e PP-f PP-g PP-h PP-i PP-j PP-k PP-l PP-m PP-n PP-o PP-p PP-q ECLE<br />
Monitoring Sites<br />
Reference Sites<br />
Figure Figure 17i7i<br />
Total phosphorus at sites in Pumicestone Passage<br />
0.08<br />
Total phosphorus (mg P/L)<br />
0.06<br />
0.04<br />
0.02<br />
0.00<br />
(N=0) (N=0) (N=0) (N=0) (N=0) (N=0) (N=0) (N=0) (N=0) (N=11) (N=11) (N=10) (N=9) (N=0) (N=0) (N=0) (N=0) (N=437)<br />
PP-a PP-b PP-c PP-d PP-e PP-f PP-g PP-h PP-i PP-j PP-k PP-l PP-m PP-n PP-o PP-p PP-q ECLE<br />
Monitoring Sites<br />
Reference Sites<br />
117
C11: Box plots – Pumicestone Passage (PRCMP DATA) (Cont.)<br />
Pumicestone Passage, 2000<br />
Figure Figure 17j7j<br />
Filterable reactive phosphorus at sites in Pumicestone Passage<br />
0.025<br />
Filterable reactive phosphorus (mg P/L)<br />
0.020<br />
0.015<br />
0.010<br />
0.005<br />
0.000<br />
(N=0) (N=0) (N=0) (N=0) (N=0) (N=0) (N=0) (N=0) (N=0) (N=11) (N=11) (N=10) (N=9) (N=0) (N=0) (N=0) (N=0) (N=437)<br />
PP-a PP-b PP-c PP-d PP-e PP-f PP-g PP-h PP-i PP-j PP-k PP-l PP-m PP-n PP-o PP-p PP-q ECLE<br />
Monitoring Sites<br />
Reference Sites<br />
118
C12: Box plots – Deception <strong>Bay</strong> (EPA DATA)<br />
Deception <strong>Bay</strong>, 2001<br />
Figure 18a 2a pH at sites in Deception <strong>Bay</strong><br />
8.6<br />
8.4<br />
pH<br />
8.2<br />
8.0<br />
7.8<br />
(N=10) (N=9) (N=10) (N=10) (N=10) (N=11) (N=10) (N=9) (N=9) (N=10) (N=10) (N=673)<br />
Dec-a Dec-c Dec-d Dec-j Dec-l Dec-m Dec-r Dec-u Dec-v Dec-x Dec-y ECLE<br />
Monitoring Sites<br />
Reference Sites<br />
60<br />
Figure 18b 2b Conductivity at sites in Deception <strong>Bay</strong><br />
50<br />
Conductivity (mS/cm)<br />
40<br />
30<br />
20<br />
10<br />
0<br />
(N=10) (N=9) (N=10) (N=10) (N=10) (N=11) (N=10) (N=9) (N=9) (N=10) (N=10) (N=671)<br />
Dec-a Dec-c Dec-d Dec-j Dec-l Dec-m Dec-r Dec-u Dec-v Dec-x Dec-y ECLE<br />
Monitoring Sites<br />
Reference Sites<br />
Figure 18c 2c Dissolved oxygen at sites in Deception <strong>Bay</strong><br />
120<br />
Dissolved oxygen (% saturation)<br />
110<br />
100<br />
90<br />
80<br />
(N=10) (N=9) (N=10) (N=10) (N=10) (N=11) (N=10) (N=9) (N=9) (N=10) (N=10) (N=663)<br />
Dec-a Dec-c Dec-d Dec-j Dec-l Dec-m Dec-r Dec-u Dec-v Dec-x Dec-y ECLE<br />
Monitoring Sites<br />
Reference Sites<br />
119
C12: Box plots – Deception <strong>Bay</strong> (EPA DATA) (Cont.)<br />
Deception <strong>Bay</strong>, 2001<br />
Figure 18d 2d Turbidity at sites in Deception <strong>Bay</strong><br />
20<br />
15<br />
Turbidity (NTU)<br />
10<br />
5<br />
0<br />
(N=9) (N=8) (N=9) (N=9) (N=9) (N=11) (N=9) (N=8) (N=8) (N=9) (N=9) (N=656)<br />
Dec-a Dec-c Dec-d Dec-j Dec-l Dec-m Dec-r Dec-u Dec-v Dec-x Dec-y ECLE<br />
Monitoring Sites<br />
Reference Sites<br />
Figure 18e 2e Secchi depth at sites in Deception <strong>Bay</strong><br />
5<br />
4<br />
Secchi depth (m)<br />
3<br />
2<br />
1<br />
0<br />
(N=10) (N=9) (N=10) (N=10) (N=10) (N=11) (N=10) (N=9) (N=9) (N=10) (N=10) (N=674)<br />
Dec-a Dec-c Dec-d Dec-j Dec-l Dec-m Dec-r Dec-u Dec-v Dec-x Dec-y ECLE<br />
Monitoring Sites<br />
Reference Sites<br />
Figure 18f 2f Nitrate plus nitrite at sites in Deception <strong>Bay</strong><br />
0.03<br />
Nitrate plus nitrite (mg N/L)<br />
0.02<br />
0.01<br />
0.00<br />
(N=10) (N=9) (N=10) (N=10) (N=10) (N=0) (N=10) (N=9) (N=9) (N=10) (N=10) (N=437)<br />
Dec-a Dec-c Dec-d Dec-j Dec-l Dec-m Dec-r Dec-u Dec-v Dec-x Dec-y ECLE<br />
Monitoring Sites<br />
Reference Sites<br />
120
C12: Box plots – Deception <strong>Bay</strong> (EPA DATA) (Cont.)<br />
Deception <strong>Bay</strong>, 2001<br />
Figure 18g 2g Ammonia at sites in Deception <strong>Bay</strong><br />
0.020<br />
Ammonia (mg N/L)<br />
0.015<br />
0.010<br />
0.005<br />
0.000<br />
(N=10) (N=9) (N=10) (N=10) (N=10) (N=0) (N=10) (N=9) (N=9) (N=10) (N=10) (N=437)<br />
Dec-a Dec-c Dec-d Dec-j Dec-l Dec-m Dec-r Dec-u Dec-v Dec-x Dec-y ECLE<br />
Monitoring Sites<br />
Reference Sites<br />
Figure 18h 2h Total nitrogen at sites in Deception <strong>Bay</strong><br />
0.5<br />
Total nitrogen (mg N/L)<br />
0.4<br />
0.3<br />
0.2<br />
0.1<br />
0.0<br />
(N=10) (N=9) (N=10) (N=10) (N=10) (N=0) (N=10) (N=9) (N=9) (N=10) (N=10) (N=436)<br />
Dec-a Dec-c Dec-d Dec-j Dec-l Dec-m Dec-r Dec-u Dec-v Dec-x Dec-y ECLE<br />
Monitoring Sites<br />
Reference Sites<br />
Figure 18i 2i Total phosphorus at sites in Deception <strong>Bay</strong><br />
0.12<br />
0.10<br />
Total phosphorus (mg P/L)<br />
0.08<br />
0.06<br />
0.04<br />
0.02<br />
0.00<br />
(N=10) (N=9) (N=10) (N=10) (N=10) (N=0) (N=10) (N=9) (N=9) (N=10) (N=10) (N=437)<br />
Dec-a Dec-c Dec-d Dec-j Dec-l Dec-m Dec-r Dec-u Dec-v Dec-x Dec-y ECLE<br />
Monitoring Sites<br />
Reference Sites<br />
121
C12: Box plots – Deception <strong>Bay</strong> (EPA DATA) (Cont.)<br />
Deception <strong>Bay</strong>, 2001<br />
Figure 18j 2g Ammonia at sites in Deception <strong>Bay</strong><br />
0.020<br />
Ammonia (mg N/L)<br />
0.015<br />
0.010<br />
0.005<br />
0.000<br />
(N=10) (N=9) (N=10) (N=10) (N=10) (N=0) (N=10) (N=9) (N=9) (N=10) (N=10) (N=437)<br />
Dec-a Dec-c Dec-d Dec-j Dec-l Dec-m Dec-r Dec-u Dec-v Dec-x Dec-y ECLE<br />
Monitoring Sites<br />
Reference Sites<br />
Figure 18k 2h Total nitrogen at sites in Deception <strong>Bay</strong><br />
0.5<br />
Total nitrogen (mg N/L)<br />
0.4<br />
0.3<br />
0.2<br />
0.1<br />
0.0<br />
(N=10) (N=9) (N=10) (N=10) (N=10) (N=0) (N=10) (N=9) (N=9) (N=10) (N=10) (N=436)<br />
Dec-a Dec-c Dec-d Dec-j Dec-l Dec-m Dec-r Dec-u Dec-v Dec-x Dec-y ECLE<br />
Monitoring Sites<br />
Reference Sites<br />
0.12<br />
Figure 18l 2i Total phosphorus at sites in Deception <strong>Bay</strong><br />
0.10<br />
Total phosphorus (mg P/L)<br />
0.08<br />
0.06<br />
0.04<br />
0.02<br />
0.00<br />
(N=10) (N=9) (N=10) (N=10) (N=10) (N=0) (N=10) (N=9) (N=9) (N=10) (N=10) (N=437)<br />
Dec-a Dec-c Dec-d Dec-j Dec-l Dec-m Dec-r Dec-u Dec-v Dec-x Dec-y ECLE<br />
Monitoring Sites<br />
Reference Sites<br />
122
Appendix D: Results of Regression Analysis of Long Term Trends<br />
Although for most sites studies data has been collected only for a few recent years, a regression analysis of<br />
long-term trends was undertaken. Table 31 summarises sites and indicators for which statistically significant<br />
linear trends were detected using Regression Analysis. Conductivity was used as a covariate in the analysis<br />
to approximately normalise the results for rainfall events. The p value indicates the probability of the trend<br />
not being real. The R 2 value indicates how much of the variation in the data is explained by the linear trend.<br />
The coefficient of change indicates the amount of annual change, and is represented as a percentage for<br />
those indicators that were log transformed prior to analysis.<br />
Table 31. Significant linear trends for each site and indicator combination. The source of the data (PRCMP or EPA) and the years that<br />
the data span are indicated. Trends of improving water quality are shaded green, trends of deteriorating water quality are shaded red.<br />
<strong>Water</strong>way Site Variable Sample size Source Years p R 2 Annual change<br />
Bells Creek<br />
BE-a PH 44 PRCMP 1997-2001 0.023 2.79 0.1001<br />
BE-a SECCHI 44 PRCMP 1997-2001 0.015 2.15 9.3%<br />
Cab-1.6 AMMN 85 EPA 1994-2001
Appendix E: Results of Depth Profile Analysis<br />
Regression analyses were used to determine whether depth stratification of physico-chemical<br />
indicators was evident at the canal sites on Bribie Island. When data collected on different dates for<br />
each site was grouped, stratification was not evident, indicating that stratification was obvious on only<br />
some days. The following graphs show sites, dates indicators for which some stratification was<br />
evident.<br />
Figure 20: Depth stratification of pH at BRI-1. DEPTH (m)<br />
Figure 19. Results of Regression Analysis for pH at site BRI-1 to test for stratification with depth.<br />
124
Figure 21: Depth stratification of dissolved oxygen at BRI-5<br />
Figure 22: Depth stratification of dissolved oxygen at BRI-6<br />
125
Appendix F: Map of Fish Community Assessment<br />
Figure 23: Overall fish habitat ratings in the <strong>Caboolture</strong> region (Langdon, 2001)<br />
126
Appendix G: Map of Riparian Vegetation Assessment<br />
Figure 24. Riparian vegetation size index (ANA, 1998)<br />
Figure 25. Riparian vegetation integrity (ANA, 1998)<br />
127
Appendix H: Map of Land Use Zones<br />
Figure 26. GIS-based land use mapping (<strong>Caboolture</strong> Shire Council)<br />
128

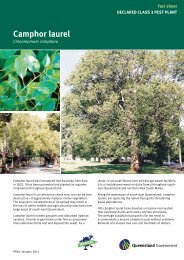


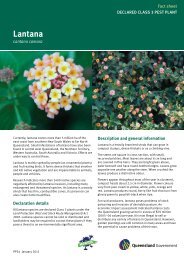
![Kumbartcho Brochure [PDF 540KB] - Moreton Bay Regional Council](https://img.yumpu.com/47220970/1/190x101/kumbartcho-brochure-pdf-540kb-moreton-bay-regional-council.jpg?quality=85)