Evaluation Findings - SAMHSA Store - Substance Abuse and Mental ...
Evaluation Findings - SAMHSA Store - Substance Abuse and Mental ...
Evaluation Findings - SAMHSA Store - Substance Abuse and Mental ...

You also want an ePaper? Increase the reach of your titles
YUMPU automatically turns print PDFs into web optimized ePapers that Google loves.
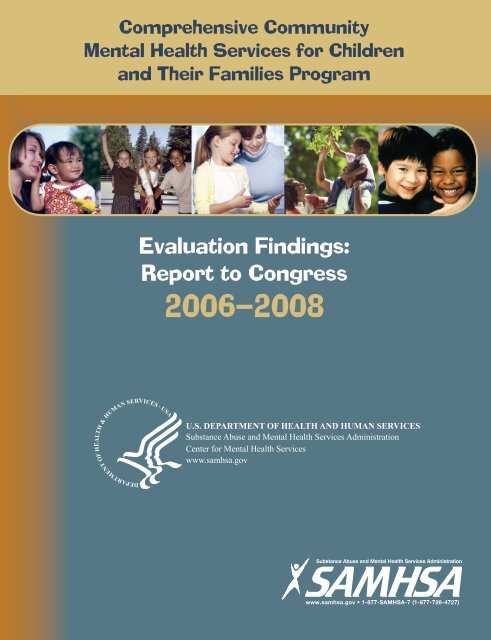
Comprehensive Community<br />
<strong>Mental</strong> Health Services for Children<br />
<strong>and</strong> Their Families Program<br />
<strong>Evaluation</strong> <strong>Findings</strong>:<br />
Report to Congress<br />
2006–2008
The Comprehensive Community <strong>Mental</strong><br />
Health Services for Children <strong>and</strong><br />
Their Families Program<br />
<strong>Evaluation</strong> <strong>Findings</strong><br />
Report to Congress<br />
2006–2008<br />
Center for <strong>Mental</strong> Health Services<br />
<strong>Substance</strong> <strong>Abuse</strong> <strong>and</strong> <strong>Mental</strong> Health Services Administration<br />
U.S. Department of Health <strong>and</strong> Human Services
U.S. Department of Health <strong>and</strong> Human Services<br />
Kathleen Sebelius<br />
Secretary<br />
<strong>Substance</strong> <strong>Abuse</strong> <strong>and</strong> <strong>Mental</strong> Health Services Administration<br />
Pamela S. Hyde, J.D.<br />
Administrator<br />
Center for <strong>Mental</strong> Health Services<br />
A. Kathryn Power, M.Ed.<br />
Director<br />
Division of Service <strong>and</strong> Systems Improvement<br />
Fran R<strong>and</strong>olph, Dr.P.H.<br />
Director<br />
Child, Adolescent <strong>and</strong> Family Branch<br />
Gary M. Blau, Ph.D.<br />
Branch Chief<br />
The Comprehensive Community <strong>Mental</strong> Health Services for Children <strong>and</strong> Their Families Program,<br />
<strong>Evaluation</strong> findings—Report to Congress, 2006–2008 was written by staff at ICF Macro <strong>and</strong> Walter R.<br />
McDonald & Associates, Inc. pursuant to a contract (contract numbers 280-03-1603, 280-03-1604, 280-<br />
05-0135) under the direction of the Child, Adolescent <strong>and</strong> Family Branch, Center for <strong>Mental</strong> Health<br />
Services, <strong>Substance</strong> <strong>Abuse</strong> <strong>and</strong> <strong>Mental</strong> Health Services Administration, United States Department of<br />
Health <strong>and</strong> Human Services.
Table of Contents<br />
Program Overview......................................................................................................... 1<br />
The System of Care Philosophy <strong>and</strong> Goals ............................................................. 1<br />
System of Care Philosophy ................................................................................. 1<br />
System of Care Goals ......................................................................................... 2<br />
Theory of Change Model ......................................................................................... 2<br />
CMHI Program Funding Process ............................................................................ 4<br />
The National <strong>Evaluation</strong> of the CMHI ........................................................................... 4<br />
Studies of the National <strong>Evaluation</strong> .......................................................................... 5<br />
Performance Measurement ..................................................................................... 6<br />
About This Report ......................................................................................................... 7<br />
Key <strong>Findings</strong> From the National <strong>Evaluation</strong> ............................................................. 10<br />
Who Are the Children, Youth, <strong>and</strong> Families Participating in Systems of Care ..... 10<br />
To What Extent Do Outcomes for Children, Youth, <strong>and</strong> Families Improve over<br />
Time .................................................................................................................... 12<br />
Clinical Outcomes ............................................................................................. 13<br />
Functional Outcomes ........................................................................................ 15<br />
Caregiver Outcomes ......................................................................................... 18<br />
Outcomes for Specific Populations of Focus ..................................................... 19<br />
Outcomes for Specific Age Groups ................................................................... 21<br />
What Is the Service Experience for Children, Youth, <strong>and</strong> Families in Systems of<br />
Care .................................................................................................................... 24<br />
How Well Are System of Care Principles Implemented ....................................... 25<br />
How Well Are Communities Implementing Evidence-Based Practices ............... 29<br />
How Culturally <strong>and</strong> Linguistically Competent Are Practices in Systems of Care . 30<br />
How Are Flexible Funds Used Within Systems of Care....................................... 31<br />
What Are the Cost Savings <strong>and</strong> Economic Benefits of Systems of Care ............ 31<br />
How Well Do Systems of Care Integrate Data <strong>and</strong> Technology .......................... 32<br />
To What Extent Do Systems of Care Implement Strategies to Sustain Their<br />
Services Beyond the Federally Funded Grant Period ......................................... 33<br />
Summary <strong>and</strong> Recommendations.............................................................................. 36<br />
Summary ............................................................................................................... 36<br />
Recommendations for the Future .......................................................................... 37<br />
References ................................................................................................................... 39<br />
Appendices<br />
A. Glossary of Terms<br />
B. System of Care Communities of the Comprehensive Community <strong>Mental</strong> Health<br />
Services for Children <strong>and</strong> Their Families Program, 1993–2009<br />
C. Description of CQI Indicators <strong>and</strong> Data Sources<br />
D. National <strong>Evaluation</strong> Components <strong>and</strong> Measures<br />
E. Descriptive <strong>and</strong> Outcomes Data Tables<br />
The Comprehensive Community <strong>Mental</strong> Health Services for Children <strong>and</strong> Their Families Program <strong>Evaluation</strong> <strong>Findings</strong><br />
2006–2008 Annual Report to Congress ● Table of Contents
Program Overview<br />
The Comprehensive Community <strong>Mental</strong><br />
Health Services for Children <strong>and</strong> Their<br />
Families Program (Child <strong>Mental</strong> Health<br />
Initiative or CMHI) operates under the<br />
auspices of the Child, Adolescent <strong>and</strong> Family<br />
Branch (CAFB) in the Center for <strong>Mental</strong><br />
Health Services (CMHS), <strong>Substance</strong> <strong>Abuse</strong><br />
<strong>and</strong> <strong>Mental</strong> Health Services Administration<br />
(<strong>SAMHSA</strong>) within the Department of Health<br />
<strong>and</strong> Human Services (HHS). The CMHI is<br />
designed to promote the transformation of the<br />
national mental health care system that serves<br />
children <strong>and</strong> youth (aged 0 to 21 years)<br />
diagnosed with a serious emotional<br />
disturbance <strong>and</strong> their families. CMHI funds<br />
the development <strong>and</strong> implementation of<br />
comprehensive <strong>and</strong> coordinated ―systems of<br />
care‖ among States, local communities,<br />
United States territories, American Indian<br />
Tribes, <strong>and</strong> Alaska Native communities.<br />
These systems of care are intended to build<br />
on the individual strengths of the children,<br />
youth, <strong>and</strong> families being served, <strong>and</strong> address<br />
their needs. Since CMHI’s inception in 1993,<br />
173 grants <strong>and</strong> cooperative agreements have<br />
been awarded to communities for this purpose.<br />
To be eligible for CMHI services children <strong>and</strong><br />
youth must have, or have had at any time<br />
during the past year, a mental, behavioral, or<br />
emotional disorder of sufficient duration to<br />
meet diagnostic criteria as specified in the<br />
Diagnostic <strong>and</strong> Statistical Manual for <strong>Mental</strong><br />
Disorders, Fourth Edition (DSM–IV;<br />
American Psychiatric Association [APA],<br />
1994) that resulted in functional impairment<br />
that substantially interferes with or limits one<br />
or more major life activities. Beginning with<br />
the 2005 funding announcement, the<br />
Diagnostic Classification of <strong>Mental</strong> Health<br />
<strong>and</strong> Developmental Disorders of Infancy <strong>and</strong><br />
Early Childhood (DC:0–3; ZERO TO<br />
THREE, 1994) is specified for diagnostic<br />
assessment for children 3 years of age or<br />
younger.<br />
The System of Care Philosophy<br />
<strong>and</strong> Goals<br />
CMHI was shaped by several Federal <strong>and</strong><br />
State initiatives, beginning with the Child <strong>and</strong><br />
Adolescent Service System Program (CASSP)<br />
(see Stroul & Friedman, 1986, for a<br />
comprehensive discussion of the program’s<br />
background). CASSP was a national effort<br />
designed to help States <strong>and</strong> communities build<br />
comprehensive, community-based systems of<br />
care that were youth <strong>and</strong> family focused.<br />
Since that time, this approach has become the<br />
cornerstone of many mental health service<br />
delivery programs within communities across<br />
the country, <strong>and</strong> in the territories.<br />
The Federal Action Agenda was the product<br />
of a collaborative effort of the Departments of<br />
Health <strong>and</strong> Human Services; Education;<br />
Housing <strong>and</strong> Urban Development; Justice;<br />
Labor; Veteran’s Affairs; <strong>and</strong> the Social<br />
Security Administration, <strong>and</strong> was intended to<br />
develop a common national m<strong>and</strong>ate for<br />
mental health services. CMHI was based on<br />
the principles outlined in that document,<br />
which asserted that the mental health service<br />
delivery system must focus its efforts on<br />
helping children with serious emotional<br />
disturbance to ―. . . live, work, learn, <strong>and</strong><br />
participate fully in their communities‖<br />
(<strong>SAMHSA</strong>, 2005, p. 78). <strong>SAMHSA</strong>’s<br />
utilization of the ―system of care‖ philosophy<br />
as the approach for CMHI funding has made a<br />
substantive contribution to the fulfillment of<br />
this m<strong>and</strong>ate.<br />
System of Care Philosophy<br />
Underlying the system of care approach is the<br />
belief that services should be both<br />
comprehensive <strong>and</strong> coordinated across public<br />
<strong>and</strong> private providers, consumers, <strong>and</strong> other<br />
key stakeholders. When this comprehensive<br />
<strong>and</strong> coordinated system is in place, it is<br />
The Comprehensive Community <strong>Mental</strong> Health Services for Children <strong>and</strong> Their Families Program <strong>Evaluation</strong> <strong>Findings</strong><br />
2006–2008 Annual Report to Congress ● Page 1
anticipated that resulting services <strong>and</strong> supports<br />
will (a) be effective, (b) build on the strengths<br />
of the individual; <strong>and</strong> (c) address each person's<br />
unique physical, emotional, social, cultural,<br />
intellectual, <strong>and</strong> linguistic needs. When mental<br />
health services achieve these objectives,<br />
children <strong>and</strong> youth are able to live, grow,<br />
learn, work, <strong>and</strong> participate in the<br />
communities in which they reside. The<br />
principles embodied in the system of care<br />
approach are listed below:<br />
<br />
<br />
Deliver culturally <strong>and</strong> linguistically<br />
competent services with special emphasis<br />
on racial, ethnic, linguistically diverse<br />
<strong>and</strong> other underrepresented, underserved,<br />
or invisible cultural groups; <strong>and</strong><br />
Implement the full participation of youth<br />
<strong>and</strong> families in service planning, in the<br />
development, evaluation, <strong>and</strong><br />
sustainability of local services <strong>and</strong><br />
supports, <strong>and</strong> in overall system<br />
transformation activities.<br />
<br />
<br />
<br />
<br />
<br />
<br />
<br />
<br />
Family driven<br />
Individualized, strengths-based, <strong>and</strong><br />
evidence-informed service plans<br />
Youth guided<br />
Culturally <strong>and</strong> linguistically competent<br />
Provided in the least restrictive<br />
environment possible<br />
Community based<br />
Accessible<br />
Provided through a collaborative <strong>and</strong><br />
coordinated interagency network<br />
System of Care Goals<br />
With the system of care philosophy <strong>and</strong><br />
principles as the theoretical underpinning for<br />
the CMHI program, the following goals were<br />
developed for CMHI grant communities:<br />
<br />
<br />
<br />
<br />
Exp<strong>and</strong> community capacity to serve<br />
children <strong>and</strong> adolescents with serious<br />
emotional disturbance <strong>and</strong> their families;<br />
Encourage communities to provide a<br />
broad array of accessible, clinically<br />
effective <strong>and</strong> fiscally accountable<br />
services, treatments <strong>and</strong> supports;<br />
Serve as a catalyst for broad-based,<br />
sustainable systemic change inclusive of<br />
policy reform <strong>and</strong> infrastructure<br />
development across the country <strong>and</strong> in<br />
United States territories;<br />
Create a care management team with an<br />
individualized service plan for each<br />
child;<br />
These goals help frame communities’<br />
strategies for implementing a system of care<br />
that both taps into the strengths <strong>and</strong><br />
addresses the needs of the children <strong>and</strong><br />
families they serve.<br />
Theory of Change Model<br />
Figure 1 depicts a theory-based framework to<br />
describe the program, which was developed<br />
with input from partners across the country.<br />
The framework articulates the underlying<br />
assumptions that guide service delivery <strong>and</strong><br />
are believed to be critical to producing change<br />
<strong>and</strong> improvement in children <strong>and</strong> families.<br />
The framework has four core elements—<br />
program context, guiding principles,<br />
strategies, <strong>and</strong> outcomes—as well as an<br />
evaluation-<strong>and</strong>-feedback cycle.<br />
The model <strong>and</strong> guiding principles provide a<br />
foundation upon which system of care<br />
strategies are built. These strategies are<br />
grounded in a community ownership <strong>and</strong><br />
planning process that engages the multiple<br />
partners in work to improve the well-being of<br />
children <strong>and</strong> families. As depicted in the far<br />
right of the framework, the outcomes are<br />
organized into practice, child <strong>and</strong> family, <strong>and</strong><br />
system categories. Finally, the framework<br />
includes an evaluation-<strong>and</strong>-feedback cycle<br />
that uses the best <strong>and</strong> most current research<br />
<strong>and</strong> incorporates concepts of internal<br />
evaluation, quality improvement, adaptation,<br />
<strong>and</strong> accountability.<br />
The Comprehensive Community <strong>Mental</strong> Health Services for Children <strong>and</strong> Their Families Program <strong>Evaluation</strong> <strong>Findings</strong><br />
2006–2008 Annual Report to Congress ● Page 2
Figure 1: System of Care Theory-Based Framework<br />
The Comprehensive Community <strong>Mental</strong> Health Services for Children <strong>and</strong> Their Families Program <strong>Evaluation</strong> <strong>Findings</strong><br />
2006–2008 Annual Report to Congress ● Page 3
CMHI Program Funding Process<br />
State governments; governmental units<br />
within political subdivisions of a State, such<br />
as a county, city, or town; the District of<br />
Columbia, Indian Tribes or tribal<br />
organizations; <strong>and</strong> United States territories<br />
may apply for CMHI grants, which are<br />
funded on a matching basis over a 6-year<br />
period. During the first 3 years of the<br />
agreement, CMHS matches organizational<br />
funding at a 3-to-1 level. In the fourth year,<br />
there is a dollar-to-dollar match. During the<br />
fifth <strong>and</strong> sixth years, CMHS provides one<br />
dollar for every two contributed by the grant<br />
community.<br />
The CMHI provides resources to<br />
communities to develop their systems of<br />
care to best address the needs of children<br />
<strong>and</strong> youth who experience serious mental<br />
health challenges, <strong>and</strong> their families. The<br />
program has grown from initial program<br />
funding in 1993 of $4.9 million to a total<br />
investment of over $1.5 billion as of FY<br />
2010. The funded grant communities have<br />
worked to increase capacity for services, <strong>and</strong><br />
improve service provision in communities<br />
across all 50 States, Puerto Rico, <strong>and</strong> Guam,<br />
<strong>and</strong> among 18 American Indian/Alaska<br />
Native communities as of FY 2008. Through<br />
FY 2008, the CMHI has served over 92,990<br />
children, youth, <strong>and</strong> families nationwide.<br />
The National <strong>Evaluation</strong> of the CMHI<br />
The national evaluation, m<strong>and</strong>ated by Public<br />
Law 102–321, is an important component of<br />
the CMHI. Grant communities in all phases<br />
agree to participate in the national<br />
evaluation of CMHI at some level, as part of<br />
their agreement with <strong>SAMHSA</strong>. This<br />
component of the program has been<br />
designed to provide information on (a) the<br />
mental health outcomes of children <strong>and</strong><br />
youth, <strong>and</strong> their families; (b) the<br />
implementation, process, <strong>and</strong> sustainability<br />
of systems of care; <strong>and</strong> (c) critical <strong>and</strong><br />
emerging issues in children’s mental health.<br />
<strong>Findings</strong> from the national evaluation have<br />
informed future service delivery <strong>and</strong><br />
treatment, program funding decisions, <strong>and</strong><br />
modifications to existing U.S. mental health<br />
policies related to existing service systems.<br />
The national evaluation has provided the<br />
CMHI with monitoring <strong>and</strong> performance<br />
data <strong>and</strong> has demonstrated the program’s<br />
achievements (CMHS, 1997, 1998, 1999,<br />
2000, 2001, 2003, 2004, 2005, 2006, 2007,<br />
<strong>and</strong> 2008). Table 1 shows the goals of the<br />
national evaluation as defined by Public<br />
Law 102-321.<br />
Figure 2 provides a timeline of the years of<br />
program funding <strong>and</strong> the phases of the<br />
national evaluation. A list of all funded<br />
system of care communities <strong>and</strong> a map<br />
showing the distribution of funded sites are<br />
included in Appendix B.<br />
The Comprehensive Community <strong>Mental</strong> Health Services for Children <strong>and</strong> Their Families Program <strong>Evaluation</strong> <strong>Findings</strong><br />
2006–2008 Annual Report to Congress ● Page 4
Figure 2: Timeline of System of Care Funding <strong>and</strong> Phases of the National <strong>Evaluation</strong><br />
1994 1995 1996 1997 1998 1999 2000 2001 2002 2003 2004 2005 2006 2007 2008 2008 2010 2011 2012<br />
2013<br />
4 Grantees Funded in 1993 <strong>and</strong> 18 in 1994<br />
<strong>Evaluation</strong> Phase I<br />
9 Grantees Funded in 1997<br />
<strong>Evaluation</strong> Phase II<br />
14 Grantees Funded in 1998<br />
<strong>Evaluation</strong> Phase II<br />
22 Grantees Funded in 1999 <strong>and</strong> 2000<br />
<strong>Evaluation</strong> Phase III<br />
18 Cooperative Agreements Funded in 2002<br />
<strong>Evaluation</strong> Phase IV<br />
7 Cooperative Agreements Funded in 2003 <strong>and</strong> 4 in 2004<br />
<strong>Evaluation</strong> Phase IV<br />
25 Cooperative Agreements Funded in 2005 <strong>and</strong> 5 in 2006<br />
<strong>Evaluation</strong> Phase V<br />
System of care communities are diverse with<br />
respect to their catchment areas. Some<br />
systems of care are located in high-risk postal<br />
ZIP code neighborhoods <strong>and</strong> others are<br />
statewide initiatives. The 81 sites addressed<br />
in this report include about 9 percent<br />
neighborhood-based initiatives, 41 percent<br />
single county-wide initiatives, 27 percent<br />
multi-county initiatives, 5 percent statewide<br />
initiatives, <strong>and</strong> 12 percent tribal initiatives.<br />
About 41 percent of the communities are<br />
largely urban, 32 percent are largely rural,<br />
<strong>and</strong> about 27 percent are an<br />
urban/suburban/rural mix.<br />
Studies of the National<br />
<strong>Evaluation</strong><br />
The national evaluation consists of core <strong>and</strong><br />
special studies. The descriptive core study<br />
provides demographic information on the<br />
children, youth, <strong>and</strong> families served by<br />
funded systems of care, whereas the<br />
longitudinal core study provides an<br />
assessment of changes over time in clinical<br />
<strong>and</strong> other outcomes of children, youth, <strong>and</strong><br />
families. For these two studies, data are<br />
collected from youth <strong>and</strong> caregivers who<br />
agree to participate in the evaluation starting<br />
at intake into the program, <strong>and</strong> occurs at 6-<br />
month intervals over a number of years (from<br />
intake to 36 months). This longitudinal<br />
approach enables the national evaluation to<br />
examine clinical <strong>and</strong> functional outcomes for<br />
children <strong>and</strong> youth, <strong>and</strong> family <strong>and</strong> caregiver<br />
outcomes, across time.<br />
Other core studies examine the development<br />
<strong>and</strong> implementation of mental health services<br />
infrastructure <strong>and</strong> service delivery systems<br />
based upon the system of care philosophy<br />
<strong>and</strong> principles, <strong>and</strong> the long-term<br />
sustainability of such systems. Still others<br />
examine the services provided to children,<br />
youth, <strong>and</strong> families <strong>and</strong> the costs of those<br />
services, <strong>and</strong> the service experience of<br />
families.<br />
Studies on special topics include, but are not<br />
limited to, examinations of cultural<br />
competence in the structure <strong>and</strong> provision of<br />
services, the use of evidence-based practices<br />
<strong>and</strong> treatments, <strong>and</strong> the role of primary care<br />
health providers in the mental health care<br />
system. Within the context of these studies,<br />
the national evaluation has addressed<br />
emerging needs of the program related to<br />
evidence-based practice, the development of<br />
practice-based evidence, provider practices,<br />
collaboration between pediatricians <strong>and</strong><br />
mental health providers in systems of care,<br />
<strong>and</strong> comparisons between children <strong>and</strong> youth<br />
The Comprehensive Community <strong>Mental</strong> Health Services for Children <strong>and</strong> Their Families Program <strong>Evaluation</strong> <strong>Findings</strong><br />
2006–2008 Annual Report to Congress ● Page 5
eceiving services by grant programs <strong>and</strong><br />
those receiving services elsewhere.<br />
Performance Measurement<br />
The national evaluation also provides important<br />
feedback to the Federal program, communities,<br />
<strong>and</strong> technical assistance providers to strengthen<br />
program efforts at all levels.<br />
<strong>and</strong> Results Act (GPRA) of 1993 indicators<br />
are noteworthy. GPRA serves to hold<br />
communities accountable for program<br />
development, implementation, <strong>and</strong><br />
sustainability <strong>and</strong> encourages the use of<br />
feedback for infrastructure <strong>and</strong> service level<br />
change. CMHI GPRA indicators are listed in<br />
Table 1.<br />
Improvements in program outcomes as<br />
evidenced by the Government Performance<br />
Table 1: GPRA Indicators for FYs 2006, 2007, <strong>and</strong> 2008<br />
GPRA Program Indicators<br />
Actual<br />
Performance<br />
2006<br />
Actual<br />
Performance<br />
2007<br />
Actual<br />
Performance<br />
2008<br />
1) Increase in number of children receiving<br />
services<br />
Target: 9,120 10,339 8,384 9,678<br />
2) Increase in percentage of children attending<br />
school 75% or more of time after 12 months<br />
Target: 84% 89.7% 87.0% 87.0%<br />
3) Increase in percentage of children with no law<br />
enforcement contacts at 6 months<br />
FY 2006 Target: 68%<br />
FY 2007 Target: 70%<br />
FY 2008 Target: 68%<br />
69.3% 73.6% 73.8%<br />
4) Decrease average days of inpatient facilities<br />
among children served in systems of care at 6<br />
months<br />
FY 2006 Target: -3.65 days<br />
FY 2007 Target: -2.00 days<br />
FY 2008 Target: -2.00 days<br />
-1.00% -2.18 days -1.68 days<br />
5) Decrease in inpatient care costs per 1,000<br />
children served<br />
FY 2006 Target: Establish new baseline<br />
FY 2007 Target: -$2,670,000<br />
FY 2008 Target: -$2,670,000<br />
-$1,335,000 - $2,990,300 -$2,238,201<br />
The Comprehensive Community <strong>Mental</strong> Health Services for Children <strong>and</strong> Their Families Program <strong>Evaluation</strong> <strong>Findings</strong><br />
2006–2008 Annual Report to Congress ● Page 6
In addition, at the request of <strong>SAMHSA</strong>, the<br />
national evaluation developed the<br />
Continuous Quality Improvement (CQI)<br />
Progress Reports, to document program<br />
performance at the community <strong>and</strong> national<br />
levels, <strong>and</strong> to assist communities in<br />
furthering program goals of continuous<br />
quality improvement. The first reports were<br />
produced in 2006. Program performance<br />
addressed in these reports includes (a)<br />
system-level outcomes, (b) child <strong>and</strong> family<br />
outcomes, (c) satisfaction with services, (d)<br />
family <strong>and</strong> youth involvement, <strong>and</strong> (e)<br />
cultural <strong>and</strong> linguistic competence. These<br />
indicators, which capture performance in<br />
areas such as service access, school<br />
performance, suicide attempts, youth arrests,<br />
caregiver employment, satisfaction with<br />
services, <strong>and</strong> provider cultural <strong>and</strong> linguistic<br />
competence, align with <strong>SAMHSA</strong>’s<br />
National Outcome Measures (otherwise<br />
known as NOMs). The indicators assessed<br />
through the CQI process <strong>and</strong> an aggregate<br />
CQI report that uses longitudinal outcomes<br />
data collected as part of the national<br />
evaluation of grant communities initially<br />
funded in 2002–2004 are included in<br />
Appendix C.<br />
About This Report<br />
This report to Congress summarizes<br />
information about the systems of care<br />
developed through the CMHI, including the<br />
following: the characteristics of children,<br />
youth, <strong>and</strong> families served by systems of<br />
care; the outcomes attained for children,<br />
youth, <strong>and</strong> families; their service use <strong>and</strong><br />
service experience; how well communities<br />
have implemented system of care principles;<br />
the cost savings <strong>and</strong> economic benefits; how<br />
well communities have implemented<br />
evidence-based practices, how culturally <strong>and</strong><br />
linguistically competent the services are,<br />
how well systems of care integrate data <strong>and</strong><br />
technology, <strong>and</strong> the sustainability of systems<br />
of care.<br />
The report presents the combined evaluation<br />
findings from the 81 communities initially<br />
funded in FY 1999 through FY 2006. The<br />
findings are from three phases of the<br />
evaluation: communities:<br />
Phase III: Initially funded in FY 1999–FY<br />
2000 (22 sites)<br />
Phase IV: Initially funded in FY 2002–FY<br />
2004 (29 sites)<br />
Phase V: Initially funded in FY 2005–FY<br />
2006 (30 sites)<br />
All findings presented in the report are<br />
based upon all available data for the<br />
combined phases. In some instances, data<br />
were not available from all three phases, <strong>and</strong><br />
instruments sometimes changed from one<br />
phase to another. In each outcome area, the<br />
report indicates whether data were derived<br />
from the entire sample of 81 communities or<br />
from a subgroup of communities; the<br />
instruments used to derive data also are<br />
noted throughout the report. Descriptive data<br />
were collected from 28,423 children<br />
enrolled in these CMHI grant communities.<br />
Longitudinal data were collected from 9,952<br />
caregivers <strong>and</strong> 6,392 youth aged 11 years<br />
<strong>and</strong> older. The longitudinal data were<br />
collected every 6 months for up to 36<br />
months following intake into services.<br />
Sources of data used for the report include<br />
the following:<br />
<br />
Descriptive data (e.g., demographic<br />
information, diagnosis, child <strong>and</strong> family<br />
history, functional characteristics, <strong>and</strong><br />
referral sources) obtained at the time<br />
The Comprehensive Community <strong>Mental</strong> Health Services for Children <strong>and</strong> Their Families Program <strong>Evaluation</strong> <strong>Findings</strong><br />
2006–2008 Annual Report to Congress ● Page 7
children/youth entered system of care<br />
services across the grant-funded period.<br />
Child, youth, <strong>and</strong> family outcomes<br />
data based on longitudinal assessments<br />
of children/youth at intake, 6 months, 12<br />
months, 18 months, <strong>and</strong> 24 months. Data<br />
were collected at these intervals<br />
regarding the child’s or youth’s clinical<br />
<strong>and</strong> social functioning, behavioral <strong>and</strong><br />
emotional strengths, educational<br />
performance, delinquent activities <strong>and</strong><br />
engagement with law enforcement, use<br />
of illegal substances, <strong>and</strong> the stability of<br />
their living arrangements. Data also were<br />
collected about family resources <strong>and</strong><br />
family functioning <strong>and</strong> on the strain felt<br />
by family caregivers when caring for<br />
children/youth who experience serious<br />
emotional disturbance.<br />
Service provision data, including the<br />
services received by children, youth, <strong>and</strong><br />
families, their experience with their<br />
service providers, <strong>and</strong> their satisfaction<br />
with their services.<br />
Data related to cost savings <strong>and</strong><br />
economic benefits associated with<br />
systems of care that were interview data<br />
from the outcome study or were data<br />
made available by service agencies from<br />
their electronic information systems.<br />
Data related to system-level changes<br />
made to implement system of care<br />
principles collected through multiple<br />
comprehensive site visits that were<br />
conducted in all grant communities at<br />
regular intervals throughout the grant<br />
funding cycle.<br />
Data related to sustainability obtained<br />
by surveying key informants in CMHI<br />
systems of care.<br />
Data on age-specific findings based on<br />
longitudinal assessments of selected<br />
groups of children/youth at intake, 6<br />
months, 12 months, 18 months, <strong>and</strong> 24<br />
months.<br />
<br />
<br />
<br />
<br />
<br />
Data on findings for specific<br />
populations of focus based on<br />
longitudinal assessments of selected<br />
groups of children/youth at intake, 6<br />
months, 12 months, 18 months, <strong>and</strong> 24<br />
months.<br />
Data on how communities are<br />
implementing evidence-based practices<br />
obtained through a special study.<br />
Data on the cultural <strong>and</strong> linguistic<br />
competence of service delivery obtained<br />
through special studies.<br />
The design of the Longitudinal Child <strong>and</strong><br />
Family Outcome Study in cohorts of<br />
grantees described in this report did not<br />
include a control group. Therefore, the<br />
findings presented are limited to the<br />
analyses of change in outcomes over<br />
time.<br />
Some children <strong>and</strong> youth dropped out<br />
from the study over time. Appendix E<br />
contains information about study<br />
enrollment <strong>and</strong> interview completion<br />
rates. The analyses of changes in<br />
ouitcomes over time were limited to those<br />
children <strong>and</strong> youth who had complete<br />
information on the variables of interest.<br />
A glossary of terms used in this report is<br />
provided in Appendix A. Core study<br />
components of the evaluation are listed in<br />
Table 2. More details about national<br />
evaluation components <strong>and</strong> measures are<br />
provided in Appendix D.<br />
The Comprehensive Community <strong>Mental</strong> Health Services for Children <strong>and</strong> Their Families Program <strong>Evaluation</strong> <strong>Findings</strong><br />
2006–2008 Annual Report to Congress ● Page 8
Table 2: Core Components of the National <strong>Evaluation</strong><br />
<br />
<br />
<br />
<br />
<br />
<br />
System of Care Assessment examines whether programs have been implemented according to<br />
system of care program theory <strong>and</strong> documents how systems develop over time to meet the needs of<br />
the children/youth <strong>and</strong> families they serve.<br />
Cross-Sectional Descriptive Study describes the children enrolled in the funded systems of care in<br />
terms of their demographics, functional status, living arrangement, diagnosis, risk factors, <strong>and</strong> mental<br />
health service history.<br />
Longitudinal Child <strong>and</strong> Family Outcome Study examines the changes in child/youth clinical <strong>and</strong><br />
functional status <strong>and</strong> family life. Outcome data are used to assess change over time in<br />
symptomatology, social functioning, substance use, school attendance <strong>and</strong> performance,<br />
delinquency, <strong>and</strong> stability of living arrangements.<br />
Service Experience Study examines the types of services received <strong>and</strong> youth <strong>and</strong> family ratings of<br />
satisfaction with services provided.<br />
Services <strong>and</strong> Costs Study describes the services used by children/youth <strong>and</strong> families, their<br />
utilization patterns, <strong>and</strong> associated costs. The study also assesses the extent to which information<br />
about various services is captured through local management information systems.<br />
Sustainability Study explores the extent to which systems of care are maintained after funding from<br />
the CMHS grant program has ended, as well as steps being taken prepare for sustainability. The<br />
study identifies features of systems of care that are more likely to be sustained <strong>and</strong> factors that<br />
contribute to or impede the ability to sustain the systems of care developed with grant support.<br />
In addition to these core study components, new issues have emerged over time; ongoing current<br />
studies added to the evaluation are presented in Table 3.<br />
Table 3: Ongoing Current Studies Added to the National <strong>Evaluation</strong><br />
<br />
<br />
<br />
<br />
<br />
<br />
Treatment Effectiveness Study examines the effectiveness of a specific evidence-based treatment<br />
provided to selected groups of children/youth with specific diagnoses served within CMHS-funded<br />
systems of care.<br />
Evidence-Based Practices Study examines the effects of various factors on the implementation of<br />
evidence-based practices in systems of care.<br />
Family Education <strong>and</strong> Support Study examines the critical elements of family education <strong>and</strong><br />
support services in systems of care, their effectiveness across communities, <strong>and</strong> their impact on<br />
child/youth <strong>and</strong> family outcomes.<br />
Primary Care Provider Study investigates the role of primary health care providers in systems of<br />
care <strong>and</strong> factors that facilitate <strong>and</strong> interfere with interaction between primary care providers <strong>and</strong><br />
mental health providers.<br />
Culturally <strong>and</strong> Linguistically Competent Practices Studies assess system of care service<br />
providers‘ level of competence across several domains of cultural competence, including the role that<br />
organizations <strong>and</strong> agencies play in hindering or facilitating culturally competent service provision.<br />
Tribal Financing Study examines the unique financing opportunities <strong>and</strong> challenges experienced by<br />
American Indian <strong>and</strong> Alaska Native systems of care.<br />
The Comprehensive Community <strong>Mental</strong> Health Services for Children <strong>and</strong> Their Families Program <strong>Evaluation</strong> <strong>Findings</strong><br />
2006–2008 Annual Report to Congress ● Page 9
Appendix D shows the specific measures<br />
used for each component of the national<br />
evaluation <strong>and</strong> lists the complete title of<br />
each measure. It shows that, in some cases,<br />
different measures were used to assess the<br />
specific outcomes for communities initially<br />
funded in different time periods. Because of<br />
this variation, the relevant measures are<br />
specified for each outcome cited in this<br />
report.<br />
Key <strong>Findings</strong> From the National <strong>Evaluation</strong><br />
Who Are the Children, Youth,<br />
<strong>and</strong> Families Participating in<br />
Systems of Care<br />
All grant communities serve children/youth<br />
with severe emotional disturbance <strong>and</strong> their<br />
families. Systems of care differ, however,<br />
with regard to the age of children served, the<br />
focus of service delivery programs, <strong>and</strong> the<br />
point at which intervention begins. Most<br />
systems of care target youth who are<br />
involved with multiple public child-serving<br />
agencies, especially those who are at-risk for<br />
out-of-home placement. Some of the<br />
communities include older children/youth<br />
who are transitioning out of the children’s<br />
mental health or child welfare systems, <strong>and</strong><br />
others focus on young children aged 0 to 5.<br />
Table 4 shows that across all of the cohorts<br />
of sites included in this report, the<br />
children/youth served by federally funded<br />
systems of care are predominantly boys,<br />
with an average age of approximately 11.8<br />
years <strong>and</strong> the largest age group served is<br />
between the ages of 6 <strong>and</strong> 15 (nearly 71<br />
percent). The children, youth, <strong>and</strong> families<br />
served reflect racial <strong>and</strong> ethnic diversity.<br />
Approximately half of the children/youth<br />
live in single parent households <strong>and</strong> are in<br />
the custody of their mothers. Many of their<br />
households have very limited resources;<br />
over half have incomes below the poverty<br />
level.<br />
Table 4: Baseline Characteristics: Child Demographic <strong>and</strong> Enrollment Information, Grant<br />
Communities Initially Funded in 1999–2006<br />
Gender (n = 28,075)<br />
Male 64.2<br />
Female 35.8<br />
Age in Years (n = 27,911)<br />
0–5 Years 9.7<br />
6–11 Years 31.0<br />
12–15 Years 39.9<br />
16–21 Years 19.4<br />
Mean (SD) 11.8 (4.2)<br />
The Comprehensive Community <strong>Mental</strong> Health Services for Children <strong>and</strong> Their Families Program <strong>Evaluation</strong> <strong>Findings</strong><br />
2006–2008 Annual Report to Congress ● Page 10
Table 4: Baseline Characteristics: Child Demographic <strong>and</strong> Enrollment Information, Grant<br />
Communities Initially Funded in 1999–2006 (continued)<br />
Race <strong>and</strong> Ethnicity (n = 24,483)<br />
American Indian or Alaska Native Alone 6.2<br />
Asian Alone 1.0<br />
Black or African American Alone 26.8<br />
Native Hawaiian or Other Pacific Isl<strong>and</strong>er 1.3<br />
White Alone 40.7<br />
Of Hispanic Origin 20.3<br />
Multiracial 3.4<br />
Other 0.4<br />
Custody Status (n = 14,559)<br />
Biological mother only 45.2<br />
Two biological parents OR one biological <strong>and</strong> one step or adoptive parent 24.9<br />
Gr<strong>and</strong>parent(s) 4.1<br />
Adoptive parent(s) 5.0<br />
Ward of the State 6.7<br />
Biological father only 4.0<br />
Aunt <strong>and</strong>/or uncle 4.5<br />
Sibling(s) 0.8<br />
Friend (adult friend) 1.9<br />
Other 2.8<br />
Family Poverty a (n = 10, 871)<br />
Below poverty level 55.5<br />
At the poverty level 12.7<br />
Above the poverty level 31.8<br />
a Poverty categories take into account both family income <strong>and</strong> household size, <strong>and</strong> are based on the 1999–2008 U.S. HHS poverty<br />
guidelines. According to the guidelines, the income thresholds for living in poverty used in the analyses varied from $16,700 in 1999<br />
to $21,200 in 2008 for a family of four.<br />
Table 5 shows the clinical diagnoses of<br />
children/youth when they entered the systems<br />
of care: mood disorders (e.g., depression),<br />
ADHD, oppositional defiant disorder, <strong>and</strong><br />
adjustment disorders are the most common<br />
clinical diagnoses. The majority of<br />
children/youth served had clinically<br />
significant behavioral <strong>and</strong> emotional<br />
symptoms at intake, <strong>and</strong> their histories<br />
indicate considerable reports of severe <strong>and</strong><br />
multiple problems such as ADHD (34<br />
percent), suicide-related problems (20<br />
percent), <strong>and</strong> substance use problems (12<br />
percent). In addition, many children/youth<br />
experienced risk factors including domestic<br />
violence, physical <strong>and</strong> sexual abuse, running<br />
away, <strong>and</strong> family histories of depression,<br />
substance use, <strong>and</strong> mental illness. Schools <strong>and</strong><br />
mental health agencies were the most common<br />
referral sources for system of care services.<br />
The Comprehensive Community <strong>Mental</strong> Health Services for Children <strong>and</strong> Their Families Program <strong>Evaluation</strong> <strong>Findings</strong><br />
2006–2008 Annual Report to Congress ● Page 11
Table 5: DSM–IV Axis I <strong>and</strong> Axis II Diagnoses at Intake, Grant Communities Initially Funded in<br />
1999–2006<br />
Clinical Diagnoses a (n = 21,820)<br />
Mood Disorders 35.0%<br />
Attention-Deficit/Hyperactivity Disorder (ADHD) 34.1%<br />
Oppositional Defiant Disorder 24.6%<br />
Adjustment Disorders 12.4%<br />
Posttraumatic Stress Disorder <strong>and</strong> ASD 8.9%<br />
Anxiety Disorder 6.9%<br />
Conduct Disorder 7.0%<br />
Disruptive Behavior Disorder 6.3%<br />
<strong>Substance</strong> Use Disorders 5.8%<br />
Learning, Motor Skills, <strong>and</strong> Communication Disorders 4.0%<br />
Impulse Control Disorders 3.4%<br />
<strong>Mental</strong> Retardation 3.1%<br />
Schizophrenia <strong>and</strong> Other Psychotic Disorders 2.8%<br />
Autism <strong>and</strong> Other Pervasive Developmental Disorders 2.9%<br />
Personality Disorders 1.2%<br />
V Code b 6.7%<br />
Other 9.3%<br />
a The diagnoses listed are not just primary diagnoses. Because children may have more than one diagnosis, the percentages may<br />
sum to more than 100%<br />
b<br />
V Code refers to Relation Problems, Problems Related to <strong>Abuse</strong> or Neglect, <strong>and</strong> additional conditions that may be a focus of<br />
clinical attention<br />
.<br />
To What Extent Do Outcomes<br />
for Children, Youth, <strong>and</strong><br />
Families Improve over Time<br />
After receiving services in systems of care,<br />
children/youth <strong>and</strong> their families showed<br />
substantial improvements in areas such as<br />
behavioral <strong>and</strong> emotional problems, level of<br />
functioning, school attendance <strong>and</strong><br />
performance, involvement with law<br />
enforcement, <strong>and</strong> strain on families <strong>and</strong><br />
other caregivers. In addition to improving in<br />
many areas, some children/youth <strong>and</strong> their<br />
families showed stability on other<br />
dimensions, also reflecting positive findings<br />
given the severity <strong>and</strong> complexity of their<br />
diagnoses <strong>and</strong> presenting problems. When<br />
multiple measures are considered, 72<br />
percent of children <strong>and</strong> youth show<br />
The Comprehensive Community <strong>Mental</strong> Health Services for Children <strong>and</strong> Their Families Program <strong>Evaluation</strong> <strong>Findings</strong><br />
2006–2008 Annual Report to Congress ● Page 12<br />
improvement on at least one clinical<br />
measure, <strong>and</strong> 77 percent show improvement<br />
on at least one functional measure after 24<br />
months. <strong>Findings</strong> related to improvement<br />
<strong>and</strong> stability are highlighted below for each<br />
outcome area, with specification as to<br />
whether the results are derived from the<br />
entire group of 81 communities initially<br />
funded in 1999 through 2006 or from a<br />
subgroup of these communities. In addition,<br />
the instrument or measure used to derive<br />
each of the findings is specified.<br />
Improvement <strong>and</strong> stability were measured<br />
using Reliable Change Indices (Jacobson,<br />
Roberts, Berns, & McGlinchey, 1999) where<br />
appropriate.
Clinical Outcomes<br />
Child/Youth’s Behavioral <strong>and</strong><br />
Emotional Problems Were Reduced<br />
Children/youth showed clinically<br />
significant reductions in their behavioral<br />
<strong>and</strong> emotional problems after receiving<br />
services within systems of care.<br />
In all communities (Child Behavior<br />
Checklist):<br />
<br />
<br />
Improvements were found in 31 percent<br />
of children/youth after 6 months of<br />
services; improvements increased to 48<br />
percent at 24 months of services.<br />
Approximately 93 percent of<br />
children/youth showed improvement or<br />
maintained stability in their symptoms<br />
24 months after entering services.<br />
Figure 3: Change in Children <strong>and</strong> Youth’s Overall Behavioral <strong>and</strong> Emotional Problems from Intake<br />
to 6 Months, Intake to 12 Months, Intake to 18 Months, <strong>and</strong> Intake to 24 Months, Grant<br />
Communities Initially Funded in 1999–2006, Outcome Sample (CBCL 4–18)<br />
90.7% 91.2% 91.9%<br />
93.3%<br />
Intake to 6 Months<br />
Intake to 12 Months<br />
Intake to 18 Months<br />
Intake to 24 Months<br />
(n = 1,306)<br />
z = 12.40, p = .00<br />
Youth’s Self-Reported Behavioral <strong>and</strong><br />
Emotional Problems Were Reduced<br />
Youth reported significantly lower levels of<br />
depression <strong>and</strong> anxiety after receiving<br />
services within systems of care.<br />
In communities initially funded in 2002–<br />
2006 (Revised Children’s Manifest Anxiety<br />
Scale; Reynolds Adolescent Depression<br />
Scale–2nd Edition):<br />
<br />
After 6 months in services, 13 percent of<br />
youth reported less depression, <strong>and</strong> after<br />
<br />
<br />
24 months in services this change nearly<br />
doubled to 25 percent (statistically<br />
significant).<br />
The percentage of youth reporting less<br />
anxiety doubled from 16 percent after 6<br />
months in services to 32 percent after 24<br />
months in services (statistically<br />
significant).<br />
Over 90 percent of children/youth<br />
reported either improved or stable<br />
symptoms of depression <strong>and</strong> anxiety<br />
after 24 months.<br />
The Comprehensive Community <strong>Mental</strong> Health Services for Children <strong>and</strong> Their Families Program <strong>Evaluation</strong> <strong>Findings</strong><br />
2006–2008 Annual Report to Congress ● Page 13
In communities initially funded in 1998–<br />
2000 (Youth Self-Report):<br />
<br />
After 6 months in services, the<br />
percentage of youth reporting being less<br />
anxious/depressed increased from 13<br />
percent to 21 percent after 24 months in<br />
services (statistically significant).<br />
Child/Youth’s Level of Functioning<br />
Improved<br />
The profound functional impairments that<br />
are associated with emotional <strong>and</strong><br />
behavioral problems among children/youth<br />
decreased after receiving services within<br />
systems of care.<br />
In communities initially funded in 2002–<br />
2006 (Columbia Impairment Scale):<br />
<br />
<br />
The percentage of youth with significant<br />
improvements in social functioning,<br />
more than doubled from 16 percent after<br />
6 months in services to 32 percent after<br />
24 months in services (statistically<br />
significant).<br />
Approximately 95 percent of<br />
children/youth showed improvement or<br />
stability in their level of functioning<br />
after 6 <strong>and</strong> 24 months in services.<br />
Child/Youth’s Strengths Increased<br />
The behavioral <strong>and</strong> emotional strengths of<br />
children/youth increased after receiving<br />
services within systems of care.<br />
In all communities (Behavioral <strong>and</strong><br />
Emotional Rating Scale–2nd Edition; Parent<br />
Rating Scale):<br />
<br />
<br />
Caregiver reports indicated that the<br />
percentage of children/youth with<br />
improved behavioral <strong>and</strong> emotional<br />
strengths increased from 33 percent after<br />
6 months to more than 42 percent after<br />
24 months (statistically significant).<br />
Caregiver reports consistently<br />
demonstrated improved or stable<br />
strengths for over 77 percent of the<br />
children/youth after 6 <strong>and</strong> 24 months of<br />
services.<br />
In communities initially funded in 2002–<br />
2006 (Behavioral <strong>and</strong> Emotional Rating<br />
Scale–2; Youth Rating Scale):<br />
<br />
Nearly 24 percent youth reported<br />
improvement in strengths after 6 months<br />
of services, increasing to 33 percent after<br />
24 months of services (statistically<br />
significant).<br />
The Comprehensive Community <strong>Mental</strong> Health Services for Children <strong>and</strong> Their Families Program <strong>Evaluation</strong> <strong>Findings</strong><br />
2006–2008 Annual Report to Congress ● Page 14
Figure 4: Change in Caregiver Report of Child <strong>and</strong> Youth Behavioral <strong>and</strong> Emotional Strengths<br />
from Intake to 6 Months, Intake to 12 Months, Intake to 18 Months, <strong>and</strong> Intake to 24 Months, Grant<br />
Communities Initially Funded in 1999–2006, Outcome Sample<br />
77.3% 77.3% 79.3%<br />
79.6%<br />
Intake to 6 Months<br />
Intake to 12 Months<br />
Intake to 18 Months<br />
Intake to 24 Months<br />
(n = 1,268)<br />
z = 6.63, p = .00<br />
Functional Outcomes<br />
Stability of Living<br />
Arrangements/Situation Improved<br />
The number of changes in living situation<br />
for children/youth decreased after<br />
receiving services within systems of care.<br />
In all communities (Living Situations<br />
Questionnaire <strong>and</strong> Restrictiveness of Living<br />
Environments; Placement Stability Scale–<br />
Revised):<br />
<br />
At intake, 35 percent of the<br />
children/youth had two or more living<br />
placements during the 6 months before<br />
entering system of care services. This<br />
percentage decreased to 20 percent after<br />
24 months of services.<br />
The Comprehensive Community <strong>Mental</strong> Health Services for Children <strong>and</strong> Their Families Program <strong>Evaluation</strong> <strong>Findings</strong><br />
2006–2008 Annual Report to Congress ● Page 15
Figure 5: Change in Children’s or Youth’s Multiple Living Arrangement, Intake to 24 Months, Grant<br />
Communities Initially Funded in 1999–2006, Outcome Sample<br />
(n = 1,417)<br />
z = 9.92, p = .000<br />
School Attendance Improved<br />
School attendance increased for<br />
children/youth after receiving services<br />
within systems of care.<br />
In all communities (Educational<br />
Questionnaire):<br />
School Performance Improved<br />
Children/youth receiving passing grades in<br />
school increased after receiving services<br />
within systems of care.<br />
In all communities (Educational<br />
Questionnaire):<br />
<br />
As they entered systems of care, about<br />
83 percent of children/youth attended<br />
school regularly (80 percent of the time<br />
or more). School attendance increased to<br />
90 percent after 6 months <strong>and</strong> 12 months<br />
of entry to system of care <strong>and</strong> remained<br />
stable at 90 percent after 24 months<br />
(statistically significant).<br />
<br />
At entry into services, about 64 percent<br />
of children received passing grades<br />
(defined as a grade average of C or<br />
better) during the 6 months prior to<br />
entry. After 6 months of services, nearly<br />
71 percent received passing grades,<br />
increasing to 76 percent at 24 months<br />
(statistically significant).<br />
The Comprehensive Community <strong>Mental</strong> Health Services for Children <strong>and</strong> Their Families Program <strong>Evaluation</strong> <strong>Findings</strong><br />
2006–2008 Annual Report to Congress ● Page 16
Figure 6: Change in Children’s or Youth’s School Attendance <strong>and</strong> School Performance, Intake to<br />
24 Months, Grant Communities Initially Funded in 1999–2006, Outcome Sample<br />
Regular Attendance<br />
(n = 1,063)<br />
z = 4.78, p = .00<br />
Passing Grades<br />
(n = 788)<br />
z = 6.97, p = .00<br />
Law Enforcement Contacts<br />
Decreased<br />
Arrests decreased significantly for<br />
children/youth after receiving services<br />
within systems of care.<br />
In all communities (Delinquency Survey):<br />
<br />
The percentage of youth reporting they<br />
had been arrested in the previous 6<br />
months decreased significantly over<br />
time. Nearly 19 percent of children<br />
reported having been arrested at intake,<br />
dropping to just over 11 percent at 12<br />
months, <strong>and</strong> about 8 percent at 24<br />
months (statistically significant).<br />
Figure 7: Change in Youth Arrests from Intake to 24 Months, Grant Communities Initially Funded<br />
in 1999–2006, Outcome Sample<br />
(n = 705)<br />
z = -6.08, p = .000<br />
The Comprehensive Community <strong>Mental</strong> Health Services for Children <strong>and</strong> Their Families Program <strong>Evaluation</strong> <strong>Findings</strong><br />
2006–2008 Annual Report to Congress ● Page 17
Caregiver Outcomes<br />
Caregiver Strain Decreased<br />
In all communities (Caregiver Strain<br />
Questionnaire):<br />
Caregivers showed significant reductions<br />
in their reported strain after receiving<br />
services within systems of care.<br />
Caregiver strain is defined as negative<br />
consequences associated with the<br />
child/youth’s disorder that had been a<br />
problem for the family, such as negative<br />
events; worry, guilt, <strong>and</strong> fatigue; <strong>and</strong><br />
embarrassment <strong>and</strong> anger toward the child.<br />
<br />
<br />
After 6 months in services,<br />
approximately 26 percent of caregivers<br />
showed significant reductions in strain,<br />
<strong>and</strong> after 24 months in services this<br />
increased to 41 percent (statistically<br />
significant).<br />
Over 90 percent of caregivers reported a<br />
reduced or stable level of strain after 6<br />
months <strong>and</strong> 24 months in services.<br />
Figure 8: Change in Caregiver Objective Strain from Intake to 6 Months, Intake to 12 Months,<br />
Intake to 18 Months, <strong>and</strong> Intake to 24 Months, Grant Communities Initially Funded in 1999–2006,<br />
Outcome Sample<br />
90.4% 91.1% 91.8%<br />
93.1%<br />
Intake to 6 Months<br />
Intake to 12 Months<br />
Intake to 18 Months<br />
Intake to 24 Months<br />
(n = 1,329)<br />
z = 12.2, p = .00<br />
Family Functioning Improved<br />
Families showed significant improvement<br />
in functioning after receiving services<br />
within systems of care.<br />
Family functioning pertains to how family<br />
members communicate, relate, maintain<br />
relationships, make decisions, <strong>and</strong> solve<br />
problems.<br />
In communities initially funded in 2002–<br />
2006 (Family Life Questionnaire):<br />
<br />
<br />
Improvement in family functioning was<br />
shown in 9 percent of families after 6<br />
months <strong>and</strong> increased to 16 percent at 24<br />
months (statistically significant).<br />
Approximately 90 percent of caregivers<br />
reported improvement or stability in<br />
family functioning after 6, 12, 18, <strong>and</strong> 24<br />
months of services.<br />
The Comprehensive Community <strong>Mental</strong> Health Services for Children <strong>and</strong> Their Families Program <strong>Evaluation</strong> <strong>Findings</strong><br />
2006–2008 Annual Report to Congress ● Page 18
Caregiver Adequacy of Available<br />
Time Improved<br />
Families showed improvement in the<br />
availability of time after receiving services<br />
within systems of care.<br />
In communities initially funded in 1999–<br />
2000 (Family Resource Scale):<br />
<br />
The proportion of caregivers reporting<br />
improvement in availability of family<br />
time resources increased significantly,<br />
nearly doubling from 13 percent to 22<br />
percent from 6 to 24 months in services.<br />
Employment of Caregivers Improved<br />
Unemployment of families <strong>and</strong> other<br />
caregivers decreased after receiving<br />
services within systems of care.<br />
In communities initially funded in 2002–<br />
2006 (Caregiver Information<br />
Questionnaire):<br />
<br />
At service intake, 17 percent of<br />
caregivers of children/youth entering<br />
system of care services reported being<br />
unemployed because of their child’s or<br />
youth’s emotional <strong>and</strong> behavioral<br />
problems. This percentage decreased to<br />
15 percent at 12 months <strong>and</strong> to 13<br />
percent at 24 months (statistically<br />
significant).<br />
Outcomes for Specific Populations of<br />
Focus<br />
Youth at Risk for School-Related<br />
Problems<br />
School performance <strong>and</strong> behavior<br />
improved significantly for youth at risk for<br />
school-related problems after receiving<br />
services within systems of care.<br />
In communities initially funded in 2002–<br />
2006 (Educational Questionnaire):<br />
<br />
<br />
<br />
<br />
More than half of the youth referred for<br />
system of care services were at risk for<br />
school-related problems, including failing<br />
half or more of their classes, attending<br />
school less than 60 percent of the time,<br />
being expelled or suspended, <strong>and</strong><br />
attending multiple schools because of<br />
their emotional <strong>and</strong> behavioral problems.<br />
At the time of entry into services, 44<br />
percent of caregivers reported that poor<br />
school performance was a major<br />
problem for their child. After 6 months,<br />
this percentage decreased significantly to<br />
27 percent.<br />
The percentage of caregivers reporting<br />
that their child’s behavior in school was<br />
problematic decreased significantly from<br />
46 percent at entry into services to 29<br />
percent at 6 months.<br />
Compared to children/youth who were<br />
not at risk for school-related problems,<br />
children at risk for school-related<br />
problems improved significantly more<br />
with regard to school performance <strong>and</strong><br />
school behavior.<br />
Youth Referred by the Juvenile<br />
Justice System<br />
Property <strong>and</strong> violent offenses were reduced<br />
significantly for youth who were referred<br />
by the juvenile justice system after<br />
receiving services within systems of care.<br />
In all communities (Enrollment<br />
Demographic Information Form;<br />
Delinquency Survey):<br />
<br />
Youth with a juvenile justice referral<br />
source showed significantly greater<br />
improvement in property offenses after 6<br />
months in services than youth referred<br />
from other agencies. Nearly 45 percent<br />
reported having engaged in property<br />
offenses at intake; this dropped by close<br />
to two-thirds (to 16 percent) at 6 months.<br />
The percentage of youth reporting<br />
The Comprehensive Community <strong>Mental</strong> Health Services for Children <strong>and</strong> Their Families Program <strong>Evaluation</strong> <strong>Findings</strong><br />
2006–2008 Annual Report to Congress ● Page 19
violent offenses also improved after 6<br />
months in services, with 53 percent<br />
reporting violent offenses at intake <strong>and</strong><br />
41 percent reporting such at 6 months<br />
(statistically significant).<br />
Figure 9: Change in Percent of Youth Reporting Property Offenses from Intake to 6 Months, Grant<br />
Communities Initially Funded in 1999–2006, Outcome Sample<br />
z = -16.80, p < .000 — time main effect.<br />
(n = 296) (n = 2,065)<br />
Youth Involved with the Child Welfare<br />
System<br />
Clinical <strong>and</strong> functional problems decreased<br />
for youth who were involved with the child<br />
welfare system after receiving services<br />
within systems of care.<br />
In communities initially funded in 2002–<br />
2006 (EDIF, CIUF, CIQ, MSSC–R, LSQ,<br />
CIS, CBCL, RADS, <strong>and</strong> RCMAS):<br />
<br />
<br />
Youth involved with child welfare<br />
differed significantly on some<br />
demographic variables compared to<br />
youth not involved with child welfare.<br />
They were younger <strong>and</strong> more likely to<br />
be female <strong>and</strong> African American, live in<br />
poorer households, <strong>and</strong> have a history of<br />
sexual <strong>and</strong> physical abuse.<br />
Clinical problems for youth involved<br />
with child welfare decreased over time.<br />
After 12 months in services, behavioral<br />
<strong>and</strong> emotional problems, child functional<br />
impairment, anxiety, <strong>and</strong> depression<br />
decreased significantly for both youth<br />
involved with child welfare <strong>and</strong> youth<br />
not involved with child welfare. There<br />
were no significant differences for the<br />
child welfare population, which<br />
improved at a lower rate than for youth<br />
not involved with child welfare.<br />
Youth Who Attempted Suicide<br />
Suicide attempts were reduced significantly<br />
for youth after receiving services within<br />
systems of care.<br />
In communities initially funded in 2002–<br />
2006 (Caregiver Information Questionnaire<br />
<strong>and</strong> Youth Information Questionnaire):<br />
<br />
Reported youth suicide attempts were<br />
reduced by more than half within 12<br />
The Comprehensive Community <strong>Mental</strong> Health Services for Children <strong>and</strong> Their Families Program <strong>Evaluation</strong> <strong>Findings</strong><br />
2006–2008 Annual Report to Congress ● Page 20
months after entering systems of care<br />
from 9 percent to 4 percent, <strong>and</strong> further<br />
declined by about three quarters after 24<br />
months to approximately 2 percent<br />
(statistically significant).<br />
Youth without a history of suicide<br />
attempt experienced fewer depressive<br />
symptoms <strong>and</strong> greater strengths than<br />
those who had recently or in the past<br />
attempted suicide.<br />
Youth with Complex Trauma<br />
―Complex trauma‖ was defined as having<br />
experienced a lifetime of history of physical<br />
abuse, experienced sexual abuse, <strong>and</strong><br />
witnessing domestic violence. ―Less<br />
trauma‖ was defined as experiencing two or<br />
fewer trauma events.<br />
Behavioral <strong>and</strong> emotional problems<br />
improved among youth with histories of<br />
trauma after receiving services within<br />
systems of care.<br />
In all communities (Enrollment<br />
Demographic Information Form, Caregiver<br />
Information Questionnaire, Child Behavior<br />
Checklist):<br />
<br />
<br />
Youth who had experienced complex<br />
trauma entered systems of care with<br />
more severe profiles. They were more<br />
likely to have a diagnosis of posttraumatic<br />
stress disorder <strong>and</strong> presenting<br />
problems of depression, anxiety, conduct<br />
disorder, delinquency, <strong>and</strong> adjustment<br />
problems, <strong>and</strong> their emotional <strong>and</strong><br />
behavioral problems were significantly<br />
more severe than youth who had<br />
experienced two or fewer traumatic<br />
events or no traumatic events at all.<br />
Between intake <strong>and</strong> followup, youth<br />
with histories of trauma improved on<br />
measures assessing emotional <strong>and</strong><br />
behavioral problems. There was no<br />
significant difference in the amount of<br />
improvement between youth with<br />
complex trauma, less trauma, or no<br />
trauma histories.<br />
Outcomes for Specific Age Groups<br />
Children Aged 0 to 5<br />
Children aged 0 to 5 showed improvements<br />
in adaptive behavior after receiving<br />
services within systems of care.<br />
In communities initially funded in 2002–<br />
2006:<br />
<br />
<br />
<br />
Improved socialization was found in 19<br />
percent of the young children, daily<br />
living skills in 19 percent,<br />
communication in 14 percent, <strong>and</strong> motor<br />
skills in 6 percent. (Vinel<strong>and</strong> Screener)<br />
Approximately 35 percent of children<br />
aged 1½ to 5 showed improvement in<br />
behavioral <strong>and</strong> emotional symptoms<br />
after 6 months in services (Vinel<strong>and</strong><br />
Screener).<br />
At least 80 percent showed improvement<br />
or stability in all four domains of<br />
adaptive behavior after 6 months of<br />
services (Vinel<strong>and</strong> Screener).<br />
About 35 percent of children aged 1½ to<br />
5 showed improvement in behavioral<br />
<strong>and</strong> emotional symptoms after 6 months<br />
in services (Child Behavior Checklist).<br />
Children Aged 6 to 10<br />
Children aged 6 to 10 showed significant<br />
improvements in overall functioning after<br />
receiving services within systems of care.<br />
In communities initially funded in 2002–<br />
2006:<br />
<br />
Approximately 95 percent of children in<br />
this age group showed an improved or<br />
stable level of functioning after 6 <strong>and</strong> 24<br />
months of services (Columbia<br />
Impairment Scale).<br />
The Comprehensive Community <strong>Mental</strong> Health Services for Children <strong>and</strong> Their Families Program <strong>Evaluation</strong> <strong>Findings</strong><br />
2006–2008 Annual Report to Congress ● Page 21
In all communities initially funded in 1999–<br />
2006:<br />
<br />
Behavioral <strong>and</strong> emotional symptoms<br />
improved (Child Behavior Checklist).<br />
<br />
School attendance <strong>and</strong> performance<br />
improved at 6 <strong>and</strong> at 24 months<br />
(Educational Questionnaire).<br />
Figure 10: Change in School Attendance <strong>and</strong> School Performance for Children Aged 6 to 10,<br />
Intake to 24 Months, Grant Communities Initially Funded in 1999–2006, Outcome Sample<br />
Regular Attendance<br />
(n = 395)<br />
z = 3.83, p = .00<br />
Passing Grades<br />
(n = 257)<br />
z = 5.34, p = .00<br />
Youth Aged 11 to 18<br />
Children aged 11 to 18 showed significant<br />
improvements in school-related outcomes,<br />
law enforcement involvement, <strong>and</strong> suicidal<br />
behavior after receiving services within<br />
systems of care.<br />
In all communities:<br />
<br />
Regular school attendance increased for<br />
youth in this age group, from 80 percent<br />
at intake to 88 percent at 6 months <strong>and</strong><br />
89 percent at 24 months (statistically<br />
significant) (Educational Questionnaire).<br />
<br />
<br />
The percentage of youth receiving<br />
passing grades (defined as a grade<br />
average of C or better) increased from<br />
60 percent at intake to 73 percent at 12<br />
months, <strong>and</strong> 71 percent received passing<br />
grades at 24 months (statistically<br />
significant) (Educational Questionnaire).<br />
Arrests among youth aged 11 <strong>and</strong> older<br />
also decreased. After 24 months in<br />
services, youth reporting arrests<br />
decreased from 19 percent to 9 percent<br />
(Delinquency Survey).<br />
The Comprehensive Community <strong>Mental</strong> Health Services for Children <strong>and</strong> Their Families Program <strong>Evaluation</strong> <strong>Findings</strong><br />
2006–2008 Annual Report to Congress ● Page 22
Figure 11: Change in Percentage of Youth (Aged 11 to 18) Who Attended School Regularly <strong>and</strong><br />
Earned Passing Grades, at Intake, 6 Months, 12 Months, 18 Months, <strong>and</strong> 24 Months, Grant<br />
Communities Initially Funded in 1999–2006, Outcome Sample<br />
Regular Attendance<br />
(n = 617)<br />
z = 3.04, p = .02<br />
Passing Grades<br />
(n = 521)<br />
z = 4.84, p = .00<br />
Figure 12: Percent of Youth (Aged 11 to 21) Arrested At Intake, 6 Months, 12 Months, 18 Months,<br />
<strong>and</strong> 24 Months, Grant Communities Initially Funded in 1999–2006, Outcome Sample<br />
(n = 682)<br />
z = -5.94, p = .000<br />
The Comprehensive Community <strong>Mental</strong> Health Services for Children <strong>and</strong> Their Families Program <strong>Evaluation</strong> <strong>Findings</strong><br />
2006–2008 Annual Report to Congress ● Page 23
What Is the Service Experience<br />
for Children, Youth, <strong>and</strong><br />
Families in Systems of Care<br />
Children/Youth Received a Variety of<br />
Services <strong>and</strong> Supports to Meet Their<br />
Needs<br />
Children/youth <strong>and</strong> their families received<br />
a variety of types of services <strong>and</strong> supports<br />
within systems of care.<br />
In all communities (Multi-Sector Service<br />
Contacts):<br />
<br />
<br />
<br />
Children/youth <strong>and</strong> families received an<br />
average of 5.7 different types of services<br />
during their first 6 months of receiving<br />
services within a system of care,<br />
typically the most intensive time of<br />
service use.<br />
Of children/youth remaining in services<br />
for the entire 24-month timeframe, an<br />
average of 5.1 services was received<br />
between 18 <strong>and</strong> 24 months after intake.<br />
The most frequently reported service<br />
provided was case management,<br />
followed by individual therapy,<br />
medication treatment/monitoring,<br />
assessment/evaluation, <strong>and</strong> family<br />
therapy.<br />
Children/Youth Experienced a<br />
Decrease of Residential Services <strong>and</strong><br />
an Increase of Community-Based<br />
Care<br />
The use of restrictive services decreased,<br />
<strong>and</strong> the use of home <strong>and</strong> community-based<br />
services, including<br />
innovative/nontraditional services <strong>and</strong><br />
supports, increased for children/youth<br />
served within systems of care.<br />
In all communities (Multi-Sector Service<br />
Contacts):<br />
<br />
The use of residential services settings,<br />
such as inpatient hospitalization,<br />
<br />
declined by more than half, from 15<br />
percent to nearly 7 percent after 24<br />
months of services. Similar reductions<br />
were not found for residential treatment<br />
centers, therapeutic group homes, <strong>and</strong><br />
therapeutic foster care.<br />
An average of 113 days of services (any<br />
type of services) was received by<br />
children/youth during the 6 months<br />
following entry. The fewest days<br />
represented residential services<br />
averaging 12 days (e.g., inpatient,<br />
residential treatment, therapeutic group<br />
homes). Traditional services accounted<br />
for an average of 37 days (e.g.,<br />
assessment; medication monitoring;<br />
crisis services; <strong>and</strong> individual, group,<br />
<strong>and</strong> family therapy). The majority of<br />
service days (64) represented<br />
nontraditional/innovative services (e.g.,<br />
family preservation, case management,<br />
day treatment, behavioral/therapeutic<br />
aide, family support, independent living<br />
services, respite, <strong>and</strong> after-school<br />
services).<br />
Caregivers <strong>and</strong> Children/Youth Were<br />
Satisfied with Their Services over<br />
Time<br />
Caregivers, children, <strong>and</strong> youth were<br />
satisfied with their service experience<br />
within systems of care.<br />
In communities initially funded in 2002–<br />
2006 (Youth Services Survey for Families;<br />
Youth Services Survey):<br />
<br />
Caregivers, children, <strong>and</strong> youth either<br />
agreed or strongly agreed with<br />
statements about their satisfaction with<br />
their service experience over time<br />
throughout the 24 month period,<br />
including access to services,<br />
participation in treatment, cultural<br />
sensitivity, outcome of services, <strong>and</strong><br />
overall satisfaction.<br />
The Comprehensive Community <strong>Mental</strong> Health Services for Children <strong>and</strong> Their Families Program <strong>Evaluation</strong> <strong>Findings</strong><br />
2006–2008 Annual Report to Congress ● Page 24
Youth were least satisfied with their<br />
participation in treatment planning.<br />
How Well Are System of Care<br />
Principles Implemented<br />
The national evaluation includes a system of<br />
care assessment that measures the<br />
implementation of system of care principles<br />
across system of care infrastructure <strong>and</strong><br />
service delivery domains. The infrastructure<br />
domain includes the organizational<br />
structures <strong>and</strong> processes that support <strong>and</strong><br />
facilitate service delivery. The service<br />
delivery domain consists of the activities<br />
<strong>and</strong> processes that are undertaken to provide<br />
mental health services <strong>and</strong> related supports<br />
to children <strong>and</strong> families. Each of these<br />
domains is assessed in relation to the system<br />
of care principles of family focused,<br />
individualized, culturally competent,<br />
interagency, collaborative/coordinated,<br />
accessible, community-based, <strong>and</strong> least<br />
restrictive care. Ratings on a scale of 1 to 5<br />
(5 being highest) track the implementation<br />
of these principles at various intervals in<br />
system development over the life of each<br />
grant-funded community. The ratings<br />
presented in this report are not aggregated<br />
across all three phases of the evaluation<br />
because data collection was not complete<br />
across all phases at the time of the 2006–<br />
2008 reports to Congress.<br />
System of Care Principles Were<br />
Increasingly Implemented<br />
An upward trend in the implementation of<br />
system of care principles over time was<br />
shown by systems of care.<br />
<br />
Figure 13 shows the average ratings for<br />
each system of care principle for the<br />
infrastructure domain for 22 communities<br />
initially funded in 1999 <strong>and</strong> 2000 across<br />
the entire 6 years of their grant funding;<br />
Figure 14 presents average ratings for the<br />
<br />
<br />
<br />
service delivery domain for the same<br />
group of communities. The findings show<br />
an upward trend across all assessment<br />
points for all system of care principles<br />
assessed, with generally better<br />
performance in the service delivery<br />
domain than in the infrastructure domain.<br />
Across all assessment points,<br />
communities performed better in<br />
implementing the principles of family<br />
focused, individualized,<br />
collaborative/coordinated, <strong>and</strong> accessible<br />
care, <strong>and</strong> were least successful at<br />
providing culturally competent care <strong>and</strong><br />
maintaining interagency involvement.<br />
Figures 15 <strong>and</strong> 16 show the average<br />
ratings for each system of care principle<br />
for the infrastructure <strong>and</strong> service delivery<br />
domains respectively for 27 communities<br />
initially funded in 2002–2004 in their<br />
second <strong>and</strong> fourth years of grant funding.<br />
The ratings are based upon the most<br />
current <strong>and</strong> available data at the time of<br />
the 2006–2008 Reports to Congress.<br />
Similar to the 1999–2000 funded cohort<br />
of communities described above, the<br />
findings show an upward trend across the<br />
two assessment points for all system of<br />
care principles assessed, with generally<br />
better performance in the service delivery<br />
domain than the infrastructure domain.<br />
This group of communities performed<br />
better in implementing the principles of<br />
family focused, individualized,<br />
collaborative/coordinated, accessible,<br />
community-based <strong>and</strong> least restrictive<br />
care than in providing culturally<br />
competent care <strong>and</strong> maintaining<br />
interagency involvement, particularly in<br />
the service delivery domain. More<br />
dramatic improvements were made at the<br />
second assessment in the infrastructure<br />
domain than in the service delivery<br />
domain.<br />
The Comprehensive Community <strong>Mental</strong> Health Services for Children <strong>and</strong> Their Families Program <strong>Evaluation</strong> <strong>Findings</strong><br />
2006–2008 Annual Report to Congress ● Page 25
Figure 13: Average Infrastructure Ratings for System of Care Communities Funded in 1999 <strong>and</strong><br />
2000 across Assessment Points<br />
(n = 22)<br />
Figure 14: Average Service Delivery Ratings for System of Care Communities Funded in 1999 <strong>and</strong><br />
2000 across Assessment Points<br />
5<br />
Assessment 1 Assessment 2 Assessment 3 Assessment 4<br />
Ratings<br />
4<br />
3<br />
4.0<br />
4.1<br />
4.1<br />
4.2<br />
3.9<br />
4.0<br />
4.0<br />
4.1<br />
3.2<br />
3.5<br />
3.4<br />
3.5<br />
3.7<br />
3.7<br />
3.6<br />
3.5<br />
3.7<br />
3.9<br />
4.1<br />
4.1<br />
4.1<br />
4.1<br />
4.1<br />
4.0<br />
3.9<br />
3.8<br />
3.7<br />
3.9<br />
3.5<br />
3.8<br />
4.2<br />
4.3<br />
2<br />
1<br />
(n = 22)<br />
Principles<br />
The Comprehensive Community <strong>Mental</strong> Health Services for Children <strong>and</strong> Their Families Program <strong>Evaluation</strong> <strong>Findings</strong><br />
2006–2008 Annual Report to Congress ● Page 26
Figure 15: Average Infrastructure Ratings for System of Care Communities Funded in 2002, 2003,<br />
<strong>and</strong> 2004 across Assessment Points<br />
(n = 27)<br />
Figure 16: Average Service Delivery Ratings for System of Care Communities Funded in 2002,<br />
2003, <strong>and</strong> 2004 across Assessment Points<br />
(n = 27)<br />
The Comprehensive Community <strong>Mental</strong> Health Services for Children <strong>and</strong> Their Families Program <strong>Evaluation</strong> <strong>Findings</strong><br />
2006–2008 Annual Report to Congress ● Page 27
Multiple Strategies Were Used to<br />
Implement System of Care Principles<br />
Systems of care used multiple strategies to<br />
implement system of care principles across<br />
all communities.<br />
Examples of these strategies include the<br />
following.<br />
<br />
<br />
<br />
Family-Focused Care. Including<br />
families in service planning meetings<br />
<strong>and</strong> in decisionmaking about care;<br />
providing services <strong>and</strong> supports to<br />
families; providing family peer-to-peer<br />
support; <strong>and</strong> involving families in<br />
governance, program evaluation <strong>and</strong><br />
data collection, <strong>and</strong> system management<br />
<strong>and</strong> operations (e.g., serving as staff,<br />
providing training to staff, participating<br />
on hiring panels).<br />
Individualized Services. Using the<br />
―wraparound‖ approach with child <strong>and</strong><br />
family teams to plan <strong>and</strong> deliver<br />
individualized services <strong>and</strong> supports to<br />
meet the unique needs of each child,<br />
youth <strong>and</strong> family; including<br />
children/youth in service planning<br />
meetings <strong>and</strong> decisionmaking about their<br />
own care; training staff on the concept of<br />
individualized care <strong>and</strong> strengths-based<br />
approaches; hiring wraparound<br />
facilitators; using flexible funds<br />
creatively to meet unique needs;<br />
providing peer-to-peer support; requiring<br />
<strong>and</strong> monitoring individualized treatment<br />
plans; <strong>and</strong> assessing the extent to which<br />
care had been individualized.<br />
Cultural Competence. Conducting<br />
outreach to minority populations <strong>and</strong><br />
cultural organizations; conducting entry,<br />
service planning meetings, <strong>and</strong><br />
providing services in the preferred<br />
language of the family (e.g., Spanish);<br />
providing culturally appropriate<br />
services; training staff <strong>and</strong> supervisors;<br />
translating <strong>and</strong> interpreting services <strong>and</strong><br />
<br />
<br />
<br />
<br />
materials; collecting data; <strong>and</strong> using<br />
parent advocates.<br />
Interagency Involvement. Accepting<br />
referrals from multiple child-serving<br />
agencies; involving direct service staff<br />
from multiple agencies in child <strong>and</strong><br />
family teams; involving core agency<br />
representatives in governance <strong>and</strong> case<br />
review activities; integrating staff across<br />
agencies (e.g., cross-training;<br />
outstationing); developing cross-agency<br />
referral <strong>and</strong> intake forms, service plans,<br />
<strong>and</strong> management information systems.<br />
Collaboration with <strong>and</strong> Coordination<br />
of Services across Agencies.<br />
Collaborating with <strong>and</strong> coordinating<br />
services across publicly funded childserving<br />
agencies <strong>and</strong> other communitybased<br />
organizations through information<br />
sharing, care coordination <strong>and</strong> case<br />
review mechanisms; <strong>and</strong> cross-agency<br />
membership on child <strong>and</strong> family teams.<br />
Accessibility of Services. Creating an<br />
easy process for entry into services;<br />
short wait periods for services; providing<br />
services at convenient times <strong>and</strong><br />
locations for families; providing<br />
transportation; <strong>and</strong> enhancing the<br />
breadth <strong>and</strong> depth of the service array to<br />
ensure adequate range <strong>and</strong> capacity of<br />
service options.<br />
Community-Based Care in the Least<br />
Restrictive Environment.<br />
Implementing services such as mobile<br />
crisis teams, crisis stabilization, family<br />
preservation, <strong>and</strong> therapeutic foster care<br />
to prevent out-of-home placement <strong>and</strong><br />
use of restrictive service settings;<br />
providing an array of home <strong>and</strong><br />
community-based services <strong>and</strong> supports;<br />
creating procedures to use progressively<br />
less restrictive care for children already<br />
placed in restrictive settings; <strong>and</strong> using a<br />
case review process that discourages<br />
placement in restrictive settings.<br />
The Comprehensive Community <strong>Mental</strong> Health Services for Children <strong>and</strong> Their Families Program <strong>Evaluation</strong> <strong>Findings</strong><br />
2006–2008 Annual Report to Congress ● Page 28
How Well Are Communities<br />
Implementing Evidence-Based<br />
Practices<br />
Reflecting <strong>and</strong> increased focus on the<br />
changes that have occurred within systems<br />
of care at the practice level, the<br />
implementation of evidence-based <strong>and</strong><br />
promising practices within systems of care<br />
was examined beginning with communities<br />
initially funded in 2005 <strong>and</strong> 2006.<br />
Widespread Use of a Diverse Array of<br />
Evidence-Based Practices Was<br />
Found in Systems of Care<br />
There is widespread use of a broad array of<br />
evidence-based <strong>and</strong> promising practices in<br />
the treatment of children/youth served<br />
within systems of care.<br />
In communities initially funded in 2002–<br />
2004 (Evidence-based Treatment Survey):<br />
<br />
<br />
<br />
<br />
Broad support for evidence-based<br />
treatments was found.<br />
A wide range of evidence-based <strong>and</strong><br />
promising practices was included in the<br />
array of clinical services provided within<br />
systems of care. The communities<br />
identified 50 evidence-based practices<br />
that are provided; 12 of these were<br />
offered by more than one community, as<br />
shown on Table 6.<br />
Systems of care were adapting evidencebased<br />
practices to respond to identified<br />
cultures within their communities,<br />
including racial/ethnic diversity,<br />
geographical location, literacy level,<br />
socioeconomic status, individualization,<br />
<strong>and</strong> time constraints.<br />
Service providers reported being less<br />
adaptable <strong>and</strong> less willing to try new<br />
ideas <strong>and</strong> practices than administrators,<br />
highlighting the need for education,<br />
training, coaching, <strong>and</strong> other approaches<br />
to improve practice.<br />
Table 6: Evidence-Based Treatments Used in Systems of Care<br />
Practice<br />
Number of Communities That Use or Plan To<br />
Use the Practice<br />
Wraparound Process 12<br />
Positive Behavioral Interventions <strong>and</strong> Support 8<br />
Multisystemic Therapy 7<br />
Cognitive Behavioral Therapy (CBT) 6<br />
Trauma-Focused CBT 6<br />
Parent–Child Interaction Therapy 5<br />
Incredible Years Program 4<br />
Family Group Decisionmaking 3<br />
Functional Family Therapy 3<br />
Parent Management Training–Oregon Model 3<br />
Dialectical Behavior Therapy 2<br />
Therapeutic Foster Care 2<br />
The Comprehensive Community <strong>Mental</strong> Health Services for Children <strong>and</strong> Their Families Program <strong>Evaluation</strong> <strong>Findings</strong><br />
2006–2008 Annual Report to Congress ● Page 29
How Culturally <strong>and</strong><br />
Linguistically Competent Are<br />
Practices in Systems of Care<br />
The national evaluation has examined<br />
cultural competence in three ways: (a)<br />
through a qualitative study assessing the<br />
implementation of culturally competent<br />
practices; (b) through a mixed-method study<br />
examining providers’ level of competence in<br />
several domains of cultural competence; <strong>and</strong><br />
(c) through the Child <strong>and</strong> Family<br />
Longitudinal Outcome Study, assessing<br />
caregivers’ perception of the cultural<br />
competence of their providers.<br />
Communities reported serving widely<br />
diverse individuals, including underserved<br />
groups of people who are not easily<br />
identified as being different from the<br />
dominant ethnic <strong>and</strong> language group.<br />
Disparities in service availability <strong>and</strong> access<br />
are apparent for very young children (aged 0<br />
to 5); transition-age youth (aged 18 to 21);<br />
low-income families; Lesbian, Gay,<br />
Bisexual, Transgender, Questioning,<br />
Intersex, <strong>and</strong> Two-Spirit (GLBTQI2–S)<br />
youth; members of local subcultures; <strong>and</strong><br />
small religious groups.<br />
Although cultural competence is an area<br />
with significant challenges for systems of<br />
care, a number of improvements have been<br />
achieved.<br />
Communities Reported Implementing<br />
Cultural <strong>and</strong> Linguistic Competent<br />
Practices<br />
Adaptations of evidence-based practices,<br />
training, <strong>and</strong> policies were being<br />
implemented in systems of care to improve<br />
cultural <strong>and</strong> linguistic competence at the<br />
system <strong>and</strong> practice levels.<br />
In four communities initially funded in 2005<br />
(Butte County, CA; Harris County, TX;<br />
Monroe County, NY; <strong>and</strong> the State of<br />
Arkansas [qualitative interviews]):<br />
<br />
<br />
<br />
Communities reported widespread<br />
adaptations of evidence-based practices<br />
<strong>and</strong> the use of practice-based evidence<br />
interventions that have been tested with<br />
culturally diverse groups.<br />
Communities implemented training in<br />
cultural <strong>and</strong> linguistic competence <strong>and</strong><br />
displayed a strong awareness of the need<br />
for culturally <strong>and</strong> linguistically<br />
competent staff.<br />
Communities actively examined the<br />
needs of their systems of care to develop<br />
policies <strong>and</strong> procedures that support the<br />
implementation of cultural <strong>and</strong> linguistic<br />
competence.<br />
Providers Rated Highly the<br />
Relevance of Culture <strong>and</strong><br />
Incorporating Families’ Beliefs into<br />
Service Provision<br />
Service providers within systems of care<br />
considered cultural norms, beliefs, <strong>and</strong><br />
characteristics to be significantly important<br />
in service delivery to diverse populations.<br />
In communities initially funded in 2002–<br />
2004 (Culturally Competent Practices<br />
Survey):<br />
<br />
<br />
Service providers within systems of care<br />
rated statements related to beliefs about<br />
cultural norms, treatment of mental<br />
illness, interaction style, <strong>and</strong> the<br />
relevance of cultural characteristics as<br />
significantly important in service<br />
delivery to diverse populations.<br />
Service providers within systems of care<br />
rated these elements of cultural<br />
competence in services delivery to<br />
diverse populations as significantly more<br />
important than did providers from<br />
partner agencies.<br />
The Comprehensive Community <strong>Mental</strong> Health Services for Children <strong>and</strong> Their Families Program <strong>Evaluation</strong> <strong>Findings</strong><br />
2006–2008 Annual Report to Congress ● Page 30
Organizational characteristics, such as<br />
whether training activities were offered<br />
or an evaluation of culturally competent<br />
practices was conducted, were<br />
considered to be most important in<br />
determining whether providers were<br />
culturally competent.<br />
Service Providers Were Rated Highly<br />
for Culturally Competent Practices<br />
Caregiver ratings of service providers<br />
within systems of care indicated frequent<br />
use of culturally competent practices in<br />
service delivery.<br />
In all communities (Culturally Competent<br />
Service Provision Survey):<br />
<br />
<br />
Caregivers rated the frequency of their<br />
providers’ culturally competent practices<br />
high from 6 months after entering<br />
services to 24 months. Average ratings<br />
exceeded 4.5 on a 5-point scale.<br />
The provider’s cultural background did<br />
not influence ratings with respect to the<br />
importance of underst<strong>and</strong>ing the<br />
family’s culture or the frequency of<br />
culturally competent practices.<br />
How Are Flexible Funds Used<br />
Within Systems of Care<br />
Flexible Funds Were Used to Fill<br />
Service Gaps<br />
Flexible funds were used by systems of care<br />
to finance services <strong>and</strong> supports that were<br />
not covered by other funding sources.<br />
Flexible Funds Provided Families<br />
with Essential Needs <strong>and</strong> Supports<br />
Basic needs <strong>and</strong> supports for<br />
children/youth <strong>and</strong> their families, as well<br />
as some clinical treatments, were fulfilled<br />
by using flexible funds within systems of<br />
care.<br />
In four communities funded in 1999<br />
(Management Information System data):<br />
<br />
Flexible funds were used to fulfill many<br />
of the families’ basic needs such as<br />
housing support, transportation, food,<br />
<strong>and</strong> childcare. Systems of care also used<br />
flexible funds to pay for some traditional<br />
mental health <strong>and</strong> substance abuse<br />
treatment services that were not covered<br />
by other sources, e.g., assessment <strong>and</strong><br />
evaluation, therapeutic camps, afterschool<br />
services, medical care, <strong>and</strong><br />
educational support such as tutoring.<br />
What Are the Cost Savings <strong>and</strong><br />
Economic Benefits of Systems<br />
of Care<br />
Cost Savings Were Achieved by<br />
Decreasing Inpatient Hospitalizations<br />
<strong>and</strong> Arrests<br />
Cost savings were achieved by decreasing<br />
the utilization of inpatient services <strong>and</strong> by<br />
offsetting costs in other systems, for<br />
example by decreasing arrests, for youth<br />
receiving services within system of care.<br />
In all communities (Delinquency Survey):<br />
In four communities funded in 1999<br />
(Management Information System Data):<br />
<br />
Flexible funds were used to pay for<br />
services <strong>and</strong> supports needed by the<br />
child/youth <strong>and</strong> family to improve<br />
functioning that were not covered by<br />
other funding sources.<br />
<br />
<br />
Cost savings were realized due to<br />
decreases in the number of arrests<br />
(savings estimated at $913 per child<br />
served) over the 24-month period.<br />
In communities initially funded in 2002–<br />
2006 (Living Situation Questionnaire):<br />
Cost savings were realized due to<br />
decreased inpatient hospitalization, with<br />
The Comprehensive Community <strong>Mental</strong> Health Services for Children <strong>and</strong> Their Families Program <strong>Evaluation</strong> <strong>Findings</strong><br />
2006–2008 Annual Report to Congress ● Page 31
savings estimated at $1,228 per child<br />
over the 24-month period.<br />
How Well Do Systems of Care<br />
Integrate Data <strong>and</strong> Technology<br />
Management Information Systems<br />
Were Implemented<br />
Data on service utilization were gathered<br />
by systems of care through the<br />
implementation <strong>and</strong> use of management<br />
information systems.<br />
In communities initially funded in 2005<br />
(Management Information Systems <strong>and</strong><br />
Technology, MIS&T Survey):<br />
<br />
<br />
<br />
The majority of systems of care<br />
implemented management information<br />
systems to capture data on the services<br />
they provide. Data were captured more<br />
often for traditional services than for<br />
nontraditional ―support services.‖<br />
The majority of systems of care (79<br />
percent) could access mental health data;<br />
45 percent could access social service<br />
data, 27 percent could access juvenile<br />
justice data, 18 percent could access<br />
education data, <strong>and</strong> 10 percent could<br />
access physical health data.<br />
Approximately three-quarters of systems<br />
of care (76 percent) indicated that they<br />
have access to the Medicaid records of<br />
the children served.<br />
Building data integration into system<br />
infrastructure was the most frequent<br />
strategy used for cross-agency data<br />
sharing; confidentiality concerns were<br />
the most significant barrier cited for<br />
integrated data systems across agencies.<br />
were used by systems of care to increased<br />
the accessibility of services to underserved<br />
geographic areas.<br />
In communities initially funded in 2005<br />
(Management Information Systems <strong>and</strong><br />
Technology, MIS&T Survey):<br />
<br />
<br />
Approximately 40 percent of surveyed<br />
communities reported using at least one<br />
telehealth technology for serving their<br />
clients.<br />
Behavioral assessments conducted via<br />
video-conferencing <strong>and</strong> long-distance<br />
case conferencing were employed by 20<br />
percent of the surveyed communities,<br />
<strong>and</strong> 8 percent of communities ensured<br />
continuity of care by using e-mail to<br />
send appointment reminders. One of the<br />
least frequently used telehealth<br />
technologies was remote therapy, with<br />
only 4 percent of communities<br />
employing it to provide services.<br />
Web Sites Were Developed<br />
Systems of care have developed Web sites<br />
to provide information about services <strong>and</strong><br />
supports, how to access care, activities, <strong>and</strong><br />
information about children’s mental<br />
health.<br />
In communities initially funded in 2005<br />
(Management Information Systems <strong>and</strong><br />
Technology, MIS&T Survey):<br />
<br />
Approximately 52 percent of the system<br />
of care communities had Web sites.<br />
Telehealth Technology Was Used to<br />
Increase Accessibility of Services to<br />
Underserved Areas<br />
Video-conferencing, long-distance case<br />
conferencing, email, <strong>and</strong> remote therapy<br />
The Comprehensive Community <strong>Mental</strong> Health Services for Children <strong>and</strong> Their Families Program <strong>Evaluation</strong> <strong>Findings</strong><br />
2006–2008 Annual Report to Congress ● Page 32
To What Extent Do Systems of<br />
Care Implement Strategies to<br />
Sustain Their Services Beyond<br />
the Federally Funded Grant<br />
Period<br />
The intent of the CMHI is that the systems<br />
of care receiving Federal funds will be<br />
maintained <strong>and</strong> will continue to provide<br />
services beyond the grant-funded period.<br />
Systems of care have used a variety of<br />
strategies to sustain their systems of care<br />
over time, including a range of general<br />
strategies <strong>and</strong> a range of financing strategies<br />
as shown in Table 7. The use of these<br />
strategies is assessed during the sixth year of<br />
the Federal funding cycle. Five years after<br />
Federal program funding ends, the<br />
communities included in this report will be<br />
assessed to determine the extent to which<br />
the key components of their systems of care<br />
have been maintained, as well as the<br />
perceived effectiveness of the strategies that<br />
they have employed for sustaining their<br />
systems of care over time.<br />
Communities Implemented Strategies<br />
for the Long-Term Maintenance of<br />
their Systems of Care<br />
Systems of care used a wide variety of<br />
approaches <strong>and</strong> financing strategies to<br />
sustain their infrastructure <strong>and</strong> services<br />
<strong>and</strong> supports beyond the grant-funded<br />
period.<br />
Sustainability Strategies<br />
General Strategies<br />
1) Established an Ongoing Locus of Accountability<br />
Created viable, ongoing focal points for system of care management at the local level (e.g.,<br />
agency, office, staff) to support <strong>and</strong> manage sustaining systems of care<br />
Created a viable, ongoing focal point for system of care management at the State level (e.g.,<br />
agency, office, staff) to support <strong>and</strong> manage sustaining <strong>and</strong> statewide development of systems of<br />
care<br />
2) Established a Strong Family Organization <strong>and</strong> Advocacy Base<br />
Established a strong family organization to advocate, support, <strong>and</strong> be involved in sustaining<br />
systems of care (e.g., through funding, involvement at the system <strong>and</strong> policy levels, contracting<br />
for training <strong>and</strong> specific services, etc.)<br />
Cultivated partnerships with key stakeholders using social marketing <strong>and</strong> other approaches to<br />
create support for sustaining systems of care (e.g., families, youth, providers, managed care<br />
organization leaders, State <strong>and</strong> community leaders, etc.)<br />
Created an effective advocacy base among key constituencies <strong>and</strong> audiences to advocate<br />
sustaining systems of care through social marketing approaches<br />
Identified key audiences <strong>and</strong> developed ―messages‖ for these audiences on the need <strong>and</strong><br />
urgency of focusing on children‘s mental health to generate underst<strong>and</strong>ing <strong>and</strong> support for<br />
sustaining systems of care<br />
The Comprehensive Community <strong>Mental</strong> Health Services for Children <strong>and</strong> Their Families Program <strong>Evaluation</strong> <strong>Findings</strong><br />
2006–2008 Annual Report to Congress ● Page 33
Sustainability Strategies (continued)<br />
General Strategies<br />
3) Used <strong>Evaluation</strong>/Accountability Data<br />
Used evaluation/accountability results strategically to ―make the case‖ for sustaining systems of<br />
care<br />
Used research, needs assessment, services assessment, etc., results strategically to ―make the<br />
case‖ for sustaining systems of care<br />
4) Cultivated Interagency <strong>and</strong> Other Partnerships<br />
Cultivated strong interagency relationships <strong>and</strong> partnerships to coordinate services <strong>and</strong> support<br />
sustaining systems of care<br />
Cultivated strong interagency partnerships for ongoing financing of services to support sustaining<br />
systems of care<br />
5) Infused System of Care Approach into Larger System<br />
Made local <strong>and</strong> State-level policy <strong>and</strong> regulatory changes that infuse <strong>and</strong> “institutionalize” the<br />
system of care philosophy <strong>and</strong> approach into the larger service system to support sustaining<br />
systems of care:<br />
Developed <strong>and</strong> implemented strategic plans that establish the system of care philosophy <strong>and</strong><br />
approach as goals for the State‘s service delivery system <strong>and</strong> that support sustaining systems of<br />
care<br />
Incorporated the system of care philosophy <strong>and</strong> approach into memor<strong>and</strong>a of underst<strong>and</strong>ing <strong>and</strong><br />
interagency agreements<br />
Passed legislation that supports the system of care philosophy <strong>and</strong> approach<br />
Promulgated rules, regulations, st<strong>and</strong>ards, or guidelines that require elements of the system of<br />
care philosophy <strong>and</strong> approach<br />
Incorporated requirements for elements of the system of care philosophy <strong>and</strong> approach in RFPs<br />
<strong>and</strong> contracts with managed care organizations <strong>and</strong> providers<br />
Incorporated the system of care philosophy <strong>and</strong> approach into monitoring protocols for assessing<br />
the performance of managed care organizations <strong>and</strong> providers <strong>and</strong> for assessing service quality<br />
Made the system of care philosophy <strong>and</strong> approach the way the larger service system operates<br />
Created new types of programs <strong>and</strong> services to establish the approaches <strong>and</strong> services<br />
comprising systems of care (e.g., individualized/wraparound approach to service planning <strong>and</strong><br />
delivery, care management, home-based services, respite, therapeutic foster care, etc.)<br />
Created new types of financing mechanisms to support the infrastructure <strong>and</strong> services<br />
comprising systems of care<br />
6) Provided Training, Technical Assistance, <strong>and</strong> Coaching<br />
Provided ongoing training <strong>and</strong> coaching on the system of care philosophy <strong>and</strong> approach to<br />
support sustaining systems of care<br />
Provided ongoing training on effective services (evidence-based <strong>and</strong> promising interventions) to<br />
support high-quality <strong>and</strong> effective service delivery within the framework of systems of care<br />
Created the capacity for ongoing training <strong>and</strong> technical assistance on systems of care <strong>and</strong><br />
effective services (e.g., institutes, centers of excellence, TA centers) to support sustaining of<br />
systems of care<br />
The Comprehensive Community <strong>Mental</strong> Health Services for Children <strong>and</strong> Their Families Program <strong>Evaluation</strong> <strong>Findings</strong><br />
2006–2008 Annual Report to Congress ● Page 34
Sustainability Strategies (continued)<br />
General Strategies<br />
7) Generated Commitment <strong>and</strong> Support for System of Care Approach<br />
Generated political <strong>and</strong> policy-level support for the system of care philosophy <strong>and</strong> approach<br />
among high-level administrators <strong>and</strong> policy makers at the local <strong>and</strong> State levels for sustaining<br />
systems of care through social marketing, use of evaluation data, advocacy, etc.<br />
Cultivated ongoing leaders <strong>and</strong> champions for system of care philosophy <strong>and</strong> approach to<br />
support sustaining systems of care through training, leadership development, etc.<br />
Financing Strategies<br />
1) Increased the Use of Medicaid to Finance Systems of Care<br />
Increased ability to obtain Medicaid reimbursement for services by adding new services,<br />
changing existing service definitions, obtaining waivers, using EPSDT, using the rehabilitation<br />
option, etc.<br />
2) Increased the Use of State <strong>Mental</strong> Health Funds to Finance Systems of Care<br />
Obtained new or increased State mental health funds to support system of care infrastructure<br />
<strong>and</strong> services (e.g., State general revenue, special appropriations, Federal block grant funds<br />
coming to States etc.)<br />
3) Increased the Use of Funds from Other Child-Serving Systems to Finance Systems of Care<br />
Obtained new or increased funds from other child-serving agencies to finance infrastructure<br />
<strong>and</strong>/or services to support sustaining systems of care<br />
Coordinated or braided funds with other child-serving agencies to finance infrastructure <strong>and</strong>/or<br />
services to support sustaining systems of care<br />
Blended funds with other child-serving agencies to finance infrastructure <strong>and</strong>/or services to<br />
support sustaining systems of care<br />
4) Redeployed Funds<br />
Redeployed, redirected, or shifted funds from higher to lower cost services to finance<br />
infrastructure <strong>and</strong>/or services to support sustaining <strong>and</strong> statewide development of systems of<br />
care<br />
5) Increased the Use of Local Funds to Finance Systems of Care<br />
Obtained new or increased local funds (e.g., taxing authorities, special funding districts, county<br />
funds) to finance infrastructure <strong>and</strong>/or services to support sustaining <strong>and</strong> statewide development<br />
of systems of care<br />
The Comprehensive Community <strong>Mental</strong> Health Services for Children <strong>and</strong> Their Families Program <strong>Evaluation</strong> <strong>Findings</strong><br />
2006–2008 Annual Report to Congress ● Page 35
Summary <strong>and</strong> Recommendations<br />
Summary<br />
An estimated 4.5 to 6.3 million children <strong>and</strong><br />
youth in the United States face mental health<br />
challenges. About two-thirds do not receive<br />
mental health services due to high costs <strong>and</strong><br />
limited availability of services in many<br />
communities. Families are challenged with<br />
obtaining services, <strong>and</strong> children <strong>and</strong> youth<br />
are left at risk for difficulties in school<br />
<strong>and</strong>/or in the community. The<br />
Comprehensive Community <strong>Mental</strong> Health<br />
Services for Children <strong>and</strong> Their Families<br />
Program (CMHI) has addressed these<br />
challenges through the development of<br />
community-based systems of care that<br />
promote positive mental health outcomes for<br />
children <strong>and</strong> youth <strong>and</strong> their families.<br />
The CMHI provides resources to<br />
communities to develop their systems of<br />
care to best address the needs of<br />
children/youth who experience serious<br />
mental health challenges <strong>and</strong> their families.<br />
Children <strong>and</strong> youth receiving services in<br />
funded systems of care range in age from<br />
birth to 21 years. The program has grown<br />
from initial program funding in 1993 of $4.9<br />
million to a total investment of $1.26 billion<br />
as of FY 2008. The funded systems of care<br />
have increased capacity <strong>and</strong> improved<br />
services in communities across all 50 States,<br />
Puerto Rico, <strong>and</strong> Guam, <strong>and</strong> among 15<br />
American Indian/Alaska Native<br />
communities. The CMHI continues to grow<br />
<strong>and</strong> change to meet the challenges of serving<br />
children/youth with emotional <strong>and</strong><br />
behavioral disorders <strong>and</strong> their families <strong>and</strong><br />
st<strong>and</strong>s at the forefront of the larger system<br />
change initiatives to transform the mental<br />
health care system in America.<br />
This report to Congress provides critical<br />
information about the characteristics of<br />
children <strong>and</strong> youth <strong>and</strong> families served by<br />
systems of care; the outcomes attained for<br />
children <strong>and</strong> youth <strong>and</strong> their families;<br />
service use <strong>and</strong> service experience; how well<br />
communities have implemented system of<br />
care principles; <strong>and</strong> the sustainability of<br />
systems of care. Data from the national<br />
evaluation of the system of care program<br />
demonstrate that the system of care<br />
communities are achieving meaningful gains<br />
for children, youth <strong>and</strong> their families.<br />
Participation in systems of care has resulted<br />
in meaningful outcomes related to resilience,<br />
recovery <strong>and</strong> quality of life for the children,<br />
youth, <strong>and</strong> families served. Children/youth<br />
experienced meaningful improvement in<br />
important clinical <strong>and</strong> functional indicators<br />
<strong>and</strong> reported continued improvements 24<br />
months following the initiation of system of<br />
care services. Caregivers experienced<br />
reduced strain associated with caring for a<br />
child with a serious emotional disturbance<br />
<strong>and</strong> reported increasing reductions in strain<br />
24 months after their children or youth began<br />
services in systems of care. Families made<br />
smaller but significant gains in functioning.<br />
Caregivers were less likely to be unemployed<br />
due to their child’s emotional or behavioral<br />
problems, <strong>and</strong>, in particular, reported<br />
reductions in missed days of work.<br />
Children, youth, <strong>and</strong> families received<br />
multiple services, averaging from more than<br />
six different services during the first 6<br />
months after entering systems of care, to 5.1<br />
different types of services among those who<br />
received services between 18 <strong>and</strong> 24 months<br />
after service intake. Most children/youth<br />
received case management, assessment,<br />
individual therapy, <strong>and</strong>/or medication<br />
monitoring. The provision of nontraditional<br />
services to stabilize families is a key goal of<br />
systems of care. These services are intended<br />
to stabilize children, youth, <strong>and</strong> families <strong>and</strong><br />
allow families to remain together as the<br />
The Comprehensive Community <strong>Mental</strong> Health Services for Children <strong>and</strong> Their Families Program <strong>Evaluation</strong> <strong>Findings</strong><br />
2006–2008 Annual Report to Congress ● Page 36
child’s mental health needs are met. Family<br />
support, informal supports, transportation <strong>and</strong><br />
recreation activities, <strong>and</strong> flexible funds were<br />
among the most used nontraditional services.<br />
Residential services are utilized at low levels<br />
<strong>and</strong> in a system of care are intended to be<br />
utilized when appropriate <strong>and</strong> when less<br />
restrictive alternatives may not be appropriate.<br />
The use of inpatient hospitalization declined<br />
dramatically from 6 months to 24 months after<br />
service intake, with less than one-third of<br />
children or youth using these services from 18<br />
to 24 months after service intake than in their<br />
first 6 months.<br />
Youth <strong>and</strong> caregivers generally reported high<br />
levels of satisfaction with the services they<br />
received. A consistent finding among<br />
systems of care is that youth are more<br />
satisfied with their own progress than are<br />
their caregivers. Youth are least satisfied with<br />
their participation in treatment planning, a<br />
finding that has been consistent over many<br />
years. As systems of care increase their<br />
implementation of efforts to address the need<br />
for youth-guided care, it is anticipated that<br />
this finding will improve.<br />
Communities report broad support for<br />
evidence-based practices (EBPs) <strong>and</strong> employ<br />
diverse approaches to the use of EBPs.<br />
Communities also report adaptations to EBPs<br />
for reasons related to culture, racial/ethnic<br />
diversity, socioeconomic status, geographical<br />
location, literacy, individualization, <strong>and</strong> time<br />
constraints.<br />
Systems of care improved in their<br />
implementation according to the principles<br />
that serve as the guide to system change.<br />
Improvement occurred at both the<br />
infrastructure <strong>and</strong> service delivery levels,<br />
with the greatest improvements occurring for<br />
individualized, least restrictive, <strong>and</strong><br />
community-based services in the<br />
communities assessed twice. Culturally <strong>and</strong><br />
linguistically competent service delivery <strong>and</strong><br />
interagency service delivery are the most<br />
challenging areas for systems of care.<br />
The average <strong>and</strong> per child costs of services<br />
<strong>and</strong> the type of services associated with the<br />
greatest cost vary considerably among<br />
systems of care based on data obtained from<br />
agency management information systems. In<br />
all communities, a relatively large proportion<br />
of cost in is incurred by a relatively small<br />
number of children. However, per child<br />
decreases in use of inpatient hospitalization<br />
yielded per child cost savings of about<br />
$1,228 over the 24-month time period.<br />
Substantial cost savings were also identified<br />
from a reduction in the number of arrests<br />
among those served in systems of care. Cost<br />
savings were $913 per child served over the<br />
24-month time period.<br />
Recommendations for the<br />
Future<br />
The CMHI’s experience with system change<br />
is an invaluable resource to the larger<br />
transformation agenda in children’s mental<br />
health. As an approach for providing home<br />
<strong>and</strong> community-based care, the CMHI<br />
provides a successful <strong>and</strong> effective approach<br />
to coordinated service delivery for<br />
children/youth with serious emotional<br />
disturbance <strong>and</strong> their families. The<br />
community-level system transformation<br />
begun under Federal funding continues to<br />
evolve in subsequent years. The<br />
collaboration among funded <strong>and</strong><br />
―graduated‖ communities, the structures<br />
established among agencies, <strong>and</strong> the<br />
experience of individuals involved in<br />
systems of care are opportunities for<br />
furthering larger mental health system<br />
reform. In collaboration with partners in<br />
funded <strong>and</strong> graduated system of care<br />
communities, many State governments are<br />
using the expertise of these systems of care<br />
to inform <strong>and</strong> facilitate the expansion of this<br />
approach to additional areas of the State,<br />
The Comprehensive Community <strong>Mental</strong> Health Services for Children <strong>and</strong> Their Families Program <strong>Evaluation</strong> <strong>Findings</strong><br />
2006–2008 Annual Report to Congress ● Page 37
with statewide development of systems of<br />
care as the ultimate goal.<br />
<strong>Findings</strong> indicate that achiving cultural <strong>and</strong><br />
linguistic competence <strong>and</strong> interagency<br />
collaboration continues to be challenging for<br />
system of care communities. In addition, in<br />
the study of evidence-based practices<br />
implementation, service providers were<br />
found to be less adaptable <strong>and</strong> less willing to<br />
try new ideas <strong>and</strong> practices than<br />
administrators. The areas in which systems<br />
of care encounter barriers to change are<br />
areas in which efforts need to continue to be<br />
developed <strong>and</strong> studied through the national<br />
evaluation. These areas include continued<br />
focus on the following:<br />
<br />
<br />
<br />
<br />
Implementing strategies to improve<br />
cultural <strong>and</strong> linguistic competence<br />
Addressing the challenges of crossagency<br />
collaboration to support an<br />
efficient multi-agency infrastructure<br />
Increasing the effectiveness of services<br />
by providing resources for adoption,<br />
training, <strong>and</strong> fidelity monitoring of<br />
evidence-informed practices, EBPs,<br />
practice-based evidence, <strong>and</strong> promising<br />
treatment practices<br />
Developing a skilled workforce through<br />
education, training, technical assistance,<br />
coaching <strong>and</strong> information dissemination<br />
A significant challenge for systems of care<br />
is their role in partnership with State<br />
agencies to leverage their work in order to<br />
support <strong>and</strong> facilitate the expansion of the<br />
system of care approach to other areas of the<br />
State. Qualitative data derived from the<br />
sustainability study <strong>and</strong> the system of care<br />
assessments have underscored the<br />
importance of system of care communities<br />
being part of a larger State strategy for<br />
sustaining systems of care <strong>and</strong> for exp<strong>and</strong>ing<br />
their application to other areas. Given these<br />
findings, the need for partnerships between<br />
system of care communities <strong>and</strong> State<br />
mental health <strong>and</strong> other child-serving<br />
agencies is critical. States can strategically<br />
employ funded <strong>and</strong> graduated communities<br />
to serve in many ways to develop these<br />
partnerships.<br />
The communities can serve as learning labs<br />
where approaches are tested <strong>and</strong> evaluated,<br />
demonstration sites for improving practice<br />
through the implementation of EBPs,<br />
models for addressing racial <strong>and</strong> ethnic<br />
disparities in services, sources of training<br />
<strong>and</strong> coaching for other communities,<br />
technical assistance providers for other<br />
communities, sources of data for assessing<br />
the outcomes of systems of care at the<br />
system <strong>and</strong> service delivery levels,<br />
conveners of family members <strong>and</strong> youth to<br />
develop <strong>and</strong> strengthen family <strong>and</strong> youth<br />
organizations, <strong>and</strong> developers of social<br />
marketing materials to build constituencies.<br />
In recognition of the importance of this<br />
partnership, requirements for local–State<br />
partnerships in the CMHI have been<br />
strengthened. Additional efforts are<br />
recommended to strengthen these<br />
partnerships <strong>and</strong> to assist system of care<br />
communities <strong>and</strong> State agencies to work<br />
together strategically to both sustain <strong>and</strong><br />
exp<strong>and</strong> systems of care.<br />
Establishing a longer term vision for<br />
evolving systems of care, built on the<br />
incremental change established during grant<br />
funding years, is an area in which systems of<br />
care may benefit from Federal leadership.<br />
Individuals from grant communities near the<br />
end of their funding or post-Federal funding<br />
find that 5 or 6 years is just a start <strong>and</strong> that<br />
long-range planning for 15 years or longer is<br />
needed to fully result in systems change.<br />
Alumni communities funded in 1993–1994,<br />
<strong>and</strong> increasingly those funded in 1997–2000,<br />
are a resource for underst<strong>and</strong>ing the<br />
evolution that occurs over the longer term.<br />
The Comprehensive Community <strong>Mental</strong> Health Services for Children <strong>and</strong> Their Families Program <strong>Evaluation</strong> <strong>Findings</strong><br />
2006–2008 Annual Report to Congress ● Page 38
References<br />
Achenbach, T. M. (1991). Manual for the Child Behavior Checklist <strong>and</strong> 1991 profile.<br />
Burlington, VT: University of Vermont Department of Psychiatry.<br />
Achenbach, T. M., & Edelbrock, C. (1987). Manual for the Youth Self-Report <strong>and</strong> profile.<br />
Burlington, VT: University of Vermont Department of Psychiatry.<br />
Achenbach, T. M., & Rescorla, L. A. (2000). Manual for ASEBA Preschool Forms & Profiles.<br />
Burlington, VT: University of Vermont, Research Center for Children, Youth, & Families.<br />
Achenbach, T. M., & Rescorla, L. A. (2001). Manual for ASEBA School-Age Forms & Profiles.<br />
Burlington, VT: University of Vermont, Research Center for Children, Youth, & Families.<br />
American Psychiatric Association. (1994). Diagnostic <strong>and</strong> statistical manual of mental disorders<br />
(4th ed.). Washington, DC: Author.<br />
Bird, H. R., Shaffer, D., Fisher, P., Gould, M. S., Staghezza, B., Chen, J. Y., et al. (1993). The<br />
Columbia Impairment Scale (CIS): Pilot findings on a measure of global impairment for<br />
children <strong>and</strong> adolescents. International Journal of Methods in Psychiatric Research, 3, 167–<br />
176.<br />
Brannan, A. M., Heflinger, C. A., & Bickman, L. (1998). The Caregiver Strain Questionnaire:<br />
Measuring the impact on the family of living with a child with serious emotional disturbance.<br />
Journal of Emotional <strong>and</strong> Behavioral Disorders, 5, 212–222.<br />
Brunk, M., Koch, J. R., & McCall, B. (2000). Report on parent satisfaction with services at<br />
community services boards. Richmond, VA: Virginia Department of <strong>Mental</strong> Health, <strong>Mental</strong><br />
Retardation, <strong>and</strong> <strong>Substance</strong> <strong>Abuse</strong> Services.<br />
Brunk, M., Santiago, R., Ewell, Kl, & Watts, A. (1997). Family satisfaction with level of cultural<br />
competence in systems of care: Development of a cultural competence sacle. In C. J.<br />
Liberton, K. Kutash, & R. Friedman (Eds.), The 10th Annual Research Conference<br />
Proceedings, A System of Care for Children’s <strong>Mental</strong> Health: Exp<strong>and</strong>ing the Research Base<br />
(pp. 113–118). Tampa, FL: University of South Florida, Florida <strong>Mental</strong> Health Institute,<br />
Research <strong>and</strong> Training Center for Children’s <strong>Mental</strong> Health.<br />
Center for <strong>Mental</strong> Health Services. (1997). Annual report to Congress on the evaluation of the<br />
Comprehensive Community <strong>Mental</strong> Health Services for Children <strong>and</strong> Their Families<br />
Program, 1997. Atlanta, GA: Atlanta, GA: Macro International Inc.<br />
Center for <strong>Mental</strong> Health Services. (1998). Annual report to Congress on the evaluation of the<br />
Comprehensive Community <strong>Mental</strong> Health Services for Children <strong>and</strong> Their Families<br />
Program, 1998. Atlanta, GA: Atlanta, GA: Macro International Inc.<br />
Center for <strong>Mental</strong> Health Services. (1999). Annual report to Congress on the evaluation of the<br />
Comprehensive Community <strong>Mental</strong> Health Services for Children <strong>and</strong> Their Families<br />
Program, 1999. Atlanta, GA: ORC Macro.<br />
Center for <strong>Mental</strong> Health Services. (2000). Annual report to Congress on the evaluation of the<br />
Comprehensive Community <strong>Mental</strong> Health Services for Children <strong>and</strong> Their Families<br />
Program, 2000. Atlanta, GA: ORC Macro.<br />
The Comprehensive Community <strong>Mental</strong> Health Services for Children <strong>and</strong> Their Families Program <strong>Evaluation</strong> <strong>Findings</strong><br />
2006–2008 Annual Report to Congress ● Page 39
Center for <strong>Mental</strong> Health Services. (2001). Annual report to Congress on the evaluation of the<br />
Comprehensive Community <strong>Mental</strong> Health Services for Children <strong>and</strong> Their Families<br />
Program, 2001. Atlanta, GA: ORC Macro.<br />
Center for <strong>Mental</strong> Health Services. (2003). The Comprehensive Community <strong>Mental</strong> Health<br />
Services for Children <strong>and</strong> Their Families Program: <strong>Evaluation</strong> findings—Annual reports to<br />
Congress, 2002–2003. Atlanta, GA: ORC Macro.<br />
Center for <strong>Mental</strong> Health Services. (2004). The Comprehensive Community <strong>Mental</strong> Health<br />
Services for Children <strong>and</strong> Their Families Program: <strong>Evaluation</strong> findings—Annual report to<br />
Congress, 2004. Atlanta, GA: Macro International Inc.<br />
Center for <strong>Mental</strong> Health Services. (2005). The Comprehensive Community <strong>Mental</strong> Health<br />
Services for Children <strong>and</strong> Their Families Program: <strong>Evaluation</strong> findings—Annual report to<br />
Congress, 2005. Atlanta, GA: Macro International Inc.<br />
Center for <strong>Mental</strong> Health Services. (2006). The Comprehensive Community <strong>Mental</strong> Health<br />
Services for Children <strong>and</strong> Their Families Program: <strong>Evaluation</strong> findings—Annual report to<br />
Congress, 2006. Unpublished manuscript.<br />
Center for <strong>Mental</strong> Health Services. (2007). The Comprehensive Community <strong>Mental</strong> Health<br />
Services for Children <strong>and</strong> Their Families Program: <strong>Evaluation</strong> findings—Annual report to<br />
Congress, 2007. Unpublished manuscript.<br />
Center for <strong>Mental</strong> Health Services. (2008). The Comprehensive Community <strong>Mental</strong> Health<br />
Services for Children <strong>and</strong> Their Families Program: <strong>Evaluation</strong> findings—Annual report to<br />
Congress, 2008. Unpublished manuscript.<br />
Dunst, C. J., & Leet, H. E. (1985). Family Resource Scale. Asheville, NC: Winterberry Press.<br />
Epstein, M. H. (2004). Behavioral <strong>and</strong> Emotional Rating Scale: A strength-based approach to<br />
assessment. Examiner’s manual (2nd ed.). Austin, TX: Pro-Ed.<br />
Epstein, M. H., & Sharma, J. (1998). Behavioral <strong>and</strong> Emotional Rating Scale: A Strengths-based<br />
Approach to Assessment. Austin, TX: PRO-ED.<br />
Epstein, N. B., Baldwin, L. M., & Bishop, D. S. (1983). The McMaster Family Assessment<br />
Device. Journal of Marital <strong>and</strong> Family Therapy, 9(2), 171–180.<br />
Hodges, K. (1990). Child <strong>and</strong> Adolescent Functional Assessment Scale (CAFAS). Ypsilanti, MI:<br />
Department of Psychology, Eastern Michigan University.<br />
Isaacs, M. R., Huang, L. N., Hern<strong>and</strong>ez, M., <strong>and</strong> Echo-Hawk, H. (2005). The road to evidence:<br />
The intersection of evidence-based practices <strong>and</strong> cultural competence in children’s mental<br />
health. Washington, DC: The National Alliance of Multi-Ethnic Behavioral Health<br />
Associations.<br />
Jacobson, N. S., Roberts, L. J., Berns, S. B., & McGlinchey, J. B. (1999). Methods for defining<br />
<strong>and</strong> determining the clinical significance of treatment effects: Description, application <strong>and</strong><br />
alternatives. Journal of Consulting <strong>and</strong> Clinical Psychology, 67, 300–307.<br />
Koren, P. E., DeChillo, N., & Friesen, B. J. (1992). Measuring empowerment in families whose<br />
children have emotional disabilities: A brief questionnaire. Rehabilitation Psychology, 37,<br />
305–321.<br />
The Comprehensive Community <strong>Mental</strong> Health Services for Children <strong>and</strong> Their Families Program <strong>Evaluation</strong> <strong>Findings</strong><br />
2006–2008 Annual Report to Congress ● Page 40
Reynolds, C. R., & Richmond, B. O. (1978). What I think <strong>and</strong> feel: A revised measure of<br />
children’s manifest anxiety. Journal of Abnormal Psychology, 6(2), 271–280<br />
Reynolds, W. M. (1986). Reynolds Adolescent Depression Scale, 2nd Edition (RADS–2). Lutz,<br />
FL: Psychological Assessment Resources.<br />
Sparrow, S., Carter, A., & Cicchetti, D. (1993) Vinel<strong>and</strong> Screener: Overview, reliability, validity,<br />
administration <strong>and</strong> scoring. New Haven, CT: Yale University Child Study Center.<br />
Stephens, R. L., Connor, T., Nguyen, H., Holden, E. W., Greenbaum, P., & Foster, E. M. (2005).<br />
The longitudinal comparison study of the national evaluation of the Comprehensive<br />
Community <strong>Mental</strong> Health Services for Children <strong>and</strong> Their Families Program. In M. H.<br />
Epstein, K. Kutash, & A. J. Duchnowski (Eds.), Outcomes for children <strong>and</strong> youth with<br />
behavioral <strong>and</strong> emotional disorders <strong>and</strong> their families: Programs <strong>and</strong> evaluation best<br />
practices (2nd ed., pp. 525–550). Austin, TX: PRO-ED.<br />
Stroul, B. A., & Friedman, R. M. (1986). A system of care for children <strong>and</strong> youth with severe<br />
emotional disturbances (Rev. ed.). Washington, DC: Georgetown University Child<br />
Development Center, CASSP Technical Assistance Center.<br />
<strong>Substance</strong> <strong>Abuse</strong> <strong>and</strong> <strong>Mental</strong> Health Services Administration, U.S. Department of Health <strong>and</strong><br />
Human Services. (2005). Transforming mental health care in America. Federal action<br />
agenda: First steps. DHHS Pub. No. SMA-05-4069. Rockville, MD.<br />
Titus, J. C., & Dennis, M. L. (2005). Global Appraisal of Individual Needs–Quick (GAIN–Q):<br />
Administration <strong>and</strong> scoring guide for the GAIN–Q (version 2). Retrieved August 30, 2006,<br />
from http://www.chestnut.org/LI/gain/GAIN_Q/GAIN-Q_v2_Instructions_09-07-2005.pdf<br />
U.S. Department of Health <strong>and</strong> Human Services. (1999, March 18). The 1999 HHS poverty<br />
guidelines: One version of the [U.S.] Federal poverty measure. [Electronic version]. Federal<br />
Register, 64(52), 13428–13430.<br />
U.S. Department of Health <strong>and</strong> Human Services. (2000, February 15). The 2000 HHS poverty<br />
guidelines: One version of the [U.S.] Federal poverty measure. [Electronic version]. Federal<br />
Register, 65(31), 7555–7557.<br />
U.S. Department of Health <strong>and</strong> Human Services. (2001, February 16). The 2001 HHS poverty<br />
guidelines: One version of the [U.S.] Federal poverty measure. [Electronic version]. Federal<br />
Register, 66(33), 10695–10697.<br />
U.S. Department of Health <strong>and</strong> Human Services. (2002, February 14). The 2002 HHS poverty<br />
guidelines: One version of the [U.S.] Federal poverty measure. [Electronic version]. Federal<br />
Register, 67(21), 6931–6933.<br />
U.S. Department of Health <strong>and</strong> Human Services. (2003, February 7). The 2003 HHS poverty<br />
guidelines: One version of the [U.S.] Federal poverty measure. [Electronic version]. Federal<br />
Register, 68(26), 6456–6458.<br />
U.S. Department of Health <strong>and</strong> Human Services. (2004, February 13). The 2004 HHS poverty<br />
guidelines: One version of the [U.S.] Federal poverty measure. [Electronic version]. Federal<br />
Register, 69(30), 7335–7338.<br />
The Comprehensive Community <strong>Mental</strong> Health Services for Children <strong>and</strong> Their Families Program <strong>Evaluation</strong> <strong>Findings</strong><br />
2006–2008 Annual Report to Congress ● Page 41
U.S. Department of Health <strong>and</strong> Human Services. (2005, February 18). The 2005 HHS poverty<br />
guidelines: One version of the [U.S.] Federal poverty measure. [Electronic version]. Federal<br />
Register, 70(33), 8373–3875.<br />
U.S. Department of Health <strong>and</strong> Human Services. (2006, January 24). The 2006 HHS poverty<br />
guidelines: One version of the [U.S.] Federal poverty measure. [Electronic version]. Federal<br />
Register, 71(15), 3848–3849.<br />
U.S. Department of Health <strong>and</strong> Human Services. (2007, January 24). The 2007 HHS poverty<br />
guidelines: One version of the [U.S.] Federal poverty measure. [Electronic version]. Federal<br />
Register, 72(15), 3147–3148.<br />
U.S. Department of Health <strong>and</strong> Human Services. (2008, January 23). The 2008 HHS poverty<br />
guidelines: One version of the [U.S.] Federal poverty measure. [Electronic version]. Federal<br />
Register, 73(15), 3971–3972.<br />
Walker, J. S. & Bruns, E. J. (2006). Building on practice-based evidence: Using expert<br />
perspectives to define the wraparound process. Psychiatric Services, 57, 1579–1585<br />
ZERO TO THREE. (1994). Diagnostic classification of mental health <strong>and</strong> developmental<br />
disorders in infancy <strong>and</strong> early childhood. Washington, DC: Author.<br />
The Comprehensive Community <strong>Mental</strong> Health Services for Children <strong>and</strong> Their Families Program <strong>Evaluation</strong> <strong>Findings</strong><br />
2006–2008 Annual Report to Congress ● Page 42
Appendices
Appendix A<br />
Glossary of Terms<br />
Accessible Services: Services that are affordable, located nearby, <strong>and</strong> open during evenings <strong>and</strong><br />
weekends. Staff is sensitive to <strong>and</strong> incorporates individual <strong>and</strong> cultural values. Staff is also<br />
sensitive to barriers that may keep a person from getting help. An accessible service can h<strong>and</strong>le<br />
consumer dem<strong>and</strong> without placing people on a long waiting list.<br />
Collaborative: Draws on the resources of a community, or works in coordination with other<br />
programs to provide a range of services, in-house or through interagency agreements.<br />
Community Based: The provision of services within close geographical proximity to the<br />
targeted community.<br />
Cultural Competence: Requires systems <strong>and</strong> organizations to<br />
<br />
<br />
<br />
have a defined set of values <strong>and</strong> principles, <strong>and</strong> demonstrate behaviors, attitudes, policies <strong>and</strong><br />
structures that enable them to work effectively cross-culturally;<br />
have the capacity to (1) value diversity, (2) conduct self-assessment, (3) manage the<br />
dynamics of difference, (4) acquire <strong>and</strong> institutionalize cultural knowledge, <strong>and</strong> (5) adapt to<br />
diversity <strong>and</strong> the cultural contexts of the communities they serve;<br />
incorporate the above in all aspects of policy making, administration, practice, service<br />
delivery <strong>and</strong> involve systematically consumers, key constituencies <strong>and</strong> communities.<br />
Evidence-Based Practice: A decision-making process that integrates the best available research,<br />
clinician expertise, <strong>and</strong> client characteristics.<br />
Evidence-Based Treatments: Interventions that have been proven effective through rigorous<br />
research methodologies.<br />
Family-Driven Care: Families have a primary decision-making role in the care of their own<br />
children, as well as the policies <strong>and</strong> procedures governing care for all children in their<br />
community, State, Tribe, territory, <strong>and</strong> nation.<br />
Individualized Services: Services designed to meet the unique needs of each child <strong>and</strong> family.<br />
Services are individualized when the caregivers pay attention to the needs <strong>and</strong> strengths, ages,<br />
<strong>and</strong> stages of development of the child <strong>and</strong> individual family members.<br />
Interagency: The involvement <strong>and</strong> partnership of core agencies in multiple child-serving sectors<br />
including child welfare, health, juvenile justice, education, <strong>and</strong> mental health.<br />
Least Restrictive: The priority that services should be delivered in settings that maximize<br />
freedom of choice.<br />
Linguistic Competence: The capacity of an organization <strong>and</strong> its personnel to communicate<br />
effectively, <strong>and</strong> convey information in a manner that is easily understood by diverse audiences<br />
including persons of limited English proficiency, those who have low literacy skills or are not<br />
literate, <strong>and</strong> individuals with disabilities. Linguistic competency requires organizational <strong>and</strong><br />
provider capacity to respond effectively to the health literacy needs of populations served. The<br />
organization must have policy, structures, practices, procedures, <strong>and</strong> dedicated resources to<br />
support this capacity.<br />
The Comprehensive Community <strong>Mental</strong> Health Services for Children <strong>and</strong> Their Families Program <strong>Evaluation</strong> <strong>Findings</strong><br />
2006–2008 Annual Report to Congress ● Appendix A ● Page 1
Practice-Based Evidence: Practice-based evidence is evidence derived from community<br />
consensus to support the effectiveness of treatments which are unique to a culture <strong>and</strong> supportive<br />
of cultural traditions (Isaacs, Huang, Hern<strong>and</strong>ez, & Echo-Hawk, 2005).<br />
Poverty Level: Based on Department of Health <strong>and</strong> Human Services poverty guidelines, which<br />
are available for the 50 States; the National Poverty Levels (based on a family of four) are as<br />
follows (U.S. Department of Health <strong>and</strong> Human Services, 1999, 2000, 2001, 2002, 2003, 2004,<br />
2005, 2006, 2007, 2008):<br />
Year<br />
Poverty Guideline for a<br />
Family of Four<br />
2008 $21,200<br />
2007 $20,650<br />
2006 $20,000<br />
2005 $19,350<br />
2004 $18,850<br />
2003 $18,400<br />
2002 $18,100<br />
2001 $17,650<br />
2000 $17,050<br />
1999 $16,700<br />
Reliable Change Index: Because numeric change may vary in magnitude <strong>and</strong> implications for<br />
actual behavioral change are often difficult to interpret, we provide a quantitative indicator of<br />
clinical change for clinical outcome measures. The reliable change index (RCI; Jacobson et al.,<br />
1999) is used to assess whether individual behavioral <strong>and</strong> emotional change over time was<br />
clinically significant. This statistic compares a child’s scores at two different points in time,<br />
adjusting for the reliability of the measure, <strong>and</strong> indicates whether a change in scores shows<br />
clinically significant improvement, stability, or deterioration. Improvement <strong>and</strong> deterioration are<br />
defined as a difference in outcome scores, adjusted for measurement error of the outcome, which<br />
exceeds the 95 percent confidence bounds around a change score of zero. In other words, a<br />
difference of that magnitude would not be expected simply due to the unreliability of the measure.<br />
Serious Emotional Disturbance: Defined by the CMHI grant program as<br />
<br />
<br />
having an emotional, socio-emotional, behavioral or mental disorder diagnosable under the<br />
DSM-IV or its ICD-9-CM equivalents, the Diagnostic Classification of <strong>Mental</strong> Health <strong>and</strong><br />
Developmental Disorders of Infancy <strong>and</strong> Early Childhood-Revised (DC: 0-3R), or the<br />
Diagnostic Interview Schedule for Children (DISC) for children at least 4 years old.<br />
unable to function in the family, school or community, or in a combination of these settings,<br />
or the level of functioning is such that the child or youth requires multiagency intervention<br />
involving two or more community service agencies providing services in the areas of mental<br />
health, education, child welfare, juvenile justice, substance abuse, or primary health care. The<br />
identified disability must have been present for at least 1 year or, on the basis of diagnosis,<br />
severity, or multiagency intervention, <strong>and</strong> is expected to last longer than 1 year.<br />
The Comprehensive Community <strong>Mental</strong> Health Services for Children <strong>and</strong> Their Families Program <strong>Evaluation</strong> <strong>Findings</strong><br />
2006–2008 Annual Report to Congress ● Appendix A ● Page 2
System of Care: An organizational philosophy <strong>and</strong> framework that involves collaboration across<br />
agencies, families, <strong>and</strong> youth for the purpose of improving access <strong>and</strong> exp<strong>and</strong>ing the array of<br />
coordinated community-based, culturally <strong>and</strong> linguistically competent services <strong>and</strong> supports for<br />
children <strong>and</strong> youth who are diagnosed with a serious emotional disturbance <strong>and</strong> their families<br />
(Stroul & Friedman, 1986).<br />
System of Care Principles: Accessible, collaborative, community based, culturally <strong>and</strong><br />
linguistically competent, family driven, individualized, interagency, least restrictive, youth<br />
guided.<br />
Transition-Age Youth: Youth transitioning from adolescence to adulthood, ages 14 years<br />
<strong>and</strong> older.<br />
Wraparound: ―Ateam-based, collaborative process for developing <strong>and</strong> implementing<br />
individualized care plans for children with severe disorders <strong>and</strong> their families…The values<br />
associated with wraparound specified that care was to be strengths based, culturally competent,<br />
<strong>and</strong> organized around family members’ own perceptions of their needs <strong>and</strong> goals‖ (Walker &<br />
Bruns, 2006).<br />
Youth-Guided Care: Youth are engaged as equal partners in creating systems change in<br />
policies <strong>and</strong> procedures at the individual, community, State, <strong>and</strong> national levels.<br />
The Comprehensive Community <strong>Mental</strong> Health Services for Children <strong>and</strong> Their Families Program <strong>Evaluation</strong> <strong>Findings</strong><br />
2006–2008 Annual Report to Congress ● Appendix A ● Page 3
Appendix B<br />
System of Care Communities of the Comprehensive Community<br />
<strong>Mental</strong> Health Services for Children <strong>and</strong> Their Families Program,<br />
1993–2009<br />
Project Name Catchment Area State<br />
Children‘s Systems of Care/California 5<br />
Phase I (grants awarded in 1993 <strong>and</strong> 1994)<br />
Riverside, San Mateo, Santa Cruz,<br />
Solano, <strong>and</strong> Ventura counties<br />
Multiagency Integrated System of Care (MISC) Santa Barbara County<br />
Sonoma-Napa Comprehensive System of Care Sonoma <strong>and</strong> Napa counties<br />
California<br />
California<br />
California<br />
Hawai‗i ‗Ohana Project Wai‗anae Coast <strong>and</strong> Leeward O‗ahu Hawai‗i<br />
Community Wraparound Initiative<br />
Lyons, Riverside, <strong>and</strong> Proviso<br />
townships<br />
Illinois<br />
COMCARE Sedgwick County Kansas<br />
KanFocus 13 southeastern counties Kansas<br />
Wings for Children <strong>and</strong> Families<br />
Piscataquis, Hancock, Penobscot, <strong>and</strong><br />
Washington counties<br />
Maine<br />
East Baltimore <strong>Mental</strong> Health Partnership East Baltimore, Maryl<strong>and</strong> Maryl<strong>and</strong><br />
K‘é Project Navajo Nation Arizona, New<br />
Mexico, Utah<br />
Olympia (formerly Doña Ana County Child <strong>and</strong><br />
Adolescent Collaborative)<br />
Families Reaching in Ever New Directions<br />
(FRIENDS)<br />
Pitt-Edgecombe-Nash Public Academic Liaison<br />
Project (PEN-PAL)<br />
Doña Ana County<br />
Mott Haven<br />
Pitt, Edgecombe, <strong>and</strong> Nash counties<br />
New Mexico<br />
New York<br />
North Carolina<br />
Partnerships Project Minot, Bismarck, <strong>and</strong> Fargo regions North Dakota<br />
Stark County Family Council <strong>and</strong> Southern<br />
Consortium<br />
Stark County <strong>and</strong> 10 southeastern<br />
counties<br />
New Opportunities Lane County Oregon<br />
South Philadelphia Family Partnership Project South Philadelphia Pennsylvania<br />
Project REACH Rhode Isl<strong>and</strong> Statewide Rhode Isl<strong>and</strong><br />
The Village Project Charleston <strong>and</strong> Dorchester counties South Carolina<br />
City of Alex<strong>and</strong>ria System of Care City of Alex<strong>and</strong>ria Virginia<br />
ACCESS Statewide Vermont<br />
Wraparound Milwaukee Milwaukee County Wisconsin<br />
Ohio<br />
The Comprehensive Community <strong>Mental</strong> Health Services for Children <strong>and</strong> Their Families Program <strong>Evaluation</strong> <strong>Findings</strong><br />
2006–2008 Annual Report to Congress ● Appendix B ● Page 1
Project Name Catchment Area State<br />
Phase II (grants awarded in 1997 <strong>and</strong> 1998)<br />
The Jefferson County Community Partnership Jefferson County Alabama<br />
Children‘s <strong>Mental</strong> Health Services Initiative San Diego County California<br />
Tampa-Hillsborough Integrated Network for<br />
Kids (THINK) System<br />
Hillsborough County<br />
Florida<br />
Kentucky Bridges Project 3 Appalachian regions Kentucky<br />
Kmihqitahasultipon (―We Remember‖) Project<br />
Mno Bmaadzid Endaad (―Be in good health at<br />
his house‖)<br />
Passamaquoddy Tribe Indian<br />
Township<br />
Sault Ste. Marie Tribe of Chippewa<br />
Indians <strong>and</strong> Bay Mills Ojibwa Indian<br />
Community; Chippewa, Mackinac, <strong>and</strong><br />
Schoolcraft counties<br />
Maine<br />
Michigan<br />
Southwest Community Partnership Detroit Michigan<br />
Partnership With Families St. Charles County Missouri<br />
Families First <strong>and</strong> Foremost Lancaster County Nebraska<br />
Nebraska Family Central 22 central counties Nebraska<br />
Neighborhood Care Centers Clark County Nevada<br />
North Carolina Families <strong>and</strong> Communities<br />
Equal Success (FACES)<br />
Sacred Child Project<br />
Blue Ridge, Clevel<strong>and</strong>, Guilford, <strong>and</strong><br />
S<strong>and</strong>hills<br />
Fort Berthold, St<strong>and</strong>ing Rock, Spirit<br />
Lake, <strong>and</strong> Turtle Mountain Indian<br />
reservations<br />
North Carolina<br />
North Dakota<br />
Clackamas Partnership Clackamas County Oregon<br />
Community Connections for Families Allegheny County Pennsylvania<br />
Project Hope Statewide Rhode Isl<strong>and</strong><br />
The Children‘s Partnership Travis County Texas<br />
Utah Frontiers Project<br />
Beaver, Carbon, Emery, Garfield,<br />
Gr<strong>and</strong>, <strong>and</strong> Kane counties<br />
Children‘s UPstream Services Statewide Vermont<br />
Children <strong>and</strong> Families in Common King County Washington<br />
Clark County Children‘s <strong>Mental</strong> Health Initiative Clark County<br />
Northwoods Alliance for Children <strong>and</strong> Families Forest, Langlade, Lincoln, Marathon,<br />
Oneida, <strong>and</strong> Vilas counties<br />
Utah<br />
Washington<br />
Wisconsin<br />
With Eagle‘s Wings Wind River Indian Reservation Wyoming<br />
The Comprehensive Community <strong>Mental</strong> Health Services for Children <strong>and</strong> Their Families Program <strong>Evaluation</strong> <strong>Findings</strong><br />
2006–2008 Annual Report to Congress ● Appendix B ● Page 2
Project Name Catchment Area State<br />
Yuut Calilriit Ikaiyuquulluteng (―People Working<br />
Together‖) Project<br />
Project MATCH (Multi-Agency Team for<br />
CHildren)<br />
Phase III (grants awarded in 1999 <strong>and</strong> 2000)<br />
Delta region of southwest Alaska<br />
Pima County<br />
Alaska<br />
Arizona<br />
AK-O-NES Humboldt <strong>and</strong> Del Norte counties California<br />
Spirit of Caring Project Contra Costa County California<br />
Colorado Cornerstone System of Care Initiative Denver, Jefferson, Clear Creek, <strong>and</strong><br />
Gilpin counties<br />
Families <strong>and</strong> Communities Together (FACT)<br />
Project<br />
Family HOPE (Helping Organize Partnerships<br />
for Empowerment)<br />
Statewide<br />
West Palm Beach<br />
Colorado<br />
Delaware<br />
Florida<br />
KidsNet Rockdale <strong>and</strong> Gwinnett counties Georgia<br />
Circle Around Families East Chicago, Gary, <strong>and</strong> Hammond Indiana<br />
Dawn Project Marion County Indiana<br />
Community Kids Montgomery County Maryl<strong>and</strong><br />
Worcester Communities of Care Worcester Massachusetts<br />
PACT (Putting All Communities Together) 4<br />
Families Collaborative<br />
COMPASS (Children of Mississippi <strong>and</strong> Their<br />
Parents Accessing Strength-Based Services)<br />
K<strong>and</strong>iyohi, Meeker, Renville, <strong>and</strong><br />
Yellow Medicine counties<br />
Hinds County<br />
Minnesota<br />
Mississippi<br />
CARE NH: Community Alliance Reform Effort Manchester, Littleton, <strong>and</strong> Berlin New Hampshire<br />
Burlington Partnership Burlington County New Jersey<br />
Westchester Community Network Westchester County New York<br />
North Carolina System of Care Network 11 counties North Carolina<br />
Gateways to Success Greenwood County South Carolina<br />
Nagi Kicopi–Calling the Spirit Back Project<br />
Oglala Sioux Tribe, Pine Ridge Indian<br />
Reservation, Pine Ridge<br />
South Dakota<br />
Nashville Connection Nashville Tennessee<br />
Mountain State Family Alliance 12 counties West Virginia<br />
The Comprehensive Community <strong>Mental</strong> Health Services for Children <strong>and</strong> Their Families Program <strong>Evaluation</strong> <strong>Findings</strong><br />
2006–2008 Annual Report to Congress ● Appendix B ● Page 3
Phase IV (cooperative agreements awarded in 2002, 2003, <strong>and</strong> 2004)<br />
Ch‘eghutsen‘ A System of Care Fairbanks Native Association Alaska<br />
Glenn County Children‘s System of Care Glenn County California<br />
La Familia Sana Monterey County California<br />
OASIS (Obtaining <strong>and</strong> Sustaining Independent<br />
Success)<br />
Sacramento County<br />
California<br />
San Francisco Children‘s System of Care San Francisco California<br />
Urban Trails Oakl<strong>and</strong> California<br />
Project BLOOM<br />
El Paso, Fremont, <strong>and</strong> Mesa counties,<br />
<strong>and</strong> the City of Aurora<br />
Colorado<br />
Partnership for Kids (PARK) Project Statewide Connecticut<br />
D.C. Children Inspired Now Gain Strength<br />
(D.C. CINGS)<br />
Districtwide<br />
Washington,<br />
District of<br />
Columbia<br />
One Community Partnership Broward County Florida<br />
I‘Famagu‘onta (Our Children) Territorywide Guam<br />
Building on Each Other‘s Strengths Statewide Idaho<br />
System of Care Chicago Chicago Illinois<br />
Kentuckians Encouraging Youth to Succeed<br />
(KEYS)<br />
Louisiana Youth Enhanced Services for<br />
Children‘s <strong>Mental</strong> Health (LA–YES)<br />
Show Me Kids<br />
Boone, Campbell, Carroll, Gallatin<br />
Grant, Kenton, Owen, <strong>and</strong> Pendleton<br />
counties<br />
Jefferson, Orleans, Plaquemines, St.<br />
Bernard, <strong>and</strong> St. Tammany parishes<br />
Barry, Christian, Green, Lawrence,<br />
Stone, <strong>and</strong> Taney counties<br />
Kentucky<br />
Louisiana<br />
Missouri<br />
Transitions St. Louis County <strong>and</strong> City Missouri<br />
Kids Integrated Delivery System for Montana<br />
(KIDS fm)<br />
Statewide <strong>and</strong> Crow Indian Nation<br />
Montana<br />
Families Together in Albany County Albany County New York<br />
Family Voices Network Erie County New York<br />
Coordinated Children‘s Services Initiative<br />
(CCSI)/The Family Network<br />
New York City<br />
Tapestry Cuyahoga County Ohio<br />
New York<br />
Choctaw Nation CARES Choctaw Nation of Oklahoma Oklahoma<br />
Great Plains Systems of Care<br />
Columbia River Wraparound<br />
Beckham, Canadian, Kay, Oklahoma,<br />
<strong>and</strong> Tulsa counties<br />
Gilliam, Hood River, Sherman, <strong>and</strong><br />
Wasco counties<br />
Puerto Rico <strong>Mental</strong> Health Initiative for Children Llorens Torres Housing Project in San<br />
Juan <strong>and</strong> Municipality of Gurabo<br />
YouthNet<br />
Project Name Catchment Area State<br />
Chester, Lancaster, <strong>and</strong> York counties<br />
<strong>and</strong> Catawba Nation<br />
Oklahoma<br />
Oregon<br />
Puerto Rico<br />
South Carolina<br />
The Comprehensive Community <strong>Mental</strong> Health Services for Children <strong>and</strong> Their Families Program <strong>Evaluation</strong> <strong>Findings</strong><br />
2006–2008 Annual Report to Congress ● Appendix B ● Page 4
Project Name Catchment Area State<br />
Phase IV (cooperative agreements awarded in 2002, 2003, <strong>and</strong> 2004) (continued)<br />
Border Children‘s <strong>Mental</strong> Health Collaborative El Paso County Texas<br />
Community Solutions Fort Worth Texas<br />
Phase V (cooperative agreements awarded in 2005 <strong>and</strong> 2006)<br />
Sewa Uusim/Flower Children, Our Hope, Our<br />
Light, Our Future<br />
ACTION for Kids (Arkansas Collaborating to<br />
Improve Our Network)<br />
Pascua Yaqui Tribe of Arizona<br />
Craighead, Lee, Mississippi, <strong>and</strong><br />
Phillips counties<br />
Arizona<br />
Arkansas<br />
Connecting Circles of Care Butte County California<br />
Seven Generations Los Angeles County California<br />
About Building Connections for Young Children<br />
<strong>and</strong> Families (Project ABC)<br />
Transforming Children‘s <strong>Mental</strong> Health Through<br />
Community <strong>and</strong> Parent Partnerships<br />
Los Angeles County<br />
Placer County<br />
California<br />
California<br />
Building Blocks for Bright Beginnings New London County Connecticut<br />
Sarasota Partnership for Children‘s <strong>Mental</strong><br />
Health<br />
Sarasota County<br />
Florida<br />
Project Ho‗omohala Honolulu Hawai‗i<br />
McHenry County Family CARE<br />
(Child/Adolescent Recovery Experience)<br />
McHenry County<br />
Illinois<br />
Community Circle of Care 10 northeastern counties Iowa<br />
Thrive: A Trauma-Informed System of Care for<br />
Children with Serious Emotional Disturbance in<br />
Maine<br />
Central Massachusetts Communities of Care<br />
Androscoggin, Franklin, <strong>and</strong> Oxford<br />
counties<br />
Worcester County (excluding the City<br />
of Worcester)<br />
Maine<br />
Massachusetts<br />
Impact Ingham County Michigan<br />
Kalamazoo Wraps Kalamazoo County Michigan<br />
Our Children Succeed Initiative<br />
System Transformation of Area Resources <strong>and</strong><br />
Services (STARS)<br />
Kittson, Mahnomen, Marshall,<br />
Norman, Polk, <strong>and</strong> Red Lake counties<br />
Benton, Sherburne, Stearns, <strong>and</strong><br />
Wright counties<br />
Minnesota<br />
Minnesota<br />
CommUNITY Cares Forrest, Lamar, <strong>and</strong> Marion counties Mississippi<br />
Circle of H.O.P.E. (Home, Opportunities,<br />
Parents <strong>and</strong> Professionals, Empowerment)<br />
Andrew <strong>and</strong> Buchanan counties<br />
Missouri<br />
Blackfeet Po=Ka System of Care Blackfeet Reservation Montana<br />
The Comprehensive Community <strong>Mental</strong> Health Services for Children <strong>and</strong> Their Families Program <strong>Evaluation</strong> <strong>Findings</strong><br />
2006–2008 Annual Report to Congress ● Appendix B ● Page 5
Project Name Catchment Area State<br />
Phase V (cooperative agreements awarded in 2005 <strong>and</strong> 2006) (continued)<br />
Monroe County Achieving Culturally Competent<br />
<strong>and</strong> Effective Services <strong>and</strong> Supports<br />
(ACCESS)<br />
Monroe County<br />
New York<br />
Mecklenburg CARES Mecklenburg County North Carolina<br />
Wraparound Oregon: Early Childhood Multnomah County Oregon<br />
Starting Early Together (SET) Allegheny County Pennsylvania<br />
Beaver County Systems of Care: Optimizing<br />
Resources, Education, <strong>and</strong> Supports<br />
(BCBSCORES)<br />
Beaver County<br />
Pennsylvania<br />
Rhode Isl<strong>and</strong> Positive Educational Partnership<br />
(PEP)<br />
Statewide<br />
Rhode Isl<strong>and</strong><br />
Tiwahe Wakan (Families as Sacred) Yankton Sioux Reservation South Dakota<br />
Mule Town Family Network Maury County Tennessee<br />
Systems of Hope Harris County Texas<br />
Wyoming Support, Access, Growth, <strong>and</strong><br />
Empowerment (SAGE) Initiative<br />
Statewide<br />
Wyoming<br />
Phase VI (cooperative agreements awarded in 2008)<br />
Delaware‘s B.E.S.T. (Bringing Evidence-based<br />
System-of-Care & Treatment) for Young<br />
Children <strong>and</strong> Their Families<br />
Statewide<br />
Delaware<br />
KidsNet Northwest<br />
One Community, One Family<br />
Kentucky SEED (System to Enhance Early<br />
Development)<br />
MD CARES (Maryl<strong>and</strong> Crisis <strong>and</strong> At Risk for<br />
Escalation Diversion Services)<br />
Bartow, Dade, Floyd, Haralson,<br />
Paulding, Polk, <strong>and</strong> Walker Counties<br />
Dearborn, Decatur, Franklin, Jennings,<br />
Ohio, Ripley, Rush, <strong>and</strong> Switzerl<strong>and</strong><br />
counties<br />
Statewide<br />
Baltimore City<br />
Georgia<br />
Indiana<br />
Kentucky<br />
Maryl<strong>and</strong><br />
Tapestry of Chautauqua Initiative Chautauqua County New York<br />
Nassau County Family Support System of Care Nassau County<br />
New York<br />
Orange County System of Care Orange County New York<br />
Alamance Alliance for Children <strong>and</strong> Families Alamance County North Carolina<br />
Protecting the Future Muskogee (Creek) Nation Oklahoma<br />
Oklahoma System of Care Statewide Initiative<br />
(OSOCSI)<br />
Statewide<br />
Oklahoma<br />
The Comprehensive Community <strong>Mental</strong> Health Services for Children <strong>and</strong> Their Families Program <strong>Evaluation</strong> <strong>Findings</strong><br />
2006–2008 Annual Report to Congress ● Appendix B ● Page 6
Nak-Nu-Wit<br />
Project Name Catchment Area State<br />
Phase VI (cooperative agreements awarded in 2008) (continued)<br />
JustCare Family Network, A System of Care for<br />
Shelby County<br />
H<strong>and</strong> in H<strong>and</strong>: Planting Seeds for Healthy<br />
Families<br />
Clackamas, Multnomah, <strong>and</strong><br />
Washington Counties, Oregon, <strong>and</strong><br />
Clark County, Washington<br />
Shelby County<br />
Hood, Johnson, Palo Pinto, Parker,<br />
<strong>and</strong> Tarrant Counties<br />
Oregon,<br />
Washington<br />
Tennessee<br />
Texas<br />
Rural Children‘s Initiative 11 Panh<strong>and</strong>le counties Texas<br />
<strong>Mental</strong> Health Services for Transition-Aged<br />
Youth<br />
Statewide<br />
Vermont<br />
Lummi System of Care Initiative Lummi Nation Washington<br />
Yakima Valley Youth <strong>and</strong> Family Coalition Yakima County Washington<br />
East Central Children‘s Health Collaborative<br />
(ECCHCO) Project<br />
Phase VII (cooperative agreements awarded in 2009)<br />
Bulloch, Macon, <strong>and</strong> Pike Counties<br />
Alabama<br />
Early Connections Alameda County California<br />
Urban Trails San Francisco San Francisco California<br />
Families <strong>and</strong> Communities Empower for<br />
Success<br />
Miami-Dade County<br />
Florida<br />
Wraparound Orange Orange County Florida<br />
Project Kariñu Territorywide Guam<br />
Project Kealahou—A New Pathway for Girls<br />
Central Oahu, Windward Oahu, <strong>and</strong><br />
East Honolulu<br />
Hawai‗i<br />
Madison CARES Madison County Idaho<br />
ACCESS Initiative Champaign County Illinois<br />
Project Connect Gallatin, Saline, <strong>and</strong> White Counties Illinois<br />
RURAL Crisis <strong>and</strong> At Risk for Escalation<br />
Diversion Services (CARES)<br />
Massachusetts Young Children‘s Health<br />
Interventions for Learning <strong>and</strong> Development<br />
(MYCHILD)<br />
11 Southeast Shore counties Maryl<strong>and</strong><br />
Boston<br />
Massachusetts<br />
Community Family Partnership (CFP) Kent County Michigan<br />
Mississippi Transitional Outreach Program<br />
Statewide except for Hinds, Forrest,<br />
Lamar, <strong>and</strong> Marion Counties<br />
Mississippi<br />
The Comprehensive Community <strong>Mental</strong> Health Services for Children <strong>and</strong> Their Families Program <strong>Evaluation</strong> <strong>Findings</strong><br />
2006–2008 Annual Report to Congress ● Appendix B ● Page 7
Project Name Catchment Area State<br />
Phase VII (cooperative agreements awarded in 2009) (continued)<br />
Families <strong>and</strong> Organizations Collaborating for a<br />
United System (FOCUS)<br />
Highl<strong>and</strong> Cluster School District in<br />
Albuquerque; Grant, Hidalgo, <strong>and</strong><br />
Luna Counties; <strong>and</strong> Santa Clara<br />
Pueblo<br />
New Mexico<br />
ON CARE Onondaga County New York<br />
FAST TRAC Clermont County Ohio<br />
Journey to Successful Living (Journey) Hamilton County Ohio<br />
Pennsylvania System of Care Partnership 15 counties Pennsylvania<br />
K-Town Youth Empowerment Network (K-<br />
Town)<br />
Knox County<br />
Tennessee<br />
The Comprehensive Community <strong>Mental</strong> Health Services for Children <strong>and</strong> Their Families Program <strong>Evaluation</strong> <strong>Findings</strong><br />
2006–2008 Annual Report to Congress ● Appendix B ● Page 8
Funded Communities<br />
Date Number<br />
1993–1994 22<br />
1997–1998 23<br />
1999–2000 22<br />
2002–2004 29<br />
2005–2006 30<br />
2008 18<br />
2009 20<br />
The Comprehensive Community <strong>Mental</strong> Health Services for Children <strong>and</strong> Their Families Program <strong>Evaluation</strong> <strong>Findings</strong><br />
2006–2008 Annual Report to Congress ● Appendix B ● Page 9
Appendix C<br />
Description of CQI Indicators <strong>and</strong> Data Sources<br />
Definition of Indicators<br />
System-Level Outcomes<br />
Service Accessibility<br />
1. Number of Children Served (with descriptive data). The total number of children who<br />
have received system of care services since the start of the grant-funded program <strong>and</strong><br />
have been enrolled in the Descriptive Study (i.e., have a completed EDIF).<br />
2. Linguistic Competency Rate. The percentage of caregivers who indicated the provider<br />
spoke the same language or that interpreters were available to assist them always (5) or<br />
most of the time (4) during the first 6 months of services, excluding cases where English is<br />
the primary language spoken in the home.<br />
3. Agency Involvement Rate–Service Provision. The percentage of caregivers who<br />
identified more than one agency involved in providing services to their child <strong>and</strong> their<br />
family during the first 6 months of services.<br />
4. Caregiver Satisfaction Rate–Access to Services. The mean score across all cases on a<br />
scale of 1 (strongly disagree) to 5 (strongly agree) measuring agreement with access to<br />
service statements at 6 months after service intake.<br />
5. Timeliness of Services (average days). The average number of days between the<br />
assessment date <strong>and</strong> the first date of service across all cases with an EDIF.<br />
Service Quality<br />
6. Agency Involvement Rate–Treatment Planning. The percentage of cases with staff<br />
other than mental health involved in the development of the child‘s service plan.<br />
7. Informal Supports Rate. The percentage of caregivers who reported receiving informal<br />
supports during the first 6 months of services.<br />
8. Caregiver Satisfaction Rate–Quality of Services. The mean score across all cases on a<br />
scale of 1 (strongly disagree) to 5 (strongly agree) measuring caregiver agreement with<br />
quality of service statements at 6 months after service intake.<br />
9. Youth Satisfaction Rate–Quality of Services. The mean score across all cases on a<br />
scale of 1 (strongly disagree) to 5 (strongly agree) measuring youth agreement with quality<br />
of service statements at 6 months after service intake.<br />
10. Caregiver Satisfaction Rate–Outcomes. The mean score across all cases on a scale of<br />
1 (strongly disagree) to 5 (strongly agree) measuring agreement at 6 months after service<br />
intake with statements concerning the outcomes resulting from the services their child or<br />
family received.<br />
11. Youth Satisfaction Rate–Outcomes. The mean score across all cases on a scale of 1<br />
(strongly disagree) to 5 (strongly agree) measuring youth agreement at 6 months after<br />
service intake with statements concerning the outcomes resulting from the services they<br />
received.<br />
Service Appropriateness<br />
12. Increase in Individualized Education Plan (IEP) Development (intake to 6 months).<br />
The percent increase in the number of cases that had an IEP at intake to the total number<br />
of cases that had an IEP at 6 months after intake, for those cases with complete data at<br />
intake <strong>and</strong> at 6 months.<br />
13. <strong>Substance</strong> Use Treatment Rate. The percentage of caregivers who reported that their<br />
child had a problem with substance abuse <strong>and</strong> reported that the child received at least one<br />
service during the first 6 months of services that was related to the child‘s substance abuse<br />
problem.<br />
Instrument<br />
System-Level<br />
Outcomes<br />
EDIF<br />
CIQ–I, CCSP<br />
MSSC<br />
YSS–F<br />
EDIF<br />
EDIF<br />
MSSC<br />
YSS–F<br />
YSS<br />
YSS–F<br />
YSS<br />
EQ–R<br />
MSSC<br />
The Comprehensive Community <strong>Mental</strong> Health Services for Children <strong>and</strong> Their Families Program <strong>Evaluation</strong> <strong>Findings</strong><br />
2006–2008 Annual Report to Congress ● Appendix C ● Page 1
Definition of Indicators<br />
Child <strong>and</strong> Family Outcomes<br />
Caregiver Report<br />
Child Level<br />
14a. School Enrollment Rate. The percentage of caregivers who reported that their child<br />
attended school at any time during the first 6 months after service intake, excluding<br />
caregivers who reported that the youth graduated from high school or obtained a GED.<br />
14b.School Enrollment Rate (PRESCHOOL). The percentage of caregivers who reported that<br />
their preschool child attended preschool at any time during the first 6 months after service<br />
intake.<br />
15a. School Attendance Rate. The percentage of caregivers who report that their child<br />
attended school at least 80% of the time in the first 6 months after service intake.<br />
15b.Daycare or Afterschool Attendance Rate. The percentage of caregivers who report that<br />
their child‘s daycare or afterschool program attendance was not affected by the child‘s<br />
behavioral or emotional problems during the first 6 months after service intake, among<br />
children who attended daycare or afterschool programs<br />
16. School Performance Improvement Rate (intake to 6 months). The percentage of cases<br />
where the youth‘s grades improved during the first 6 months of services.<br />
17. Stability in Living Situation Rate. The percentage of cases where the youth lived in one<br />
living situation during the first 6 months of services.<br />
18. Inpatient Hospitalization Days per Youth. The average number of days per youth spent<br />
in inpatient hospitalization during the first 6 months of services.<br />
19. Suicide Attempt Reduction Rate–Caregiver Report (intake to 6 months). The percent<br />
change from intake to 6 months in the percent of caregivers who reported a suicide attempt<br />
for their child in the previous 6 months, for cases with complete data at intake <strong>and</strong> 6<br />
months. A negative raw score indicates a positive outcome (i.e., fewer suicide attempts).<br />
20a. Emotional <strong>and</strong> Behavioral Problem Improvement Rate–Ages 6–18 Years (intake to 6<br />
months). The percentage of cases demonstrating improvement from intake to 6 months in<br />
emotional <strong>and</strong> behavioral total problem scores on the Child Behavior Checklist, according<br />
to the reliable change index (RCI).<br />
20b.Emotional <strong>and</strong> Behavioral Problem Improvement Rate–Ages 1½–5 Years (intake to 6<br />
months). The percentage of cases of children aged 1½– years demonstrating<br />
improvement from intake to 6 months in emotional <strong>and</strong> behavioral total problem scores on<br />
the Child Behavior Checklist, according to the reliable change index (RCI).<br />
Family Level<br />
21. Average Reduction in Employment Days Lost (intake to 6 months). The difference<br />
from intake to 6 months in the average number of days missed work due to child‘s problem<br />
for cases with complete data at intake <strong>and</strong> 6 months. A negative raw score indicates a<br />
positive outcome (i.e., fewer average days lost).<br />
22. Family Functioning Improvement Rate (intake to 6 months). The percent change from<br />
intake to 6 months in mean score on the family functioning scale for cases with complete<br />
data at intake <strong>and</strong> 6 months.<br />
23. Caregiver Strain Improvement Rate (intake to 6 months). The percentage of cases<br />
demonstrating improvement from intake to 6 months in caregiver strain on the Caregiver<br />
Strain Questionnaire, according to the reliable change index (RCI).<br />
Youth Report<br />
24. Youth No Arrest Rate (intake to 6 months). The percent change from intake to 6 months<br />
in the percent youth who reported no arrests in the previous 6 months for cases with<br />
complete data at intake <strong>and</strong> 6 months.<br />
Instrument<br />
EQ–R<br />
EQ–R<br />
EQ–R<br />
EQ–R<br />
LSQ<br />
LSQ<br />
CIQ–I, CIQ–F<br />
CBCL 6–18<br />
CBCL 1½–5<br />
CIQ–I, CIQ–F<br />
FLQ<br />
CGSQ<br />
DS–R<br />
The Comprehensive Community <strong>Mental</strong> Health Services for Children <strong>and</strong> Their Families Program <strong>Evaluation</strong> <strong>Findings</strong><br />
2006–2008 Annual Report to Congress ● Appendix C ● Page 2
Definition of Indicators<br />
Youth Report (continued)<br />
25. Suicide Attempt Reduction Rate–Youth Report (intake to 6 months). The percent<br />
change from intake to 6 months in the percent of youth who reported a suicide attempt in<br />
the previous 6 months for cases with complete data at intake <strong>and</strong> 6 months. A negative<br />
raw score indicates a positive outcome (i.e., fewer suicide attempts).<br />
26. Anxiety Improvement Rate (intake to 6 months). The percentage of cases<br />
demonstrating improvement from intake to 6 months in total scores on the Revised<br />
Children‘s Manifest Anxiety Scales (RCMAS) according to the reliable change index (RCI).<br />
27. Depression Improvement Rate (intake to 6 months). The percentage of cases<br />
demonstrating improvement from intake to 6 months in total scores on the Reynold‘s<br />
Adolescent Depression Scale (RADS) according to the reliable change index (RCI).<br />
Satisfaction with Services<br />
28. Caregiver Overall Satisfaction. The score for caregiver overall satisfaction is the mean<br />
score across all satisfaction items on the Youth Services Survey–Family (YSS–F), on a<br />
scale of 1 (strongly disagree) to 5 (strongly agree). This indicator represents a compilation<br />
of all questions on the YSS–F.<br />
29. Youth Overall Satisfaction. The score for youth overall satisfaction is the mean score<br />
across all satisfaction items on the Youth Services Survey (YSS) on a scale of 1 (strongly<br />
disagree) to 5 (strongly agree). This indicator represents a compilation of all questions on<br />
the YSS.<br />
Family <strong>and</strong> Youth Involvement<br />
30. Caregiver Satisfaction Rate–Participation. The mean score across all cases on a scale<br />
of 1 (strongly disagree) to 5 (strongly agree) measuring agreement at 6 months after<br />
service intake with statements related to caregiver participation in treatment, services, <strong>and</strong><br />
setting treatment goals.<br />
31. Youth Satisfaction Rate–Participation. The mean score across all cases on a scale of 1<br />
(strongly disagree) to 5 (strongly agree) measuring agreement at 6 months after service<br />
intake with statements related to youth participation in treatment, services <strong>and</strong> setting<br />
treatment goals.<br />
32. Family Involvement Rate–Treatment Planning. The percentage of cases with caregiver<br />
or other family members involved in the development of the child‘s service plan.<br />
33. Youth Involvement Rate–Treatment Planning. The percentage of cases with a child age<br />
11 or older, where the child was involved in the development of the child‘s service plan.<br />
Cultural <strong>and</strong> Linguistic Competency<br />
34. Caregiver Satisfaction Rate–Cultural Competency. The mean score across all cases on<br />
a scale of 1 (strongly disagree) to 5 (strongly agree) measuring caregiver agreement at 6<br />
months after service intake with statements related to the cultural competency of staff.<br />
35. Youth Satisfaction Rate–Cultural Competency. The mean score across all cases on a<br />
scale of 1 (strongly disagree) to 5 (strongly agree) measuring youth agreement at 6 months<br />
after service intake with statements related to the cultural competency of staff.<br />
Instrument<br />
YIQ–I, YIQ–F<br />
RCMAS<br />
RADS–2<br />
YSS–F<br />
YSS<br />
YSS–F<br />
YSS<br />
EDIF<br />
EDIF<br />
YSS–F<br />
YSS<br />
The Comprehensive Community <strong>Mental</strong> Health Services for Children <strong>and</strong> Their Families Program <strong>Evaluation</strong> <strong>Findings</strong><br />
2006–2008 Annual Report to Congress ● Appendix C ● Page 3
2006–2008 Annual Report to Congress ● Appendix C ● Page 4<br />
The Comprehensive Community <strong>Mental</strong> Health Services for Children <strong>and</strong> Their Families Program <strong>Evaluation</strong> <strong>Findings</strong><br />
COMPREHENSIVE COMMUNITY MENTAL HEALTH SERVICES FOR CHILDREN AND THEIR FAMILIES PROGRAM<br />
CONTINUOUS QUALITY IMPROVEMENT (CQI) PROGRESS REPORT<br />
National Aggregate, July 2008<br />
Date Services Started: Oct-03<br />
Number Enrolled in the Descriptive Study: 15951<br />
Number Enrolled in the Outcome Study: 4325<br />
ACTUALS CHANGE INDEX<br />
Performance<br />
Mark 1<br />
Raw<br />
Score<br />
Previous Raw<br />
Score<br />
Change from<br />
Previous<br />
Report<br />
Benchmark 2<br />
Max Points Actual Points<br />
TOTAL SITE SCORE 100.00 82.72<br />
System-Level Outcomes<br />
Service Accessibility<br />
1. Number of Children Served (with descriptive data) 15,356 14,349 ↑ n/a . .<br />
2. Linguistic Competency Rate 90.5% 90.3% ↑ 91.7% n/a 0.00<br />
3. Agency Involvement Rate–Service Provision 75.3% 75.6% ↓ 92.9% 3.50 2.84<br />
4. Caregiver Satisfaction Rate–Access to Services 4.25 4.25 ↔ 4.42 3.67 3.53<br />
5. Timeliness of Services (average days)* 23.08 23.02 ↓ 10.18 1.36 0.60<br />
Service Quality<br />
6. Agency Involvement Rate–Treatment Planning 31.8% 32.5% ↓ 64.1% 3.00 1.49<br />
7. Informal Supports Rate 36.6% 36.2% ↑ 51.4% 1.55 1.10<br />
8. Caregiver Satisfaction Rate–Quality of Services 4.02 4.02 ↑ 4.13 3.94 3.83<br />
9. Youth Satisfaction Rate–Quality of Services 3.92 3.94 ↓ 4.02 3.83 3.73<br />
10. Caregiver Satisfaction Rate–Outcomes 3.52 3.50 ↑ 3.61 3.86 3.76<br />
11. Youth Satisfaction Rate–Outcomes 3.86 3.87 ↓ 3.92 4.04 3.98<br />
Service Appropriateness<br />
12. Individualized Education Plan (IEP) Development (% at 6 mos) 3,4 53.3% 53.5% n/a 55.9% n/a n/a<br />
13. <strong>Substance</strong> Use Treatment Rate 63.6% 63.3% ↑ 67.8% 3.25 3.05<br />
System-Level Outcomes Subtotal 32.00 27.91<br />
Child <strong>and</strong> Family Outcomes<br />
Caregiver Report<br />
Child Level<br />
14a. School Enrollment Rate 3 95.8% 95.7% ↑ 97.8% n/a n/a<br />
14b. School Enrollment Rate (Preschool) 94.4% 94.0% ↑ n/a n/a n/a<br />
15a. School Attendance Rate (80% of the time) 79.1% 79.1% ↔ 84.4% 3.68 3.45<br />
15b. Daycare or Afterschool Attendance Rate 73.9% 73.1% ↑ n/a n/a n/a<br />
16. School Performance Improvement Rate (intake to 6 mos) 36.3% 36.0% ↑ 39.8% 2.20 2.01<br />
17. Stability in Living Situation Rate (intake to 6 mos) 77.8% 78.1% ↓ 86.2% 2.85 2.57<br />
18. Inpatient Hospitalization Days per Youth (intake to 6 mos)* 5.21 5.31 ↑ 0.78 2.75 0.41<br />
19. Suicide Attempt Reduction Rate–Caregiver Report** -42.9% -41.8% ↑ -43.8% 3.90 3.82<br />
20a. Emotional <strong>and</strong> Behavioral Problem Improvement Rate–Ages 6–18<br />
Years (intake to 6 mos)<br />
28.7% 28.7% ↔ 35.0% 3.27 2.68<br />
20b. Emotional <strong>and</strong> Behavioral Problem Improvement Rate–Ages 1½–5<br />
Years (intake to 6 mos)<br />
40.3% 39.3% ↑ n/a n/a n/a
2006–2008 Annual Report to Congress ● Appendix C ● Page 5<br />
The Comprehensive Community <strong>Mental</strong> Health Services for Children <strong>and</strong> Their Families Program <strong>Evaluation</strong> <strong>Findings</strong><br />
COMPREHENSIVE COMMUNITY MENTAL HEALTH SERVICES FOR CHILDREN AND THEIR FAMILIES PROGRAM<br />
CONTINUOUS QUALITY IMPROVEMENT (CQI) PROGRESS REPORT<br />
National Aggregate, July 2008<br />
Date Services Started: Oct-03<br />
Number Enrolled in the Descriptive Study: 15951<br />
Number Enrolled in the Outcome Study: 3623<br />
ACTUALS CHANGE INDEX<br />
Performance<br />
Mark 1<br />
Raw<br />
Score<br />
Previous Raw<br />
Score<br />
Change from<br />
Previous<br />
Report<br />
Benchmark 2<br />
Max Points Actual Points<br />
Family Level<br />
21. Average Reduction in Employment Days Lost (intake to 6 mos)* -2.34 -2.25 ↑ -3.98 3.58 2.11<br />
22. Family Functioning Improvement Rate (intake to 6 mos) 3.4% 3.3% ↑ 5.8% 3.32 1.95<br />
23. Caregiver Strain Improvement Rate (intake to 6 mos) 28.5% 28.5% ↔ 33.8% 3.34 2.82<br />
Youth Report<br />
24. Youth No Arrest Rate (intake to 6 mos) 7.8% 8.0% ↓ 21.0% 3.78 1.41<br />
25. Suicide Attempt Reduction Rate–Youth Report (intake to 6 mos)** -50.9% -53.6% ↓ -100.0% 3.74 1.90<br />
26. Anxiety Improvement Rate (intake to 6 mos) 16.8% 17.1% ↓ 12.6% 2.95 2.95<br />
27. Depression Improvement Rate (intake to 6 mos) 14.5% 14.7% ↓ 22.9% 2.64 1.68<br />
Child <strong>and</strong> Family Outcomes Subtotal 42.00 29.76<br />
Satisfaction of Services<br />
28. Caregiver Overall Satisfaction 4.05 4.05 ↔ 4.09 3.00 2.97<br />
29. Youth Overall Satisfaction 3.93 3.94 ↓ 3.98 3.00 2.96<br />
Satisfaction with Services Subtotal 6.00 5.93<br />
Family <strong>and</strong> Youth Involvement<br />
30. Caregiver Satisfaction Rate–Participation 4.16 4.16 ↔ 4.30 3.06 2.96<br />
31. Youth Satisfaction Rate–Participation 3.63 3.64 ↓ 3.72 2.98 2.91<br />
32. Caregiver <strong>and</strong> Other Family Involvement in Service Plan 92.2% 92.0% ↑ 100.0% 3.97 3.66<br />
33. Youth Involvement in Service Plan 83.4% 83.5% ↓ 89.7% 3.99 3.71<br />
Family <strong>and</strong> Youth Involvement Subtotal 14.00 13.25<br />
Cultural <strong>and</strong> Linguistic Competency<br />
34. Caregiver Satisfaction Rate–Cultural Competency 4.47 4.47 ↔ 4.61 3.00 2.91<br />
35. Youth Satisfaction Rate–Cultural Competency 4.26 4.26 ↔ 4.31 3.00 2.97<br />
Cultural Competency Subtotal 4.47 4.47 ↔ 4.61 3.00 2.91<br />
Evidence-based Practice (to be developed) TBD TBD TBD<br />
Evidence-based Practice Subtotal<br />
1<br />
Performance marks are not reported for the aggregate report.<br />
2<br />
The benchmark represents the 75th percentile score from the April 2006 CQI Progress Report.<br />
3<br />
Indicator reported for information purposes only <strong>and</strong> was not included in the PCA. Therefore, raw score does not contribute to the domain score.<br />
4<br />
The calculation was modified on the Dec 2006 report to reflect % of cases with an IEP at 6 mos <strong>and</strong> should be interpreted locally.<br />
* For these indicators, smaller average days represent positive outcomes. The smaller the raw score the better the outcome.<br />
** For these indicators, a negative raw score represents a positive outcome. The more negative the raw score the better the outcome.
Appendix D<br />
National <strong>Evaluation</strong> Components <strong>and</strong> Measures<br />
National <strong>Evaluation</strong> Study Components<br />
System of Care Assessment<br />
Using a combination of semi-structured interviews with multiple stakeholders; review of r<strong>and</strong>omly<br />
selected case records; document review; <strong>and</strong> followup telephone interviews as needed this study<br />
assesses the extent to which systems are implemented according to system of care principles <strong>and</strong><br />
documents system development. Respondents include project directors; representatives from core<br />
child-serving agencies; representatives from family organizations; local program evaluators; care<br />
coordinators; direct service providers; youth coordinators; caregivers; <strong>and</strong> youth served by the system<br />
of care. A systemness index to score communities on system development used in Phase I of the study<br />
was completely revised in Phase II with the development of a stable measure that assesses the extent<br />
to which infrastructure <strong>and</strong> service delivery are family driven, individualized, culturally competent, <strong>and</strong><br />
coordinated, with services available in the community <strong>and</strong> in least restrictive service environments, <strong>and</strong><br />
how systems function across multiple child-serving agencies, which has been used since. Two<br />
interviews to assess youth involvement were added in Phase IV.<br />
Cross-Sectional Descriptive Study<br />
This study collects demographic, descriptive, <strong>and</strong> diagnostic information on all children served from<br />
caregiver report <strong>and</strong> chart review at service intake. A shorter Web-based form was added in Phase IV<br />
that could be completed at the clinic level from the child‘s chart in an effort to improve data quantity <strong>and</strong><br />
quality on all children served. Additional descriptive information is collected from caregivers <strong>and</strong> youth<br />
in the Longitudinal Child <strong>and</strong> Family Outcome Study.<br />
Measures<br />
Domain Instrument Phases Used<br />
Descriptive Characteristics<br />
Descriptive Information Questionnaire (DIQ)<br />
Record Abstraction<br />
Enrollment <strong>and</strong> Demographic Information Form (EDIF)<br />
Longitudinal Child <strong>and</strong> Family Outcome Study<br />
II–III<br />
I–V<br />
IV–V<br />
To examine outcomes for children, youth, <strong>and</strong> their families, caregivers <strong>and</strong> youth aged 11 <strong>and</strong> older<br />
are interviewed using clinical <strong>and</strong> functional measures. Assessment periods <strong>and</strong> instruments have<br />
changed over multiple funding phases. Baseline assessments occur within 30 days of service intake. In<br />
Phase I, follow-up occurred at 6, 12 <strong>and</strong> 18 months after intake as long as children were in services.<br />
Subsequently, follow-up has occurred every 6 months after intake for children in <strong>and</strong> out of services for<br />
up to 36 months.<br />
Measures<br />
Domain Instrument Phases Used<br />
Descriptive Characteristics<br />
Descriptive Information Questionnaire<br />
Enrollment <strong>and</strong> Demographic Form<br />
Caregiver Information Questionnaire (CIQ)<br />
Youth Information Questionnaire (YIQ)<br />
II–III<br />
IV–V<br />
IV–V<br />
IV–V<br />
The Comprehensive Community <strong>Mental</strong> Health Services for Children <strong>and</strong> Their Families Program <strong>Evaluation</strong> <strong>Findings</strong><br />
2006–2008 Annual Report to Congress ● Appendix D ● Page 1
Child Functioning<br />
National <strong>Evaluation</strong> Study Components<br />
Child-Related Measures<br />
Domain Instrument Phases Used<br />
Child Behavioral <strong>and</strong><br />
Emotional Problems<br />
Childhood Anxiety<br />
Adolescent Depression<br />
Child Behavioral <strong>and</strong><br />
Emotional Strengths<br />
Child Development<br />
Child <strong>and</strong> Adolescent Functional Assessment Scale<br />
(CAFAS; Hodges, 1990)<br />
Columbia Impairment Scale (CIS; Bird et al., 1993)<br />
Child Behavior Checklist (CBCL; Achenbach, 1991,<br />
Achenbach & Rescorla, 2000, 2001)<br />
Youth Self-Report (YSR; Achenbach & Edelbrook,<br />
1987)<br />
Revised Children‘s Manifest Anxiety Scale (RCMAS;<br />
Reynolds & Richmond, 1978)<br />
Reynolds Adolescent Depression Scale–2 (RADS–2;<br />
Reynolds, 1986)<br />
Behavioral <strong>and</strong> Emotional Rating Scale (BERS; Epstein<br />
& Sharma, 1998)<br />
Behavioral <strong>and</strong> Emotional Rating Scale–2 (BERS–2;<br />
Epstein, 2004) Caregiver <strong>and</strong> youth versions.<br />
Vinel<strong>and</strong> Screener (VS; Sparrow, Carter, & Cicchetti,<br />
1993)<br />
I–III<br />
IV–V<br />
I–V<br />
II–III<br />
IV–V<br />
IV–V<br />
II–III<br />
IV–V<br />
IV–V<br />
Child Living Arrangements Living Situations Questionnaire (LSQ) IV–V<br />
Education Education Questionnaire II–III<br />
IV–V (revised)<br />
Delinquency Delinquency Survey II–III<br />
IV–V (revised)<br />
Youth <strong>Substance</strong> Use<br />
<strong>Substance</strong> Dependency<br />
Family Empowerment<br />
Family Functioning<br />
<strong>Substance</strong> Use Survey<br />
GAIN Quick–R (Titus & Dennis, 2005)<br />
Family Measures<br />
Family Empowerment Scale (FES; Koren, DeChillo, &<br />
Friesen, 1992)<br />
Family Assessment Device (FAD; Epstein, Baldwin, &<br />
Bishop, 1983),<br />
Family Life Family Life Questionnaire (FLQ) IV–V<br />
Caregiver Strain<br />
Caregiver Strain Questionnaire (CGSQ; Brannan,<br />
Heflinger, & Bickman, 1998)<br />
Family Resources Family Resource Scale (FRS; Dunst & Leet, 1985) II–III<br />
Service Experience Study<br />
II–III, IV–V<br />
(revised)<br />
IV–V<br />
Information is collected at follow-up outcome assessments from caregivers <strong>and</strong> youth on<br />
characteristics of services received, whether services met family needs, cultural <strong>and</strong> linguistic<br />
competence of service providers, <strong>and</strong> satisfaction with services. A caregiver report measure of service<br />
use was developed in Phase II <strong>and</strong> revised in Phase IV. The FSQ was revised from Phase I to Phase<br />
II, <strong>and</strong> youth were assessed with a corresponding YSQ in Phases II <strong>and</strong> III. The YSS was adopted in<br />
Phase IV, <strong>and</strong> a caregiver‘s assessment of provider cultural competence was developed.<br />
I<br />
II–III<br />
II–V<br />
The Comprehensive Community <strong>Mental</strong> Health Services for Children <strong>and</strong> Their Families Program <strong>Evaluation</strong> <strong>Findings</strong><br />
2006–2008 Annual Report to Congress ● Appendix D ● Page 2
National <strong>Evaluation</strong> Study Components<br />
Measures<br />
Domain Instrument Phases Used<br />
Services Received Multi-Sector Service Contacts Form II–V<br />
Service Experience &<br />
Satisfaction<br />
Family Satisfaction Questionnaire (FSQ); Youth<br />
Satisfaction Questionnaire (YSQ) (Brunk, Santiago,<br />
Ewell, & Watts, 1997)<br />
Youth Services Survey (YSS), Youth Services Survey–<br />
Family (YSS–F) (Brunk, Koch, & McCall, 2000)<br />
I–III<br />
IV–V<br />
Cultural Competence Culturally Competent Service Provision (CCSP) IV–V<br />
Services <strong>and</strong> Costs Study<br />
Using existing cost data in agency management information systems [MIS] <strong>and</strong> budgets, this study<br />
describes the types of services used by children <strong>and</strong> families, their utilization patterns, <strong>and</strong> the<br />
associated costs. Changes were made to this study after 2005 to provide communities with st<strong>and</strong>ard<br />
templates for data about flexible fund expenditures, <strong>and</strong> to further st<strong>and</strong>ardize the delivery of crossagency<br />
service <strong>and</strong> cost data. Because access to service <strong>and</strong> cost data varies among communities,<br />
this study has used a tiered approach which accommodates availability of information from a single<br />
child-serving system <strong>and</strong> multiple child-serving systems is employed.<br />
Sustainability Study<br />
Added in 2000 to assess communities 5 years post-funding, this study obtains information about (a)<br />
availability of specific services in the system of care, (b) implementation of system of care principles,<br />
(c) achievement of objectives related to system of care implementation, (d) role <strong>and</strong> impact of various<br />
factors on the development or maintenance of the system of care, <strong>and</strong> (e) effectiveness of various<br />
general <strong>and</strong> financing strategies for sustaining systems of care. Phase I communities were assessed 5<br />
years post-funding <strong>and</strong> communities funded in 1997 were assessed in their final year of funding with a<br />
Web survey <strong>and</strong> telephone interviews with key individuals in the communities <strong>and</strong> at the State level.<br />
Communities funded in 1998–2000 were assessed with the Web survey in their final year of funding;<br />
communities funded from 2002 to 2006 are assessed during the fiscal years in which the Federal–local<br />
funding match requirements change (Years 3 <strong>and</strong> 4), <strong>and</strong> in their final year.<br />
Comparison Studies<br />
Comparison studies using quasi-experimental designs were conducted in three funded communities in<br />
Phase I (Stephens et al., 2005) <strong>and</strong> two in Phase II (CMHS, 2001, 2003), <strong>and</strong> matched communities.<br />
Non-funded communities were chosen by similar geographic <strong>and</strong> population characteristics, <strong>and</strong> their<br />
willingness to participate in the project. The design called for enrollment of the same number of children<br />
in the funded community <strong>and</strong> in the corresponding community, matched on age, gender, severity of<br />
behavioral <strong>and</strong> emotional problems <strong>and</strong> functional impairment. Measures used in the descriptive <strong>and</strong><br />
outcome studies were used in the comparison studies, with some additions. The Phase II comparison<br />
study included substudies of service experiences <strong>and</strong> provider characteristics.<br />
The Comprehensive Community <strong>Mental</strong> Health Services for Children <strong>and</strong> Their Families Program <strong>Evaluation</strong> <strong>Findings</strong><br />
2006–2008 Annual Report to Congress ● Appendix D ● Page 3
National <strong>Evaluation</strong> Study Components<br />
Treatment Effectiveness Studies<br />
Treatment effectiveness studies to examine evidence-based treatment implementation <strong>and</strong> outcomes<br />
in systems of care were implemented with three different treatments in six communities. Children<br />
received diagnostic assessments to screen for diagnoses treated by the evidence-based treatment;<br />
children accepted into the study were r<strong>and</strong>omly assigned to treatment <strong>and</strong> service as usual groups. A<br />
study of family education <strong>and</strong> support to build evidence for a practice utilized in systems of care is<br />
under way.<br />
The treatment effectiveness study of Parent–Child Interaction Therapy (PCIT) examined the<br />
effectiveness of an evidence-based treatment provided to a selected group of children with specific<br />
diagnoses served within systems of care funded in 1998. The goal of the study was to examine<br />
whether children who received an evidence-based treatment delivered in a system of care experienced<br />
better outcomes <strong>and</strong> maintained those outcomes longer than children in the same system who did not<br />
receive the evidence-based treatment.<br />
The study, initiated in 2001, began with a multi-stage process, including a treatment nominations<br />
process, a community selection <strong>and</strong> recruitment process, a treatment selection process, evaluation<br />
design, material development, <strong>and</strong> training. Two communities, the Bridges Project in Eastern Kentucky<br />
<strong>and</strong> the Clackamas County Partnership in Clackamas County, Oregon, participated in the study. Each<br />
community selected PCIT. The study design was tailored to meet the needs of each community, <strong>and</strong><br />
community-specific implementation <strong>and</strong> training materials were developed. Appropriate training<br />
workshops were presented to providers in the PCIT <strong>and</strong> non-PCIT conditions, <strong>and</strong> services were<br />
initiated in 2003.<br />
In the Oregon site, approximately 55 percent of the treatment group (n = 36) reported a decrease in<br />
caregiver strain from baseline to 18 months when compared to 34 percent of the control group (n = 41)<br />
( 2 = 6.1, p < 0.05), according to caregiver report using the Caregiver Strain Questionnaire. About 14<br />
percent (n = 28) of the treatment group ( 2 = 4.898, p < 0.05) improved on the child competence<br />
subscale of the Child Behavior Checklist from baseline to 18 months, while none of the children from<br />
the control group (n = 32) improved. In the Kentucky site, about half of the children from the treatment<br />
group (n = 16) gained strengths over the 18 months when compared to 38 percent of the control group<br />
children (n = 29) ( 2 = 6.675, p < 0.05), according to caregiver report using the Behavioral <strong>and</strong><br />
Emotional Rating Scale.<br />
Special Studies<br />
Treatment Effectiveness Study examines the effectiveness of a specific evidence-based treatment<br />
provided to selected groups of children/youth with specific diagnoses served within CMHS-funded<br />
systems of care.<br />
Evidence-Based Practices Study examines the effects of various factors on the implementation of<br />
evidence-based practices in systems of care.<br />
Family Education <strong>and</strong> Support Study examines the critical elements of family education <strong>and</strong> support<br />
services in systems of care, their effectiveness across communities, <strong>and</strong> their impact on child/youth<br />
<strong>and</strong> family outcomes.<br />
Primary Care Provider Study investigates the role of primary health care providers in systems of care<br />
<strong>and</strong> factors that facilitate <strong>and</strong> interfere with interaction between primary care providers <strong>and</strong> mental<br />
health providers.<br />
Culturally <strong>and</strong> Linguistically Competent Practices Studies assess system of care service providers‘<br />
level of competence across several domains of cultural competence, including the role that<br />
organizations <strong>and</strong> agencies play in hindering or facilitating culturally competent service provision.<br />
Tribal Financing Study examines the unique financing opportunities <strong>and</strong> challenges experienced by<br />
American Indian <strong>and</strong> Alaska Native systems of care.<br />
The Comprehensive Community <strong>Mental</strong> Health Services for Children <strong>and</strong> Their Families Program <strong>Evaluation</strong> <strong>Findings</strong><br />
2006–2008 Annual Report to Congress ● Appendix D ● Page 4
Appendix E<br />
Descriptive <strong>and</strong> Outcomes Data<br />
Tables<br />
Methods <strong>and</strong> Study Sample<br />
The Longitudinal Child <strong>and</strong> Family Outcome<br />
Study of grant communities assessed children<br />
<strong>and</strong> their families every 6 months, for up to<br />
36 months, regardless of whether the children<br />
continued to receive services through system<br />
of care programs. This allowed comparison<br />
of clinical <strong>and</strong> functional outcomes for all<br />
children who participated in the Outcome<br />
Study, regardless of whether they remained<br />
in or exited system of care services. Grant<br />
communities initially funded in 2002–04 are<br />
expected to enroll 354 families <strong>and</strong> retain 276<br />
families in Years 2 through 5 of funding.<br />
These figures may vary slightly for<br />
communities funded to serve smaller<br />
numbers of children (e.g., funding in some<br />
communities may be directed primarily<br />
toward infrastructure development, or the<br />
number of children meeting service criteria<br />
for serious emotional disturbance may be<br />
lower). While in most grant communities all<br />
willing families need to be recruited into the<br />
Outcome Study, in some larger communities,<br />
sampling strategies may need to be employed<br />
to select a sufficient number of families at<br />
r<strong>and</strong>om from the pool of children who enter<br />
the system of care program. Sample size in<br />
analyses conducted in this report fluctuates<br />
due to differences in enrollment <strong>and</strong> data<br />
completion rates across grant communities.<br />
Table E-1 presents study enrollment <strong>and</strong> data<br />
completion rates through October 2005 for<br />
each community initially funded in 1999–<br />
2000. Tables E-2 <strong>and</strong> E-3 present study<br />
enrollment <strong>and</strong> data completion rates through<br />
June 2008 for each community initially<br />
funded in 2002–2004 <strong>and</strong> 2005–2006,<br />
respectively.<br />
The Comprehensive Community <strong>Mental</strong> Health Services for Children <strong>and</strong> Their Families Program <strong>Evaluation</strong> <strong>Findings</strong><br />
2006–2008 Annual Report to Congress ● Appendix E ● Page 1
Table E-1: Study Enrollment <strong>and</strong> Program Interview Completion for Grant Communities Funded in 1999–2000 as of October 2005<br />
2006–2008 Annual Report to Congress ● Appendix E ● Page 2<br />
The Comprehensive Community <strong>Mental</strong> Health Services for Children <strong>and</strong> Their Families Program <strong>Evaluation</strong> <strong>Findings</strong><br />
Community<br />
Descriptive<br />
Sample a<br />
Outcome<br />
Sample b<br />
6-<br />
Month<br />
Eligible for Interview at<br />
Each Assessment Point c<br />
12-<br />
Month<br />
18-<br />
Month<br />
24-<br />
Month<br />
30-<br />
Month<br />
6-<br />
Month<br />
Completed Interview at<br />
Each Assessment Point d<br />
12-<br />
Month<br />
18-<br />
Month<br />
24-<br />
Month<br />
30-<br />
Month<br />
6-<br />
Month<br />
Interview Completion Rate at<br />
Each Assessment Point e<br />
33 361 130 130 118 88 61 46 51 32 8 7 4 39.2% 27.1% 9.1% 11.5% 8.7%<br />
34 201 200 200 192 165 145 76 198 178 154 120 69 99.0% 92.7% 93.3% 82.8% 90.8%<br />
35 705 195 193 163 125 98 60 110 70 44 19 11 57.0% 42.9% 35.2% 19.4% 18.3%<br />
36 338 39 39 35 30 27 22 20 12 10 4 51.3% 34.3% 33.3% 14.8% 0.0%<br />
37 459 293 292 284 255 219 167 167 117 82 65 40 57.2% 41.2% 32.2% 29.7% 24.0%<br />
38 120 58 58 47 34 21 19 33 29 20 15 12 56.9% 61.7% 58.8% 71.4% 63.2%<br />
39 348 149 149 138 130 116 98 134 86 65 51 35 89.9% 62.3% 50.0% 44.0% 35.7%<br />
40 243 80 67 54 48 44 22 43 29 19 15 64.2% 53.7% 39.6% 34.1% 0.0%<br />
41 353 124 124 110 90 71 47 117 100 80 62 40 94.4% 90.9% 88.9% 87.3% 85.1%<br />
42 673 387 387 370 327 265 213 283 214 161 126 71 73.1% 57.8% 49.2% 47.5% 33.3%<br />
43 230 67 67 59 46 27 16 41 29 17 9 2 61.2% 49.2% 37.0% 33.3% 12.5%<br />
44 178 158 156 140 107 95 77 151 136 105 90 76 96.8% 97.1% 98.1% 94.7% 98.7%<br />
45 355 201 200 197 190 179 164 200 196 187 177 159 100.0% 99.5% 98.4% 98.9% 97.0%<br />
46 499 252 252 252 217 180 156 229 202 139 79 62 90.9% 80.2% 64.1% 43.9% 39.7%<br />
47 358 130 130 122 112 91 79 121 107 93 80 66 93.1% 87.7% 83.0% 87.9% 83.5%<br />
48 266 225 225 213 195 185 172 116 83 40 27 27 51.6% 39.0% 20.5% 14.6% 15.7%<br />
49 966 310 288 257 214 188 159 280 249 204 181 148 97.2% 96.9% 95.3% 96.3% 93.1%<br />
50 1020 440 426 413 386 323 264 352 283 197 146 99 82.6% 68.5% 51.0% 45.2% 37.5%<br />
51 161 90 90 81 75 68 51 83 75 66 57 38 92.2% 92.6% 88.0% 83.8% 74.5%<br />
52 65 65 65 38 38 34 26 3 21 4.6% 55.3% 0.0% 0.0% 0.0%<br />
53 271 151 151 151 149 136 122 151 149 137 126 105 100.0% 98.7% 91.9% 92.6% 86.1%<br />
54 1222 342 340 339 285 224 171 265 222 169 142 114 77.9% 65.5% 59.3% 63.4% 66.7%<br />
Aggregated<br />
Number<br />
9392 4086 4029 3773 3306 2797 2227 3148 2619 1997 1598 1178 78.1% 69.4% 60.4% 57.1% 52.9%<br />
a Descriptive Sample was based on number of cases with at least one piece of descriptive information.<br />
b<br />
Baseline Outcome Sample was based on number of cases with at least one of the required outcome instruments at baseline.<br />
c<br />
Eligibility for Interview at Each Assessment Point was derived based on the following criteria: (a) data indicated that the child had been enrolled in the system for 6 months or longer (for 6-month followup), 12<br />
months or longer (for 12-month followup), 18 months or longer (for 18-month followup), 24 months or longer (for 24-month followup), or 30 months or longer (for 30-month followup); <strong>and</strong> (c) the child had at least<br />
one of the required outcome instruments administered at intake.<br />
d<br />
Completed Interview at Each Assessment Point was derived based on the following criteria: (a) 6-month outcome sample: cases with 6-month data on at least one of the required outcome instruments; (b) 12-<br />
month outcome sample: cases with 12-month data on at least one of the required outcome instruments; (c) 18-month outcome sample: cases with 18-month data on at least one of the required outcome<br />
instruments; (d) 24-month outcome sample: cases with 24-month data on at least one of the required outcome instruments; <strong>and</strong> (e) 30-month outcome sample: cases with 30-month data on at least one of the<br />
required outcome instruments.<br />
e Interview Completion Rate at Each Assessment Point was calculated as follows: (Completed interview at each assessment point / Eligibility for interview at each assessment point) x 100%.<br />
12-<br />
Month<br />
18-<br />
Month<br />
24-<br />
Month<br />
30-<br />
Month
2006–2008 Annual Report to Congress ● Appendix E ● Page 3<br />
The Comprehensive Community <strong>Mental</strong> Health Services for Children <strong>and</strong> Their Families Program <strong>Evaluation</strong> <strong>Findings</strong><br />
Community<br />
Table E-2: Study Enrollment <strong>and</strong> Program Interview Completion for Grant Communities Funded in 2002–2004 as of June 2008<br />
Descriptive<br />
Sample a<br />
Outcome<br />
Sample b<br />
6-<br />
Month<br />
Eligible for Interview at<br />
Each Assessment Pointc<br />
12-<br />
Month<br />
18-<br />
Month<br />
24-<br />
Month<br />
30-<br />
Month<br />
6-<br />
Month<br />
Completed Interview at<br />
Each Assessment Pointd<br />
12-<br />
Month<br />
18-<br />
Month<br />
24-<br />
Month<br />
30-<br />
Month<br />
6-<br />
Month<br />
Interview Completion Rate at<br />
Each Assessment Pointe<br />
55 40 3 2 2 2 2 0 2 2 2 1 0 100.0% 100.0% 100.0% 50.0%<br />
56 340 114 113 107 90 66 55 78 51 30 18 13 69.0% 47.7% 33.3% 27.3% 23.6%<br />
57 2,618 181 139 84 52 20 8 95 52 29 11 2 68.3% 61.9% 55.8% 55.0% 25.0%<br />
58 392 110 100 85 70 56 30 92 82 63 51 28 92.0% 96.5% 90.0% 91.1% 93.3%<br />
59 72 25 25 25 25 24 4 12 0 0 0 0 48.0%<br />
60 602 108 78 65 57 39 23 48 34 34 20 12 61.5% 52.3% 59.6% 51.3% 52.2%<br />
61 492 170 136 96 70 48 19 95 64 43 26 7 69.9% 66.7% 61.4% 54.2% 36.8%<br />
62 251 172 159 142 116 104 61 119 101 87 56 31 74.8% 71.1% 75.0% 53.8% 50.8%<br />
63 362 0 0 0 0 0 0 0 0 0 0 0<br />
64 487 267 267 252 236 206 157 191 146 108 87 52 71.5% 57.9% 45.8% 42.2% 33.1%<br />
65 341 168 156 130 119 93 70 126 97 86 65 38 80.8% 74.6% 72.3% 69.9% 54.3%<br />
66 305 102 94 87 79 60 41 37 19 19 8 5 39.4% 21.8% 24.1% 13.3% 12.2%<br />
67 371 180 177 166 137 109 60 141 108 82 58 34 79.7% 65.1% 59.9% 53.2% 56.7%<br />
68 348 130 95 73 50 29 28 42 19 4 1 0 44.2% 26.0% 8.0% 3.4% 0.0%<br />
69 815 250 215 204 149 95 66 163 159 100 58 39 75.8% 77.9% 67.1% 61.1% 59.1%<br />
70 213 96 88 87 71 59 27 72 66 50 33 12 81.8% 75.9% 70.4% 55.9% 44.4%<br />
71 687 273 206 183 157 133 76 151 117 89 72 39 73.3% 63.9% 56.7% 54.1% 51.3%<br />
72 701 316 299 264 222 178 107 257 215 177 138 76 86.0% 81.4% 79.7% 77.5% 71.0%<br />
73 274 50 50 45 40 32 20 25 16 14 3 5 50.0% 35.6% 35.0% 9.4% 25.0%<br />
74 2,049 304 285 240 192 153 102 179 154 91 66 41 62.8% 64.2% 47.4% 43.1% 40.2%<br />
75 171 115 102 88 77 67 54 88 68 58 44 34 86.3% 77.3% 75.3% 65.7% 63.0%<br />
76 328 52 46 33 15 8 3 28 15 4 5 2 60.9% 45.5% 26.7% 62.5% 66.7%<br />
12-<br />
Month<br />
18-<br />
Month<br />
24-<br />
Month<br />
30-<br />
Month
2006–2008 Annual Report to Congress ● Appendix E ● Page 4<br />
The Comprehensive Community <strong>Mental</strong> Health Services for Children <strong>and</strong> Their Families Program <strong>Evaluation</strong> <strong>Findings</strong><br />
Community<br />
Table E-2: Study Enrollment <strong>and</strong> Program Interview Completion for Grant Communities Funded in 2002–2004 as of June 2008<br />
(continued)<br />
Descriptive<br />
Sample a<br />
Outcome<br />
Sample b<br />
6-<br />
Month<br />
Eligible for Interview at<br />
Each Assessment Pointc<br />
12-<br />
Month<br />
18-<br />
Month<br />
24-<br />
Month<br />
30-<br />
Month<br />
6-<br />
Month<br />
Completed Interview at<br />
Each Assessment Pointd<br />
12-<br />
Month<br />
18-<br />
Month<br />
24-<br />
Month<br />
30-<br />
Month<br />
6-<br />
Month<br />
Interview Completion Rate at<br />
Each Assessment Pointe<br />
77 293 147 147 136 121 95 60 60 47 21 8 0 40.8% 34.6% 17.4% 8.4% 0.0%<br />
78 102 53 40 24 24 24 24 28 2 0 3 5 70.0% 8.3% 0.0% 12.5% 20.8%<br />
79 446 280 280 254 212 166 118 244 210 172 133 94 87.1% 82.7% 81.1% 80.1% 79.7%<br />
80 329 127 81 63 37 18 0 39 29 9 5 0 48.1% 46.0% 24.3% 27.8%<br />
81 99 50 18 6 0 0 0 16 6 0 0 0 88.9% 100.0%<br />
82 1,138 218 169 126 81 29 0 125 85 49 13 0 74.0% 67.5% 60.5% 44.8%<br />
83 1,069 210 156 120 77 31 2 140 102 62 21 1 89.7% 85.0% 80.5% 67.7% 50.0%<br />
Aggregated<br />
Number<br />
15,735 f 4,271 f 3,698 3,162 2,553 1,920 1,211 2,681 2,066 1,483 1,004 570 72.5% 65.3% 58.1% 52.3% 47.1%<br />
a<br />
Baseline Descriptive Sample is the number of cases with data submitted for any instrument.<br />
b<br />
Baseline Outcome Sample is the number of cases with at least one of the required outcome instruments completed at baseline <strong>and</strong> submitted. Because it may take more than one interview session to<br />
complete all the instruments for an assessment, the earliest instrument completion date for each child/youth at each assessment point is used for calculating the retention rates. The target assessment date for<br />
followup assessments is based on the child/youth‘s earliest baseline instrument date. Follow-up interview data may be collected during a window of 6 weeks before through 6 weeks after the target assessment<br />
date.<br />
c<br />
Eligible for Interview at Each Assessment Point is the number of children/youth for whom the following criteria are met at the time the data are downloaded: (a) the entire interview window has closed (each<br />
child/youth has exited the 6 weeks after the target assessment date window) <strong>and</strong> (b) at least one of the required outcome instruments administered at baseline has been submitted.<br />
d<br />
Completed Interview at Each Assessment Point is the number of children/youth for whom the following criteria are met at the time the data are downloaded: (a) the entire interview window has closed (each<br />
child/youth has exited the 6 weeks after the target assessment date window) <strong>and</strong> (b) at least one of the required outcome instruments for that followup assessment has been submitted.<br />
e<br />
Interview Completion Rate at Each Assessment Point is calculated as the (completed interview number at 6 weeks after the target assessment date / eligible number at 6 weeks after the target assessment<br />
date) x 100%.<br />
f The baseline descriptive <strong>and</strong> outcome sample numbers reflect the enrollment <strong>and</strong> data collection efforts of all sites since the beginning of the grant program. During FY 2006 two sites were defunded. Those<br />
sites contributed about 400 children to the baseline descriptive sample <strong>and</strong> about 20 children to the baseline outcome sample. Data from the two sites are not included in the aggregated number for eligible for<br />
interview, completed interview, <strong>and</strong> interview completion rate at each assessment point.<br />
12-<br />
Month<br />
18-<br />
Month<br />
24-<br />
Month<br />
30-<br />
Month
2006–2008 Annual Report to Congress ● Appendix E ● Page 5<br />
The Comprehensive Community <strong>Mental</strong> Health Services for Children <strong>and</strong> Their Families Program <strong>Evaluation</strong> <strong>Findings</strong><br />
Community<br />
Table E-3: Study Enrollment <strong>and</strong> Program Interview Completion for Grant Communities Funded in 2005–2006 as of June 2008<br />
Descriptive<br />
Sample a<br />
Outcome<br />
Sample b<br />
6-<br />
Month<br />
Eligible for Interview at<br />
Each Assessment Point c<br />
12-<br />
Month<br />
18-<br />
Month<br />
24-<br />
Month<br />
30-<br />
Month<br />
6-<br />
Month<br />
Completed Interview at<br />
Each Assessment Point d<br />
12-<br />
Month<br />
18-<br />
Month<br />
24-<br />
Month<br />
30-<br />
Month<br />
6-<br />
Month<br />
Interview Completion Rate at<br />
Each Assessment Point e<br />
100 106 47 35 26 5 30 20 1 85.7% 76.9% 20.0%<br />
101 79 39 33 26 8 31 17 2 93.9% 65.4% 25.0%<br />
102 143 40 19 4 2 10 0 0 52.6% 0.0% 0.0%<br />
103 118 112 93 38 1 22 0 0 23.7% 0.0% 0.0%<br />
104 193 10 1 0 0.0%<br />
105 82 66 55 24 42 13 76.4% 54.2%<br />
106 146 74 68 30 2 39 10 0 57.4% 33.3% 0.0%<br />
107 57 20 18 13 11 6 61.1% 46.2%<br />
108 115 83 65 32 3 28 4 0 43.1% 12.5% 0.0%<br />
109 53 37 13 5 11 2 84.6% 40.0%<br />
110 211 98 82 16 48 0 58.5% 0.0%<br />
111 198 89 63 42 1 52 26 0 82.5% 61.9% 0.0%<br />
112 134 111 85 49 2 73 41 1 85.9% 83.7% 50.0%<br />
113 204 103 49 16 35 12 71.4% 75.0%<br />
114 33 25 20 5 17 1 85.0% 20.0%<br />
115 319 60 42 7 12 0 28.6% 0.0%<br />
116 299 130 112 62 2 64 8 0 57.1% 12.9% 0.0%<br />
117 47 40 29 15 4 28 13 3 96.6% 86.7% 75.0%<br />
118 31 29 16 16<br />
119 69 18 9 5 55.6%<br />
120 118 72 44 31 40 23 90.9% 74.2%<br />
100.0<br />
%<br />
12-<br />
Month<br />
18-<br />
Month<br />
24-<br />
Month<br />
30-<br />
Month
2006–2008 Annual Report to Congress ● Appendix E ● Page 6<br />
The Comprehensive Community <strong>Mental</strong> Health Services for Children <strong>and</strong> Their Families Program <strong>Evaluation</strong> <strong>Findings</strong><br />
Community<br />
Table E-3: Study Enrollment <strong>and</strong> Program Interview Completion for Grant Communities Funded in 2005–2006 as of June 2008<br />
(continued)<br />
Descriptive<br />
Sample a<br />
Outcome<br />
Sample b<br />
6-<br />
Month<br />
Eligible for Interview at<br />
Each Assessment Pointc<br />
12-<br />
Month<br />
18-<br />
Month<br />
24-<br />
Month<br />
30-<br />
Month<br />
121 31 12 5 1<br />
6-<br />
Month<br />
Completed Interview at<br />
Each Assessment Pointd<br />
12-<br />
Month<br />
18-<br />
Month<br />
24-<br />
Month<br />
30-<br />
Month<br />
6-<br />
Month<br />
Interview Completion Rate at<br />
Each Assessment Pointe<br />
122 115 78 53 28 3 38 18 0 71.7% 64.3% 0.0%<br />
123 101 51 46 36 10 44 27 1<br />
95.7% 75.0% 10.0%<br />
124 37 22 16 7 11 3 68.8% 42.9%<br />
125 0 0<br />
126 0 0<br />
127 24 17 3 1 0 0<br />
0.0% 0.0%<br />
128 54 34 9 7 77.8%<br />
129 18 14 2 2<br />
Aggregated<br />
Number<br />
3135 1531 1085 513 43 717 244 8 66.1% 47.6% 18.6%<br />
a Descriptive Sample was based on number of cases with at least one piece of descriptive information.<br />
b Outcome Sample was based on number of cases with at least one of the required outcome instruments at baseline.<br />
c Eligibility for Interview at Each Assessment Point was derived based on the following criteria: (a) data indicated that the child had been enrolled in the system for 6 months or longer<br />
(for 6-month followup), 12 months or longer (for 12-month followup), 18 months or longer (for 18-month followup), 24 months or longer (for 24-month followup), or 30 months or longer<br />
(for 30-month followup); <strong>and</strong> (b) the child had at least one of the required outcome instruments administered at intake.<br />
d Completed Interview at Each Assessment Point was derived based on the following criteria: (a) 6-month outcome sample: cases with 6-month data on at least one of the required<br />
outcome instruments; (b) 12-month outcome sample: cases with 12-month data on at least one of the required outcome instruments; (c) 18-month outcome sample: cases with 18-<br />
month data on at least one of the required outcome instruments; (d) 24-month outcome sample: cases with 24-month data on at least one of the required outcome instruments; <strong>and</strong> (e)<br />
30-month outcome sample: cases with 30-month data on at least one of the required outcome instruments.<br />
e Interview Completion Rate at Each Assessment Point was calculated as follows: (Completed interview at each assessment point / Eligibility for interview at each assessment point) x<br />
100%<br />
20.0%<br />
100.0<br />
%<br />
12-<br />
Month<br />
18-<br />
Month<br />
24-<br />
Month<br />
30-<br />
Month
Demographic Characteristics,<br />
Clinical Status, <strong>and</strong> Child <strong>and</strong><br />
Family Outcomes<br />
Table E-4 presents detailed information on<br />
the baseline child <strong>and</strong> family characteristics<br />
of children <strong>and</strong> families enrolled in grant<br />
communities initially funded in 1999–2000.<br />
Table E-5 presents detailed information on<br />
the baseline child <strong>and</strong> family demographics<br />
<strong>and</strong> enrollment information of children <strong>and</strong><br />
families enrolled in grant communities<br />
initially funded in 2002–2004. Table E-6<br />
presents the same information for children<br />
<strong>and</strong> families enrolled in grant communities<br />
initially funded in 2005–2006.<br />
Baseline child history <strong>and</strong> family<br />
characteristics are shown in Table E-7 for<br />
children <strong>and</strong> families enrolled in grant<br />
communities initially funded in 2002–2004,<br />
<strong>and</strong> in Table E-8 for children <strong>and</strong> families<br />
enrolled in grant communities initially<br />
funded in 2005–2006.<br />
Information on child <strong>and</strong> family clinical <strong>and</strong><br />
functional outcome indicators at intake, 6<br />
months, 12 months, 18 months, 24 months,<br />
<strong>and</strong> 30 months are presented for children<br />
<strong>and</strong> families enrolled in grant communities<br />
initially funded in 1999–2000 (see Table E-<br />
9). Table E-10 presents the same<br />
information collected at intake, 6 months, 12<br />
months, 18 months, <strong>and</strong> 24 months is<br />
presented for children <strong>and</strong> families enrolled<br />
in grant communities initially funded in<br />
2002–2004. Table E-11 presents this<br />
information collected at intake <strong>and</strong> 6 months<br />
for children <strong>and</strong> families enrolled in grant<br />
communities initially funded in 2005–2006.<br />
Information on clinical <strong>and</strong> functional<br />
outcomes at each data collection point does<br />
not represent changes over time. Rather, the<br />
information provides descriptive<br />
information on these outcomes at each data<br />
collection point. Some children <strong>and</strong> families<br />
may not have data collected across all data<br />
collection points.<br />
Table E-4: Baseline Child <strong>and</strong> Family Characteristics for Grant Communities Funded in 1999–2000<br />
Grant Communities Funded in 1999–2000<br />
Overall Sample Descriptive Sample Outcome Sample<br />
Gender (n = 9,200) (n = 5,215) (n = 3,985)<br />
Male 65.7% 63.9% 68.2%<br />
Female 34.3% 36.1% 31.8%<br />
Age (n = 9,168) (n = 5,183) (n = 3,985)<br />
Mean 12.4 12.5 12.2<br />
0–5 Years 4.1% 4.6% 3.4%<br />
6–11 Years 32.5% 31.2% 34.2%<br />
12–15 Years 43.9% 42.1% 46.1%<br />
16 Years or Older 19.6% 22.1% 16.3%<br />
The Comprehensive Community <strong>Mental</strong> Health Services for Children <strong>and</strong> Their Families Program <strong>Evaluation</strong> <strong>Findings</strong><br />
2006–08 Annual Report to Congress ● Appendix E ● Page 7
Table E-4: Baseline Child <strong>and</strong> Family Characteristics for Grant Communities Funded in 1999–2000<br />
(continued)<br />
Grant Communities Funded in 1999–2000<br />
Overall Sample Descriptive Sample Outcome Sample<br />
Race <strong>and</strong> Ethnicity a (n = 8,904) (n = 4,972) (n = 3,932)<br />
African American 32.0% 31.7% 32.5%<br />
American Indian 10.2% 11.7% 8.4%<br />
Asian 0.7% 0.7% 0.8%<br />
Hispanic Ethnicity 11.1% 9.6% 13.1%<br />
Native Hawaiian or Pacific Isl<strong>and</strong>er 0.3% 0.3% 0.4%<br />
White 50.7% 48.3% 53.7%<br />
Other 1.5% 1.8% 1.1%<br />
Biracial/Multiracial 7.4% 5.3% 10.1%<br />
Custody (n = 8,846) (n = 4,917) (n = 3,929)<br />
Two Parents 24.6% 25.3% 23.7%<br />
Mother 42.8% 41.4% 44.4%<br />
Father 4.0% 3.7% 4.4%<br />
Adoptive Parent(s) 4.9% 4.1% 5.9%<br />
Foster Parent(s) or Ward of State 10.6% 12.4% 8.3%<br />
Gr<strong>and</strong>parents 6.5% 5.6% 7.7%<br />
Other 6.6% 7.4% 5.7%<br />
Primary Caregiver Gender (n = 7,882) (n = 3,919) (n = 3,963)<br />
Male 17.4% 24.3% 10.6%<br />
Female 82.6% 75.7% 89.4%<br />
Primary Caregiver Age (n = 6,234) (n = 2,526) (n = 3,708)<br />
Mean 40.3 39.8 40.7<br />
16–25 Years 3.1% 2.6% 3.5%<br />
26–30 Years 9.7% 9.4% 9.9%<br />
31–35 Years 21.2% 22.7% 20.2%<br />
36–40 Years 23.5% 26.6% 21.5%<br />
41–45 Years 17.2% 17.4% 17.1%<br />
46–50 Years 10.8% 9.4% 11.8%<br />
51 Years or Older 14.3% 12.0% 16.0%<br />
Family Income (n = 6,059) (n = 2,487) (n = 3,572)<br />
Less Than $10,000 30.1% 29.9% 30.2%<br />
$10,000–$19,999 27.5% 27.2% 27.7%<br />
$20,000–$34,999 23.1% 25.3% 21.5%<br />
$35,000–$49,999 9.2% 8.9% 9.4%<br />
$50,000–$74,999 6.3% 5.9% 6.7%<br />
$75,000 or More 3.8% 2.8% 4.5%<br />
The Comprehensive Community <strong>Mental</strong> Health Services for Children <strong>and</strong> Their Families Program <strong>Evaluation</strong> <strong>Findings</strong><br />
2006–08 Annual Report to Congress ● Appendix E ● Page 8
Table E-4: Baseline Child <strong>and</strong> Family Characteristics for Grant Communities Funded in 1999–2000<br />
(continued)<br />
Grant Communities Funded in 1999–2000<br />
Overall Sample Descriptive Sample Outcome Sample<br />
Poverty Level (n = 5,700) (n = 2,316) (n = 3,384)<br />
Below Poverty 53.9% 54.5% 53.5%<br />
At Poverty 8.9% 9.9% 8.2%<br />
Above Poverty 37.2% 35.6% 38.4%<br />
Financial Resources for Services<br />
Medicaid Recipient 74.2% (n = 8,570) 75.6% (n = 4,676) 72.5% (n = 3,894)<br />
Supplemental Security Income (SSI) 19.7% (n = 6,679) 15.2% (n = 2,844) 23.1% (n = 3,835)<br />
Children‘s Health Insurance Program<br />
22.3% (n = 6,659) 20.4% (n = 2,849) 23.8% (n = 3,810)<br />
(CHIP)<br />
Temporary Assistance for Need Families<br />
18.4% (n = 6,673) 17.6% (n = 2,849) 19.1% (n = 3,824)<br />
(TANF)<br />
Other Assistance 15.1% (n = 6,688) 14.3% (n = 2,854) 15.7% (n = 3,834)<br />
Family Pays for Services 21.7% (n = 7,295) 19.2% (n = 3,472) 24.0% (n = 3,823)<br />
Number of Child Risk Factors (n = 9,201) (n = 5,216) (n = 3,985)<br />
No Risk Factors 28.7% 28.7% 28.6%<br />
One Risk Factor 23.3% 22.0% 24.9%<br />
Two Risk Factors 16.7% 13.8% 20.6%<br />
Three or More Risk Factors 31.3% 35.5% 25.9%<br />
Mean (n = 7,970) (n = 4,048) (n = 3,922)<br />
1.4 1.3 1.6<br />
Number of Family Risk Factors (n = 9,201) (n = 5,216) (n = 3,985)<br />
No Risk Factors 15.3% 16.7% 13.6%<br />
One Risk Factor 16.2% 16.6% 15.5%<br />
Two Risk Factors 12.4% 9.8% 15.8%<br />
Three or More Risk Factors 56.1% 56.9% 55.1%<br />
Mean (n = 7,549) (n = 3,695) (n = 3,854)<br />
2.4 2.1 2.7<br />
Referral Sources (n = 8,310) (n = 4,799) (n = 3,511)<br />
Court 7.7% 7.3% 8.1%<br />
Corrections 2.7% 2.9% 2.5%<br />
School 13.1% 10.6% 16.6%<br />
<strong>Mental</strong> Health Centers 43.6% 41.5% 46.6%<br />
<strong>Substance</strong> <strong>Abuse</strong> Treatment Clinics 0.2% 0.1% 0.2%<br />
Physical Health Care Agencies 2.6% 4.2% 0.5%<br />
Child Welfare Agencies 11.6% 12.7% 10.1%<br />
Caregiver 8.1% 8.9% 7.0%<br />
Self 1.4% 1.4% 1.4%<br />
Other 9.0% 10.4% 7.0%<br />
The Comprehensive Community <strong>Mental</strong> Health Services for Children <strong>and</strong> Their Families Program <strong>Evaluation</strong> <strong>Findings</strong><br />
2006–08 Annual Report to Congress ● Appendix E ● Page 9
Table E-4: Baseline Child <strong>and</strong> Family Characteristics for Grant Communities Funded in 1999–2000<br />
(continued)<br />
Grant Communities Funded in 1999–2000<br />
Overall Sample Descriptive Sample Outcome Sample<br />
Previous Services, Past Year 85.8% (n = 7,002) 79.6% (n = 3,122) 90.9% (n = 3,880)<br />
Outpatient 68.5% (n = 6,846) 60.1% (n = 2,988) 75.0% (n = 3,858)<br />
School Based 60.2% (n = 6,738) 52.3% (n = 2,916) 66.3% (n = 3,822)<br />
Day Treatment 17.7% (n = 6,725) 11.2% (n = 2,899) 22.6% (n = 3,826)<br />
Residential/Inpatient 30.7% (n = 7,199) 25.3% (n = 3,358) 35.4% (n = 3,841)<br />
<strong>Substance</strong> <strong>Abuse</strong> Treatment 8.3% (n = 6,723) 7.2% (n = 2,898) 9.1% (n = 3,825)<br />
Child Risk Factors<br />
Previous Psychiatric Hospitalization 34.6% (n = 7,548) 30.7% (n = 3,682) 38.2% (n = 3,866)<br />
Physically <strong>Abuse</strong>d 26.3% (n = 7,514) 26.0% (n = 3,733) 26.6% (n = 3,781)<br />
Sexually <strong>Abuse</strong>d 21.7% (n = 7,354) 20.7% (n = 3,689) 22.8% (n = 3,665)<br />
Run Away 29.2% (n = 6,974) 26.5% (n = 3,103) 31.3% (n = 3,871)<br />
Attempted Suicide 15.5% (n = 6,898) 11.1% (n = 3,051) 18.9% (n = 3,847)<br />
<strong>Substance</strong> <strong>Abuse</strong> 18.0% (n = 7,678) 19.3% (n =3,802) 16.6% (n = 3,876)<br />
Sexually Abusive to Others 8.4% (n = 7,539) 8.4% (n =3,708) 8.5% (n = 3,831)<br />
Family Risk Factors<br />
Domestic Violence 50.7% (n = 6,599) 50.2% (n = 2,893) 51.2% (n = 3,706)<br />
<strong>Mental</strong> Illness in Biological Family 59.2% (n = 6,391) 56.8% (n = 2,747) 61.0% (n = 3,644)<br />
Psychiatric Hospitalization of Biological<br />
Parents 41.4% (n = 3,485) 38.0% (n = 1,400) 43.6% (n = 2,085)<br />
Biological Parents Convicted of a Crime 48.1% (n = 6,280) 46.4% (n = 2,697) 49.4% (n = 3,583)<br />
<strong>Substance</strong> <strong>Abuse</strong> in Biological Family 62.9% (n = 7,197) 61.2% (n = 3,468) 64.5% (n = 3,729)<br />
Treatment Received for <strong>Substance</strong><br />
<strong>Abuse</strong> 56.0% (n = 3,720) 54.5% (n = 1,577) 57.1% (n = 2,143)<br />
The Comprehensive Community <strong>Mental</strong> Health Services for Children <strong>and</strong> Their Families Program <strong>Evaluation</strong> <strong>Findings</strong><br />
2006–08 Annual Report to Congress ● Appendix E ● Page 10
Table E-4: Baseline Child <strong>and</strong> Family Characteristics for Grant Communities Funded in 1999–2000<br />
(continued)<br />
Grant Communities Funded in 1999–2000<br />
Overall Sample Descriptive Sample Outcome Sample<br />
Diagnosis b (n = 6,975) (n = 3,841) (n = 3,134)<br />
Conduct Disorder 8.6% 8.0% 9.4%<br />
ADHD 40.9% 37.9% 44.6%<br />
Oppositional Defiant Disorder 27.4% 26.9% 28.1%<br />
Mood Disorder 35.3% 32.9% 38.2%<br />
Adjustment Disorder 9.7% 11.5% 7.5%<br />
<strong>Substance</strong> Use 5.1% 5.5% 4.6%<br />
Posttraumatic Stress Disorder 8.9% 8.6% 9.3%<br />
Impulsive Control Disorder 4.7% 4.5% 5.0%<br />
Disruptive Behavior Disorder 5.6% 5.9% 5.1%<br />
Learning <strong>and</strong> Related Disorders 4.4% 4.2% 4.8%<br />
<strong>Mental</strong> Retardation 4.3% 4.2% 4.5%<br />
Anxiety Disorder 6.7% 7.3% 6.0%<br />
Psychosis 3.7% 3.3% 4.1%<br />
Autism <strong>and</strong> Related disorder 3.0% 2.6% 3.5%<br />
VCode 5.0% 4.9% 5.2%<br />
Other 7.1% 7.0% 7.3%<br />
Current Medication Use (n = 7,576) (n = 3,673) (n = 3,903)<br />
Yes 58.0% 50.1% 65.5%<br />
No 42.0% 49.9% 34.5%<br />
Presenting Problems c (n = 8,308) (n = 4,466) (n = 3,842)<br />
Mean 6.3 5.4 7.3<br />
Sadness 35.4% 35.8% 34.9%<br />
Suicide Ideation 17.1% 15.4% 19.2%<br />
Suicide Attempt 8.5% 6.5% 10.7%<br />
Physical Aggression 47.2% 43.3% 51.8%<br />
Property Damage 21.2% 15.5% 28.0%<br />
Runaway 13.3% 11.4% 15.5%<br />
Hyperactive–Impulsive 40.3% 35.1% 46.4%<br />
Attentional Difficulties 39.9% 33.7% 47.1%<br />
Police Contact 21.5% 18.5% 24.9%<br />
Academic Difficulties 42.4% 39.2% 46.1%<br />
Non-Compliance 45.9% 38.9% 54.0%<br />
Poor Self-Esteem 30.8% 26.2% 36.2%<br />
Truancy 12.6% 11.7% 13.7%<br />
Alcohol <strong>and</strong> <strong>Substance</strong> Use 12.2% 13.1% 11.2%<br />
Poor Peer Interaction 30.5% 26.5% 35.2%<br />
Extreme Verbal <strong>Abuse</strong> 22.0% 16.0% 28.9%<br />
Theft 14.2% 10.8% 18.1%<br />
Anxious 29.9% 25.9% 34.5%<br />
Sleep Disorders 14.5% 10.9% 18.7%<br />
Eating Disorders 6.6% 4.9% 8.6%<br />
Somatic Complaints 7.1% 5.2% 9.3%<br />
Self-Injury 13.6% 12.0% 15.5%<br />
Social Contact Avoidance 11.5% 8.7% 14.7%<br />
Sexual Assault 4.8% 4.0% 5.8%<br />
Threat to Life of Others 12.1% 9.7% 14.9%<br />
Fire Setting 6.7% 5.0% 8.6%<br />
Cruelty to Animals 5.6% 4.1% 7.3%<br />
Inappropriate Bowel Movements 2.9% 2.1% 3.8%<br />
Over-Dependence on Adults 10.7% 6.9% 15.1%<br />
Bladder Difficulties 4.8% 3.3% 6.6%<br />
Sexual Acting Out 9.5% 9.3% 9.8%<br />
Other Problems 21.4% 23.8% 18.6%<br />
a Because an individual may chose more than one racial background, the race variable may sum to more than 100%.<br />
b Because children may have more than one diagnosis, the diagnosis variables may sum to more than 100%.<br />
c<br />
Because children may present with more than one problem, the variable presenting problems may sum to more than 100%.<br />
The Comprehensive Community <strong>Mental</strong> Health Services for Children <strong>and</strong> Their Families Program <strong>Evaluation</strong> <strong>Findings</strong><br />
2006–08 Annual Report to Congress ● Appendix E ● Page 11
Table E-5: Baseline Characteristics: Child Demographic <strong>and</strong> Enrollment Information<br />
for Grant Communities Funded in 2002–2004<br />
Grant Communities Funded in 2002–2004<br />
Overall Sample<br />
(n = 15,735)<br />
Descriptive Sample<br />
(n = 11,464)<br />
Outcome Sample<br />
(n = 4,271)<br />
Gender (n = 15,485) (n = 11,342) (n = 4,143)<br />
Male 63.6% 62.7% 66.0%<br />
Female 36.4% 37.3% 34.0%<br />
Age in Years (n = 15,493) (n = 11,349) (n = 4,144)<br />
Mean (SD) 11.5 (4.4) 11.5 (4.6) 11.6 (4.0)<br />
0–5 Years 12.1% 13.0% 9.6%<br />
6–11 Years 30.8% 29.9% 33.2%<br />
12–15 Years 37.5% 36.1% 41.2%<br />
16 Years or Older 19.7% 21.0% 16.0%<br />
Race <strong>and</strong> Ethnicity (n = 15,219) (n = 11,113) (n = 4,106)<br />
American Indian or Alaska Native Alone 4.6% 4.9% 4.0%<br />
Asian Alone 1.3% 1.4% 0.9%<br />
Black or African American Alone 24.8% 23.0% 29.5%<br />
Native Hawaiian or Other Pacific Isl<strong>and</strong>er Alone 1.9% 1.5% 3.1%<br />
White Alone 37.8% 38.5% 36.1%<br />
Of Hispanic Origin 25.9% 27.4% 22.1%<br />
Multiracial 3.3% 3.0% 4.1%<br />
Other, Single Race 0.3% 0.3% 0.2%<br />
Participating in Service Plan Development a (n = 8,111) (n = 5,421) (n = 2,690)<br />
Caregiver 89.6% 87.0% 94.9%<br />
Child 76.3% 77.4% 74.1%<br />
Other Family Member 30.8% 30.4% 31.6%<br />
Case Manager 75.6% 73.1% 80.6%<br />
Therapist 33.6% 31.7% 37.5%<br />
Other <strong>Mental</strong> Health Staff 18.1% 18.8% 16.6%<br />
Education Staff 17.4% 16.7% 18.8%<br />
Child Welfare Staff 13.7% 15.5% 10.0%<br />
Juvenile Justice 9.4% 10.1% 8.0%<br />
Health Staff 3.4% 4.1% 1.9%<br />
Family Advocate 20.0% 20.0% 20.0%<br />
Other Participant 17.8% 17.1% 19.3%<br />
Referral Sources (n = 15,410) (n = 11,329) (n = 4,081)<br />
Corrections 0.6% 0.7% 0.6%<br />
Juvenile Court 4.3% 4.6% 3.5%<br />
Probation 6.5% 7.2% 4.6%<br />
School 24.1% 23.3% 26.4%<br />
<strong>Mental</strong> Health 22.2% 20.5% 26.7%<br />
Physical Health 1.8% 1.9% 1.3%<br />
Child Welfare 16.9% 19.5% 9.9%<br />
<strong>Substance</strong> <strong>Abuse</strong> Clinic 0.8% 0.6% 1.3%<br />
Family Court 0.3% 0.3% 0.2%<br />
Caregiver 9.8% 8.8% 12.5%<br />
Self 3.0% 3.4% 1.9%<br />
Other 9.7% 9.2% 11.1%<br />
Agency Involvement a (n = 15,606) (n = 11,451) (n = 4,155)<br />
Corrections 2.1% 2.0% 2.4%<br />
Juvenile Court 12.9% 12.5% 13.8%<br />
Probation 11.0% 11.0% 11.0%<br />
School 59.8% 56.9% 67.7%<br />
<strong>Mental</strong> Health 53.3% 48.2% 67.6%<br />
Physical Health 11.8% 10.4% 15.6%<br />
Child Welfare 24.5% 26.3% 19.4%<br />
<strong>Substance</strong> <strong>Abuse</strong> Clinic 3.2% 3.0% 3.8%<br />
Family Court 5.9% 6.3% 5.0%<br />
Other 15.7% 16.2% 14.0%<br />
The Comprehensive Community <strong>Mental</strong> Health Services for Children <strong>and</strong> Their Families Program <strong>Evaluation</strong> <strong>Findings</strong><br />
2006–08 Annual Report to Congress ● Appendix E ● Page 12
Table E-5: Baseline Characteristics: Child Demographic <strong>and</strong> Enrollment Information<br />
for Grant Communities Funded in 2002–2004 (continued)<br />
Grant Communities Funded in 2002–2004<br />
Overall Sample<br />
(n = 15,735)<br />
Descriptive Sample<br />
(n = 11,464)<br />
Outcome Sample<br />
(n = 4,271)<br />
DSM–IV Axis I <strong>and</strong> II Diagnosis a (n = 12,219) (n = 8,679) (n = 3,540)<br />
<strong>Substance</strong> Use Disorders 6.0% 6.4% 4.9%<br />
Schizophrenia <strong>and</strong> Other Psychotic Disorders 2.4% 2.2% 2.8%<br />
Mood Disorders 33.7% 32.4% 37.0%<br />
Autism <strong>and</strong> Other Pervasive Developmental Disorders 2.5% 2.3% 3.1%<br />
Anxiety Disorder 6.4% 6.3% 6.7%<br />
Adjustment Disorders 13.8% 14.4% 12.4%<br />
Posttraumatic Stress Disorder <strong>and</strong> Acute Stress Disorder 8.5% 8.4% 9.0%<br />
Impulse Control Disorders 2.7% 2.5% 3.2%<br />
Oppositional Defiant Disorder 22.4% 20.0% 28.1%<br />
Attention-Deficit/Hyperactivity Disorder (ADHD) 29.6% 26.0% 38.3%<br />
Personality Disorders 0.9% 0.9% 1.0%<br />
<strong>Mental</strong> Retardation 2.6% 2.7% 2.5%<br />
Learning, Motor Skills, <strong>and</strong> Communication Disorders 3.7% 3.4% 4.4%<br />
Conduct Disorder 6.6% 6.3% 7.1%<br />
Disruptive Behavior Disorder 6.5% 6.3% 7.1%<br />
Other 10.4% 12.0% 6.5%<br />
V Code 7.8% 7.7% 7.9%<br />
<strong>Substance</strong>-Induced Disorders 0.3% 0.2% 0.3%<br />
DC:0–3R Axis I Diagnosis a (n = 139) (n = 101) (n = 38)<br />
Sensory Stimulation-Seeking/Impulsive 20.9% 20.8% 21.1%<br />
Anxiety Disorders 18.7% 20.8% 13.2%<br />
Adjustment Disorder 17.3% 20.8% 7.9%<br />
Hypersensitive 12.2% 10.9% 15.8%<br />
Posttraumatic Stress Disorder 9.4% 7.9% 13.2%<br />
Deprivation/Maltreatment Disorder 8.6% 8.9% 7.9%<br />
Other Disorders 6.5% 5.9% 7.9%<br />
Depression 4.3% 2.0% 10.5%<br />
Mixed Disorders of Emotional Expressiveness 4.3% 2.0% 10.5%<br />
Hyposensitive/Underresponsive 4.3% 5.9% 0.0%<br />
Disorders of Relating <strong>and</strong> Communicating 3.6% 5.0% 0.0%<br />
Multi-System Developmental Disorder (MSDD) 2.2% 3.0% 0.0%<br />
Prolonged Bereavement/Grief Reaction 1.4% 2.0% 0.0%<br />
Disorders of Affect 0.0% 0.0% 0.0%<br />
Regulation Disorders of Sensory Processing 0.0% 0.0% 0.0%<br />
Sleep Behavior Disorder 0.0% 0.0% 0.0%<br />
Sleep Onset Disorder 0.0% 0.0% 0.0%<br />
Night-Waking Disorder 0.0% 0.0% 0.0%<br />
Feeding Disorders 0.0% 0.0% 0.0%<br />
The Comprehensive Community <strong>Mental</strong> Health Services for Children <strong>and</strong> Their Families Program <strong>Evaluation</strong> <strong>Findings</strong><br />
2006–08 Annual Report to Congress ● Appendix E ● Page 13
Table E-5: Baseline Characteristics: Child Demographic <strong>and</strong> Enrollment Information<br />
for Grant Communities Funded in 2002–2004 (continued)<br />
Grant Communities Funded in 2002–2004<br />
Overall Sample<br />
(n = 15,735)<br />
Descriptive Sample<br />
(n = 11,464)<br />
Outcome Sample<br />
(n = 4,271)<br />
Presenting Problems a (n = 14,792) (n = 10,751) (n = 4,041)<br />
Suicide Ideation/Self-Injury 16.8% 16.2% 18.4%<br />
Depression 36.6% 35.6% 39.3%<br />
Anxiety 28.3% 27.8% 29.6%<br />
Hyperactivity/Attention 38.3% 34.5% 48.4%<br />
Conduct/Delinquency 58.1% 54.4% 67.8%<br />
<strong>Substance</strong> Use 11.2% 11.3% 11.0%<br />
Adjustment 34.0% 33.2% 36.0%<br />
Psychotic Behaviors 5.4% 4.7% 7.5%<br />
Pervasive Development Disability 4.3% 4.0% 5.1%<br />
Specific Development Disability 5.9% 5.3% 7.5%<br />
Learning Disability 13.1% 11.9% 16.2%<br />
School Performance 31.4% 27.7% 41.4%<br />
Eating Disorder 4.8% 5.6% 2.4%<br />
Other 12.1% 11.9% 12.6%<br />
Financial Resources for Services a (n = 12,658) (n = 8,947) (n = 3,711)<br />
Medicaid 73.8% 73.3% 74.8%<br />
Child Health Insurance Program (CHIP) 4.5% 3.8% 6.1%<br />
Supplemental Security Income (SSI) 8.6% 7.2% 11.8%<br />
Temporary Assistance for Needy Families (TANF) 4.5% 4.0% 5.8%<br />
Private Insurance 17.7% 17.5% 18.0%<br />
Other Assistance 10.3% 10.1% 10.9%<br />
a<br />
An individual may provide more than one response; therefore, percentages may sum to more than 100%.<br />
The Comprehensive Community <strong>Mental</strong> Health Services for Children <strong>and</strong> Their Families Program <strong>Evaluation</strong> <strong>Findings</strong><br />
2006–08 Annual Report to Congress ● Appendix E ● Page 14
Table E-6: Baseline Characteristics: Child Demographic <strong>and</strong> Enrollment Information<br />
for Grant Communities Funded in 2005–2006<br />
Grant Communities Funded in 2005–2006<br />
Overall Sample<br />
(n = 3,135)<br />
Descriptive Sample<br />
(n = 1,599)<br />
Outcome<br />
Sample<br />
(n = 1,536)<br />
Gender (n = 3,025) (n = 1,594) (n = 1,431)<br />
Male 62.4% 61.9% 63.1%<br />
Female 37.6% 38.1% 36.9%<br />
Age in Years (n = 3,014) (n = 1,586) (n = 1,428)<br />
Mean (SD) 11.3 (4.5) 12.0 (4.2) 10.6 (4.7)<br />
0–5 Years 14.8% 9.3% 20.9%<br />
6–11 Years 28.1% 28.0% 28.3%<br />
12–15 Years 39.7% 41.9% 37.3%<br />
16 Years or Older 17.4% 20.9% 13.6%<br />
Race <strong>and</strong> Ethnicity (n = 2,988) (n = 1,571) (n = 1,417)<br />
American Indian or Alaska Native Alone 4.7% 4.8% 4.6%<br />
Asian Alone 1.5% 1.9% 1.1%<br />
Black or African American Alone 25.0% 26.2% 23.8%<br />
Native Hawaiian or Other Pacific Isl<strong>and</strong>er Alone 0.4% 0.3% 0.4%<br />
White Alone 43.2% 42.5% 44.0%<br />
Of Hispanic Origin 17.6% 17.4% 17.9%<br />
Multiracial 7.4% 6.7% 8.1%<br />
Other, Single Race 0.1% 0.2% 0.1%<br />
Participating in Service Plan Development a (n = 2,110) (n = 923) (n = 1,187)<br />
Caregiver 96.8% 95.1% 98.1%<br />
Child 74.6% 80.1% 70.3%<br />
Other Family Member 30.4% 28.3% 32.1%<br />
Case Manager 79.1% 78.3% 79.8%<br />
Therapist 48.1% 45.1% 50.4%<br />
Other <strong>Mental</strong> Health Staff 19.3% 16.4% 21.6%<br />
Education Staff 20.2% 17.3% 22.5%<br />
Child Welfare Staff 11.5% 13.3% 10.1%<br />
Juvenile Justice 10.1% 10.7% 9.6%<br />
Health Staff 3.5% 3.0% 3.8%<br />
Family Advocate 26.3% 20.6% 30.7%<br />
Other Participant 22.5% 17.9% 26.1%<br />
The Comprehensive Community <strong>Mental</strong> Health Services for Children <strong>and</strong> Their Families Program <strong>Evaluation</strong> <strong>Findings</strong><br />
2006–08 Annual Report to Congress ● Appendix E ● Page 15
Table E-6: Baseline Characteristics: Child Demographic <strong>and</strong> Enrollment Information<br />
for Grant Communities Funded in 2005–2006 (continued)<br />
Grant Communities Funded in 2005–2006<br />
Overall Sample<br />
(n = 3,135)<br />
Descriptive Sample<br />
(n = 1,599)<br />
Outcome<br />
Sample<br />
(n = 1,536)<br />
Referral Sources (n = 2,996) (n = 1,580) (n = 1,416)<br />
Corrections 0.2% 0.3% 0.2%<br />
Juvenile Court 9.0% 8.9% 9.1%<br />
Probation 3.7% 4.1% 3.2%<br />
School 13.1% 12.9% 13.3%<br />
<strong>Mental</strong> Health 38.2% 39.8% 36.4%<br />
Physical Health 1.8% 1.4% 2.2%<br />
Child Welfare 10.7% 11.2% 10.1%<br />
<strong>Substance</strong> <strong>Abuse</strong> Clinic 0.4% 0.6% 0.2%<br />
Family Court 1.1% 1.6% 0.6%<br />
Caregiver 12.8% 11.6% 14.1%<br />
Self 1.3% 1.5% 1.1%<br />
Other 6.5% 5.8% 7.3%<br />
Early Care 1.2% 0.6% 1.9%<br />
Agency Involvement a (n = 3,026) (n = 1,595) (n = 1,431)<br />
Corrections 1.4% 1.4% 1.3%<br />
Juvenile Court 15.2% 14.9% 15.4%<br />
Probation 13.3% 14.0% 12.4%<br />
School 66.3% 67.8% 64.6%<br />
<strong>Mental</strong> Health 75.3% 74.3% 76.5%<br />
Physical Health 23.1% 22.7% 23.6%<br />
Child Welfare 18.8% 18.7% 18.9%<br />
<strong>Substance</strong> <strong>Abuse</strong> Clinic 3.1% 3.4% 2.7%<br />
Family Court 7.0% 8.0% 5.8%<br />
Other 13.7% 13.5% 13.9%<br />
Early Care 7.2% 4.1% 10.7%<br />
The Comprehensive Community <strong>Mental</strong> Health Services for Children <strong>and</strong> Their Families Program <strong>Evaluation</strong> <strong>Findings</strong><br />
2006–08 Annual Report to Congress ● Appendix E ● Page 16
Table E-6: Baseline Characteristics: Child Demographic <strong>and</strong> Enrollment Information<br />
for Grant Communities Funded in 2005–2006 (continued)<br />
Grant Communities Funded in 2005–2006<br />
Overall Sample<br />
(n = 3,135)<br />
Descriptive Sample<br />
(n = 1,599)<br />
Outcome<br />
Sample<br />
(n = 1,536)<br />
DSM–IV Axis I <strong>and</strong> II Diagnosis a (n = 2,510) (n = 1,255) (n = 1,255)<br />
<strong>Substance</strong> Use Disorders 6.6% 7.9% 5.3%<br />
Schizophrenia <strong>and</strong> Other Psychotic Disorders 2.4% 3.1% 1.6%<br />
Mood Disorders 39.7% 42.7% 36.7%<br />
Autism <strong>and</strong> Other Pervasive Developmental Disorders 3.8% 3.7% 3.9%<br />
Anxiety Disorder 9.7% 10.3% 9.1%<br />
Adjustment Disorders 13.5% 13.9% 13.1%<br />
Posttraumatic Stress Disorder <strong>and</strong> Acute Stress<br />
Disorder<br />
10.4% 11.7% 9.0%<br />
Impulse Control Disorders 2.5% 2.4% 2.7%<br />
Oppositional Defiant Disorder 27.1% 28.0% 26.1%<br />
Attention-Deficit/Hyperactivity Disorder (ADHD) 36.4% 33.9% 38.9%<br />
Personality Disorders 0.8% 0.9% 0.7%<br />
<strong>Mental</strong> Retardation 1.8% 2.5% 1.1%<br />
Learning, Motor Skills, <strong>and</strong> Communication Disorders 4.1% 4.6% 3.7%<br />
Conduct Disorder 4.5% 5.4% 3.6%<br />
Disruptive Behavior Disorder 7.4% 6.0% 8.8%<br />
Other 10.0% 9.7% 10.2%<br />
V Code 6.1% 7.1% 5.1%<br />
<strong>Substance</strong>-Induced Disorders 0.3% 0.3% 0.3%<br />
DC:0–3R Axis I Diagnosis a (n = 120) (n = 110) (n = 10)<br />
Sensory Stimulation-Seeking/Impulsive 10.8% 10.0% n/a<br />
Anxiety Disorders 7.5% 0.0 n/a<br />
Adjustment Disorder 30.8% 30.0% n/a<br />
Hypersensitive 12.5% 12.7% n/a<br />
Posttraumatic Stress Disorder 8.3% 8.2% n/a<br />
Deprivation/Maltreatment Disorder 1.7% 1.8% n/a<br />
Other Disorders 15.8% 16.4% n/a<br />
Depression 2.5% 1.8% n/a<br />
Mixed Disorders of Emotional Expressiveness 5.8% 6.4% n/a<br />
Hyposensitive/Underresponsive 1.7% 0.9% n/a<br />
Disorders of Relating <strong>and</strong> Communicating 3.3% 3.6% n/a<br />
Multi-System Developmental Disorder (MSDD) 0.0% 0.0% n/a<br />
Prolonged Bereavement/Grief Reaction 0.0% 0.0% n/a<br />
Disorders of Affect 3.3% 3.6% n/a<br />
Regulation Disorders of Sensory Processing 5.8% 5.5% n/a<br />
Sleep Behavior Disorder 0.0% 0.0% n/a<br />
Sleep Onset Disorder 1.7% 1.8% n/a<br />
Night-Waking Disorder 0.0% 0.0% n/a<br />
Feeding Disorders 2.5% 2.7% n/a<br />
The Comprehensive Community <strong>Mental</strong> Health Services for Children <strong>and</strong> Their Families Program <strong>Evaluation</strong> <strong>Findings</strong><br />
2006–08 Annual Report to Congress ● Appendix E ● Page 17
Table E-6: Baseline Characteristics: Child Demographic <strong>and</strong> Enrollment Information<br />
for Grant Communities Funded in 2005–2006 (continued)<br />
Grant Communities Funded in 2005–2006<br />
Overall Sample<br />
(n = 3,135)<br />
Descriptive Sample<br />
(n = 1,599)<br />
Outcome<br />
Sample<br />
(n = 1,536)<br />
Presenting Problems a (n = 2,969) (n = 1,551) (n = 1,418)<br />
Suicide Ideation/Self-Injury 14.2% 14.4% 14.0%<br />
Depression 31.9% 34.2% 29.4%<br />
Anxiety 26.8% 28.2% 25.2%<br />
Hyperactivity/Attention 36.8% 34.8% 39.1%<br />
Conduct/Delinquency 56.7% 57.4% 55.9%<br />
<strong>Substance</strong> Use 12.1% 12.0% 12.2%<br />
Adjustment 29.4% 29.3% 29.5%<br />
Psychotic Behaviors 5.2% 5.5% 4.8%<br />
Pervasive Development Disability 5.7% 5.0% 6.3%<br />
Specific Development Disability 5.2% 4.2% 6.3%<br />
Learning Disability 14.9% 13.9% 16.0%<br />
School Performance 36.0% 36.1% 35.9%<br />
Eating Disorder 1.7% 1.9% 1.4%<br />
Other 12.9% 12.8% 13.0%<br />
Feeding Problems in Young Children 1.0% 0.3% 1.8%<br />
Disruptive Behaviors 10.7% 6.6% 15.2%<br />
Persistent Noncompliance 4.9% 3.2% 6.7%<br />
Excessive Crying 5.4% 2.6% 8.5%<br />
Separation 2.5% 1.8% 3.3%<br />
Non-Engagement With People 1.0% 0.7% 1.3%<br />
Sleeping 2.6% 1.4% 3.9%<br />
Excluded From Preschool or Childcare 1.9% 1.4% 2.3%<br />
Family Home Placement 2.0% 1.7% 2.3%<br />
Maltreatment 2.2% 2.2% 2.1%<br />
Child‘s Health 0.8% 0.3% 1.3%<br />
Maternal Depression 2.5% 1.5% 3.6%<br />
Maternal Other <strong>Mental</strong> Health 2.0% 1.5% 2.5%<br />
Paternal <strong>Mental</strong> Health 1.1% 0.6% 1.7%<br />
Caregiver <strong>Mental</strong> Health (Other than Paternal/<br />
Maternal)<br />
0.3% 0.2% 0.4%<br />
Maternal <strong>Substance</strong> <strong>Abuse</strong> 2.5% 2.4% 2.7%<br />
Paternal <strong>Substance</strong> <strong>Abuse</strong> 2.3% 2.3% 2.2%<br />
Caregiver <strong>Substance</strong> <strong>Abuse</strong> (Other than Paternal/<br />
Maternal)<br />
0.1% 0.1% 0.1%<br />
Family Health Problems 1.4% 1.1% 1.7%<br />
Other Parent/ Caregiver/ Family Problems 3.3% 2.8% 3.9%<br />
Problems Related to Housing 1.5% 1.4% 1.7%<br />
Early Child: Other 2.1% 1.1% 3.1%<br />
The Comprehensive Community <strong>Mental</strong> Health Services for Children <strong>and</strong> Their Families Program <strong>Evaluation</strong> <strong>Findings</strong><br />
2006–08 Annual Report to Congress ● Appendix E ● Page 18
Table E-6: Baseline Characteristics: Child Demographic <strong>and</strong> Enrollment Information<br />
for Grant Communities Funded in 2005–2006 (continued)<br />
Grant Communities Funded in 2005–2006<br />
Overall Sample<br />
(n = 3,135)<br />
Descriptive Sample<br />
(n = 1,599)<br />
Outcome<br />
Sample<br />
(n = 1,536)<br />
Financial Resources for Servicesa (n = 2,796) (n = 1,454) (n = 1,342)<br />
Medicaid 69.9% 66.1% 74.0%<br />
Child Health Insurance Program (CHIP) 2.7% 3.2% 2.2%<br />
Supplemental Security Income (SSI) 8.2% 7.5% 8.9%<br />
Temporary Assistance for Needy Families (TANF) 7.3% 5.5% 9.3%<br />
Private Insurance 20.0% 20.4% 19.4%<br />
Other Assistance 14.2% 7.7% 13.6%<br />
a An individual may provide more than one response; therefore, percentages may sum to more than 100%.<br />
The Comprehensive Community <strong>Mental</strong> Health Services for Children <strong>and</strong> Their Families Program <strong>Evaluation</strong> <strong>Findings</strong><br />
2006–08 Annual Report to Congress ● Appendix E ● Page 19
Table E-7: Baseline Characteristics: Child History <strong>and</strong> Family Characteristics<br />
for Grant Communities Funded in 2002–2004<br />
Grant Communities Funded in 2002–2004<br />
Outcome Sample (n = 4,271)<br />
Custody Status (n = 4,041)<br />
Two Parents 24.5%<br />
Biological Mother Only 49.4%<br />
Biological Father Only 4.0%<br />
Adoptive Parents 5.1%<br />
Sibling(s) 0.5%<br />
Aunt <strong>and</strong>/or Uncle 1.9%<br />
Gr<strong>and</strong>parent(s) 7.6%<br />
Adult Friend 0.2%<br />
Ward of the State 4.5%<br />
Other 2.3%<br />
Living Situationa (n = 4,176)<br />
Biological Parent(s) 74.9%<br />
Adoptive Family 5.1%<br />
Relative(s) 20.7%<br />
Non-Family or Foster Care 8.0%<br />
Independent 1.3%<br />
Primary Caregiver Relationship to Child (n = 4,012)<br />
Biological Parent 77.7%<br />
Adoptive Parent 6.4%<br />
Foster Parent 2.1%<br />
Live-In Partner of Parent 0.1%<br />
Sibling 0.5%<br />
Aunt or Uncle 2.3%<br />
Gr<strong>and</strong>parent 8.8%<br />
Cousin 0.3%<br />
Other Relative 0.3%<br />
Adult Friend 0.1%<br />
Other 1.1%<br />
Primary Caregiver Gender (n = 4,052)<br />
Male 8.2%<br />
Female 91.8%<br />
The Comprehensive Community <strong>Mental</strong> Health Services for Children <strong>and</strong> Their Families Program <strong>Evaluation</strong> <strong>Findings</strong><br />
2006–08 Annual Report to Congress ● Appendix E ● Page 20
Table E-7: Baseline Characteristics: Child History <strong>and</strong> Family Characteristics<br />
for Grant Communities Funded in 2002–2004 (continued)<br />
Grant Communities Funded in 2002–2004<br />
Outcome Sample (n = 4,271)<br />
Primary Caregiver Age in Years (n = 4,008)<br />
Mean (SD) 40.1 (10.5)<br />
16–25 Years 3.9%<br />
26–30 Years 13.1%<br />
31–35 Years 21.2%<br />
36–40 Years 20.3%<br />
41–45 Years 15.9%<br />
46–50 Years 10.9%<br />
51 Years or older 14.8%<br />
Primary Caregiver Race <strong>and</strong> Ethnicity (n = 4,040)<br />
American Indian or Alaska Native Alone 3.2%<br />
Asian Alone 0.9%<br />
Black or African American Alone 27.2%<br />
Native Hawaiian or Other Pacific Isl<strong>and</strong>er Alone 2.4%<br />
White Alone 40.9%<br />
Of Hispanic Origin 22.4%<br />
Multiracial 3.0%<br />
Other, Single Race<br />
Primary Caregiver Employed b (n = 4,001)<br />
Yes 54.4%<br />
No 45.6%<br />
Primary Caregiver Paid for Child’s Services b (n = 4,025)<br />
Yes 16.9%<br />
No 83.1%<br />
Family Income (n = 3,913)<br />
Less Than $5,000 16.3%<br />
$5,000–$9,9999 14.2%<br />
$10,000–$14,000 15.7%<br />
$15,000–$19,999 10.4%<br />
$20,000–$24,999 10.8%<br />
$25,000–$34,999 13.1%<br />
$35,000–$49,999 10.0%<br />
$50,000–$74,999 6.5%<br />
$75,000–$99,999 1.8%<br />
$100,000 <strong>and</strong> Over 1.3%<br />
The Comprehensive Community <strong>Mental</strong> Health Services for Children <strong>and</strong> Their Families Program <strong>Evaluation</strong> <strong>Findings</strong><br />
2006–08 Annual Report to Congress ● Appendix E ● Page 21
Table E-7: Baseline Characteristics: Child History <strong>and</strong> Family Characteristics<br />
for Grant Communities Funded in 2002–2004 (continued)<br />
Grant Communities Funded in 2002–2004<br />
Outcome Sample (n = 4,271)<br />
Family Poverty Level (n = 3,691)<br />
Below Poverty 58.0%<br />
At Poverty 17.2%<br />
Above Poverty 24.8%<br />
Child Medication Use 47.5% (n = 4,038)<br />
Current Medications (n = 1,858)<br />
Abilify 14.4%<br />
Adderall 17.8%<br />
Benzodiazepine 0.2%<br />
Carbamazepine 0.4%<br />
Catapres 6.8%<br />
Celexa 1.9%<br />
Klonopin 2.0%<br />
Concerta 15.7%<br />
Depakote 11.5%<br />
Desyrel 3.1%<br />
Dexedrine 0.9%<br />
Effexor 1.1%<br />
Haldol 0.4%<br />
Lexapro 5.1%<br />
Lamictal 2.4%<br />
Lithium 4.7%<br />
Neurontin 0.4%<br />
Orap 0.1%<br />
Paxil 1.7%<br />
Prozac 7.9%<br />
Risperdal 18.5%<br />
Ritalin 7.5%<br />
Seroquel 14.9%<br />
Stratera 9.8%<br />
Symbiax 0.2%<br />
Tenex 3.8%<br />
Trileptal 4.5%<br />
Wellbutrin 5.6%<br />
Xanax 0.2%<br />
Zoloft 7.0%<br />
Zyprexa 2.7%<br />
Other 21.7%<br />
The Comprehensive Community <strong>Mental</strong> Health Services for Children <strong>and</strong> Their Families Program <strong>Evaluation</strong> <strong>Findings</strong><br />
2006–08 Annual Report to Congress ● Appendix E ● Page 22
Table E-7: Baseline Characteristics: Child History <strong>and</strong> Family Characteristics<br />
for Grant Communities Funded in 2002–2004 (continued)<br />
Grant Communities Funded in 2002–2004<br />
Outcome Sample (n = 4,271)<br />
Child Risk Factors (n = 3,918)<br />
None 44.6%<br />
One or More 55.4%<br />
Physical <strong>Abuse</strong> 21.9% (n = 3,939)<br />
Sexual <strong>Abuse</strong> 15.8% (n = 3,866)<br />
Running Away 28.5% (n = 4,024)<br />
Attempted Suicide 13.6% (n = 4,005)<br />
<strong>Substance</strong> <strong>Abuse</strong> 14.5% (n = 4,000)<br />
Family History of Illness (n = 3,954)<br />
Yes 84.4%<br />
No 15.6%<br />
Depression 68.4% (n = 3,866)<br />
Other <strong>Mental</strong> Illness 44.3% (n = 3,847)<br />
Alcohol or <strong>Substance</strong> <strong>Abuse</strong> 60.9% (n = 3,952)<br />
Recent Caregiver With History of Illnessc (n = 3,903)<br />
Yes 45.0%<br />
No 55.0%<br />
Depression 40.0% (n = 3,941)<br />
Other <strong>Mental</strong> Illness 12.0% (n = 3,953)<br />
Alcohol or <strong>Substance</strong> <strong>Abuse</strong> 7.4% (n = 3,985)<br />
Household Risk Factors<br />
Domestic Violence 46.5% (n = 3,958)<br />
Household Member With Criminal History 33.2% (n = 3,954)<br />
Household Member Depression 64.1% (n = 3,893)<br />
Household Member <strong>Mental</strong> Illness 31.3% (n = 3,894)<br />
Household Member <strong>Substance</strong> <strong>Abuse</strong> 46.5% (n = 3,958)<br />
The Comprehensive Community <strong>Mental</strong> Health Services for Children <strong>and</strong> Their Families Program <strong>Evaluation</strong> <strong>Findings</strong><br />
2006–08 Annual Report to Congress ● Appendix E ● Page 23
Table E-7: Baseline Characteristics: Child History <strong>and</strong> Family Characteristics<br />
for Grant Communities Funded in 2002–2004 (continued)<br />
Grant Communities Funded in 2002–2004<br />
Outcome Sample (n = 4,271)<br />
Child <strong>Substance</strong> Use History d (n = 2,307)<br />
Number of <strong>Substance</strong>s<br />
None 42.5%<br />
One 15.8%<br />
Two 12.8%<br />
Three 11.4%<br />
Four or More 17.5%<br />
<strong>Substance</strong>s e<br />
Alcohol 73.1% (n = 1,325)<br />
Cigarettes 73.4% (n = 1,326)<br />
Chewing Tobacco or Snuff 12.1% (n = 1,326)<br />
Marijuana 63.1% (n = 1,322)<br />
Cocaine 12.8% (n = 1,323)<br />
Hallucinogens 8.5% (n = 1,324)<br />
PCP 2.7% (n = 1,325)<br />
Ketamine 0.6% (n = 1,324)<br />
MDMA (Ecstasy) 9.5% (n = 1,321)<br />
GHB 0.5% (n = 1,322)<br />
Inhalants 10.2% (n = 1,324)<br />
Heroin 2.3% (n = 1,324)<br />
Amphetamines/Stimulants 7.0% (n = 1,319)<br />
Painkillers 15.8% (n = 1,319)<br />
Ritalin, Adderall, Desoxyn 8.7% (n = 1,318)<br />
Tranquilizers 7.0% (n = 1,321)<br />
Barbiturates/Sedatives 2.1% (n = 1,320)<br />
Over-the-Counter/Nonprescription Drugs 9.6% (n = 1,322)<br />
Other 4.4% (n = 1,315)<br />
Child Juvenile Justice Contacts d<br />
Lifetime Contacts (n = 2,304)<br />
None 45.9%<br />
One or More 54.1%<br />
Recent Contact b<br />
Questioned by Police 22.8% (n = 2,291)<br />
Arrested 22.6% (n = 2,296)<br />
Told to Appear in Court 18.8% (n = 2,285)<br />
Convicted of a Crime 10.2% (n = 2,290)<br />
On Probation 23.2% (n = 2,294)<br />
Sentenced to Secure Facility 10.6% (n = 2,287)<br />
a An individual may provide more than one response; therefore, percentages may sum to more than 100%.<br />
b Information pertains to the 6 months prior to intake.<br />
c Caregiver with a history of illness who provided care or supervision in the 6 months prior to intake.<br />
d Drug use history <strong>and</strong> juvenile justice contacts obtained only for children 11 years <strong>and</strong> older.<br />
e Percentages for each substance are based on the number of adolescents who reported any substance use history. Youth may<br />
report using more than one substance; therefore, percentages may sum to more than 100%.<br />
The Comprehensive Community <strong>Mental</strong> Health Services for Children <strong>and</strong> Their Families Program <strong>Evaluation</strong> <strong>Findings</strong><br />
2006–08 Annual Report to Congress ● Appendix E ● Page 24
TableE-8: Baseline Characteristics: Child History <strong>and</strong> Family Characteristics<br />
for Grant Communities Funded in 2005–2006<br />
Grant Communities Funded in 2005–2006<br />
Outcome Sample (n = 1,536)<br />
Custody Status (n = 1,448)<br />
Two Parents 26.7%<br />
Biological Mother Only 50.0%<br />
Biological Father Only 3.5%<br />
Adoptive Parents 5.9%<br />
Sibling(s) 0.1%<br />
Aunt <strong>and</strong>/or Uncle 1.0%<br />
Gr<strong>and</strong>parent(s) 5.7%<br />
Adult Friend 0.1%<br />
Ward of the State 4.5%<br />
Other 2.5%<br />
Living Situation a (n = 1,453)<br />
Biological Parent(s) 77.0%<br />
Adoptive Family 5.9%<br />
Relative(s) 17.1%<br />
Non-Family or Foster Care 9.9%<br />
Independent 1.0%<br />
Primary Caregiver Relationship to Child (n = 1,413)<br />
Biological Parent 80.3%<br />
Adoptive Parent 7.1%<br />
Foster Parent 3.5%<br />
Live-In Partner of Parent 0.3%<br />
Sibling 0.3%<br />
Aunt or Uncle 1.0%<br />
Gr<strong>and</strong>parent 6.5%<br />
Cousin 0.1%<br />
Other Relative 0.1%<br />
Adult Friend 0.2%<br />
Other 0.8%<br />
Primary Caregiver Gender (n = 1,450)<br />
Male 7.5%<br />
Female 92.5%<br />
The Comprehensive Community <strong>Mental</strong> Health Services for Children <strong>and</strong> Their Families Program <strong>Evaluation</strong> <strong>Findings</strong><br />
2006–08 Annual Report to Congress ● Appendix E ● Page 25
Table E-8: Baseline Characteristics: Child History <strong>and</strong> Family Characteristics<br />
for Grant Communities Funded in 2005–2006 (continued)<br />
Grant Communities Funded in 2005–2006<br />
Outcome Sample (n = 1,536)<br />
Primary Caregiver Age in Years (n = 1,423)<br />
Mean (SD) 39.0 (10.1)<br />
16–25 Years 5.6%<br />
26–30 Years 14.7%<br />
31–35 Years 19.5%<br />
36–40 Years 20.3%<br />
41–45 Years 16.5%<br />
46–50 Years 9.4%<br />
51 Years or older 13.9%<br />
Primary Caregiver Race <strong>and</strong> Ethnicity (n = 1,445)<br />
American Indian or Alaska Native Alone 4.8%<br />
Asian Alone 0.8%<br />
Black or African American Alone 22.8%<br />
Native Hawaiian or Other Pacific Isl<strong>and</strong>er Alone 0.6%<br />
White Alone 52.7%<br />
Of Hispanic Origin 15.7%<br />
Multiracial 2.6%<br />
Other, Single Race 0.1%<br />
Primary Caregiver Employed b (n = 1,409)<br />
Yes 57.4%<br />
No 42.6%<br />
Primary Caregiver Paid for Child’s Services b (n = 1,438)<br />
Yes 17.5%<br />
No 82.5%<br />
Family Income (n = 1,400)<br />
Less Than $5,000 13.1%<br />
$5,000–$9,9999 14.5%<br />
$10,000–$14,000 15.2%<br />
$15,000–$19,999 11.6%<br />
$20,000–$24,999 11.4%<br />
$25,000–$34,999 11.4%<br />
$35,000–$49,999 10.6%<br />
$50,000–$74,999 7.9%<br />
$75,000–$99,999 2.4%<br />
$100,000 <strong>and</strong> Over 1.8%<br />
Family Poverty Level (n = 1353)<br />
Below Poverty 56.5%<br />
At Poverty 16.3%<br />
Above Poverty 27.2%<br />
The Comprehensive Community <strong>Mental</strong> Health Services for Children <strong>and</strong> Their Families Program <strong>Evaluation</strong> <strong>Findings</strong><br />
2006–08 Annual Report to Congress ● Appendix E ● Page 26
Table E-8: Baseline Characteristics: Child History <strong>and</strong> Family Characteristics<br />
for Grant Communities Funded in 2005–2006 (continued)<br />
Grant Communities Funded in 2005–2006<br />
Outcome Sample (n = 1,536)<br />
Child Medication Use 47.5% (n = 1,449)<br />
Current Medications (n = 1,299)<br />
Abilify 11.1%<br />
Adderall 20.9%<br />
Benzodiazepine 0.3%<br />
Carbamazepine 0.9%<br />
Catapres 8.6%<br />
Celexa 3.9%<br />
Klonopin 2.5%<br />
Concerta 17.5%<br />
Depakote 10.5%<br />
Desyrel 2.5%<br />
Dexedrine 0.4%<br />
Effexor 1.3%<br />
Haldol 0.1%<br />
Lexapro 4.0%<br />
Lamictal 4.0%<br />
Lithium 3.9%<br />
Neurontin 0.7%<br />
Orap 0.1%<br />
Paxil 0.9%<br />
Prozac 10.1%<br />
Risperdal 20.7%<br />
Ritalin 6.2%<br />
Seroquel 10.5%<br />
Stratera 6.4%<br />
Symbiax 0.0%<br />
Tenex 4.7%<br />
Trileptal 4.9%<br />
Wellbutrin 5.2%<br />
Xanax .6%<br />
Zoloft 5.6%<br />
Zyprexa 1.5%<br />
Other 21.8%<br />
The Comprehensive Community <strong>Mental</strong> Health Services for Children <strong>and</strong> Their Families Program <strong>Evaluation</strong> <strong>Findings</strong><br />
2006–08 Annual Report to Congress ● Appendix E ● Page 27
Table E-8: Baseline Characteristics: Child History <strong>and</strong> Family Characteristics<br />
for Grant Communities Funded in 2005–2006 (continued)<br />
Grant Communities Funded in 2005–2006<br />
Outcome Sample (n = 1,536)<br />
Child Risk Factors (n = 1,355)<br />
None 44.4%<br />
One or More 55.6%<br />
Physical <strong>Abuse</strong> 23.6% (n = 1,377)<br />
Sexual <strong>Abuse</strong> 15.6% (n = 1,337)<br />
Running Away 27.8% (n = 1,448)<br />
Attempted Suicide 9.5%( n = 1,437)<br />
<strong>Substance</strong> <strong>Abuse</strong> 16.6% (n = 1,406)<br />
Family History of Illness (n = 1,424)<br />
Yes 86.3%<br />
No 13.7%<br />
Depression 71.9% (n = 1,396)<br />
Other <strong>Mental</strong> Illness 48.0% (n = 1,380)<br />
Alcohol or <strong>Substance</strong> <strong>Abuse</strong> 63.1% (n = 1,416)<br />
Recent Caregiver With History of Illness c (n = 1,414)<br />
Yes 50.1%<br />
No 49.9%<br />
Depression 44.5% (n = 1,424)<br />
Other <strong>Mental</strong> Illness 15.8% (n = 1,424)<br />
Alcohol or <strong>Substance</strong> <strong>Abuse</strong> 9.3% (n = 1,429)<br />
Household Risk Factors<br />
Domestic Violence 48.1% (n = 1,419)<br />
Household Member With Criminal History 35.8% (n = 1,416)<br />
Household Member Depression 70.0% (n = 1,406)<br />
Household Member <strong>Mental</strong> Illness 36.8% (n = 1,401)<br />
Household Member <strong>Substance</strong> <strong>Abuse</strong> 49.1% (n = 1,421)<br />
The Comprehensive Community <strong>Mental</strong> Health Services for Children <strong>and</strong> Their Families Program <strong>Evaluation</strong> <strong>Findings</strong><br />
2006–08 Annual Report to Congress ● Appendix E ● Page 28
Table E-8: Baseline Characteristics: Child History <strong>and</strong> Family Characteristics<br />
for Grant Communities Funded in 2005–2006 (continued)<br />
Child <strong>Substance</strong> Use History d<br />
Grant Communities Funded in 2005–2006<br />
Outcome Sample (n = 1,536)<br />
Number of <strong>Substance</strong>s (n = 729)<br />
None 35.4%<br />
One 14.8%<br />
Two 14.4%<br />
Three 14.0%<br />
Four or More 21.4%<br />
<strong>Substance</strong>s e<br />
Alcohol 73.2% (n = 470)<br />
Cigarettes 75.5% (n = 470)<br />
Chewing Tobacco or Snuff 13.2% (n = 470)<br />
Marijuana 64.7% (n = 470)<br />
Cocaine 10.4% (n = 471)<br />
Hallucinogens 8.1% (n = 470)<br />
PCP 1.7% (n = 470)<br />
Ketamine 0.4% (n = 471)<br />
MDMA (Ecstasy) 9.6% (n = 471)<br />
GHB 0.0% (n = 471)<br />
Inhalants 11.0% (n = 471)<br />
Heroin 1.9% (n = 471)<br />
Amphetamines/Stimulants 5.5% (n = 470)<br />
Painkillers 18.9% (n = 470)<br />
Ritalin, Adderall, Desoxyn 14.6% (n = 471)<br />
Tranquilizers 6.2% (n = 470)<br />
Barbiturates/Sedatives 1.9% (n = 471)<br />
Over-the-Counter/Nonprescription Drugs 11.0% (n = 471)<br />
Other 5.7% (n = 471)<br />
Child Juvenile Justice Contacts d<br />
Lifetime Contacts (n = 732)<br />
None 39.9%<br />
One or More 60.1%<br />
Recent Contact b<br />
Questioned by Police 27.3% (n = 729)<br />
Arrested 20.4% (n = 730)<br />
Told to Appear in Court 25.4% (n = 727)<br />
Convicted of a Crime 15.2% (n = 732)<br />
On Probation 31.1% (n = 731)<br />
Sentenced to Secure Facility 13.9% (n = 728)<br />
a<br />
An individual may provide more than one response; therefore, percentages may sum to more than 100%.<br />
b<br />
Information pertains to the 6 months prior to intake.<br />
c<br />
Caregiver with a history of illness who provided care or supervision in the 6 months prior to intake.<br />
d<br />
Drug use history <strong>and</strong> juvenile justice contacts obtained only for children 11 years <strong>and</strong> older.<br />
e Percentages for each substance are based on the number of adolescents who reported any substance use history. Youth may<br />
report using more than one substance; therefore, percentages may sum to more than 100%.<br />
The Comprehensive Community <strong>Mental</strong> Health Services for Children <strong>and</strong> Their Families Program <strong>Evaluation</strong> <strong>Findings</strong><br />
2006–08 Annual Report to Congress ● Appendix E ● Page 29
2006–08 Annual Report to Congress ● Appendix E ● Page 30<br />
The Comprehensive Community <strong>Mental</strong> Health Services for Children <strong>and</strong> Their Families Program <strong>Evaluation</strong> <strong>Findings</strong><br />
Table E-9: Child <strong>and</strong> Family Outcomes at Intake, 6 Months, 12 Months, 18 Months, 24 Months, <strong>and</strong> 30 Months for Grant Communities<br />
Funded in 1999–2000<br />
Child Behavior Checklist (CBCL)<br />
Grant Communities Funded in 1999–2000<br />
Intake<br />
Mean (SD)<br />
Activities Competence 40.5 (7.6)<br />
(n = 3,029)<br />
Social Competence 38.1 (8.9)<br />
(n = 3,073)<br />
School Competence 35.2 (8.6)<br />
(n = 3,117)<br />
Internalizing Problems 64.4 (11.5)<br />
(n = 3,654)<br />
Externalizing Problems 69.0 (10.8)<br />
(n = 3,654)<br />
Total Problems 70.0 (10.5)<br />
(n = 3,643)<br />
Clinical Range (CBCL)<br />
Intake<br />
%<br />
6 Months<br />
Mean (SD)<br />
39.9 (7.6)<br />
(n = 2,009)<br />
38.5 (8.9)<br />
(n = 2,062)<br />
36.6 (8.7)<br />
(n = 2,069)<br />
61.9 (12.0)<br />
(n = 2,364)<br />
66.3 (11.4)<br />
(n = 2,364)<br />
67.2 (11.5)<br />
(n = 2,354)<br />
6 Months<br />
%<br />
12 Months<br />
Mean (SD)<br />
40.0 (7.7)<br />
(n = 1,550)<br />
38.7 (8.8)<br />
(n = 1,614)<br />
37.1 (8.6)<br />
(n = 1,607)<br />
60.8 (12.3)<br />
(n = 1,832)<br />
65.5 (11.5)<br />
(n = 1,832)<br />
66.2 (11.7)<br />
(n = 1,827)<br />
12 Months<br />
%<br />
18 Months<br />
Mean (SD)<br />
39.8 (7.7)<br />
(n = 1,133)<br />
38.8 (8.8)<br />
(n = 1,146)<br />
37.5 (8.9)<br />
(n = 1,131)<br />
60.3 (12.3)<br />
(n = 1,293)<br />
64.9 (11.5)<br />
(n = 1,293)<br />
65.7 (11.8)<br />
(n = 1,282)<br />
18 Months<br />
%<br />
24 Months<br />
Mean (SD)<br />
40.1 (7.5)<br />
(n = 858)<br />
39.2 (8.7)<br />
(n = 873)<br />
37.6 (8.9)<br />
(n = 878)<br />
59.7 (12.4)<br />
(n = 994)<br />
64.2 (11.8)<br />
(n = 994)<br />
64.9 (12.0)<br />
(n = 986)<br />
24 Months<br />
%<br />
30 Months<br />
Mean (SD)<br />
40.1 (7.7)<br />
(n = 574)<br />
38.5 (8.9)<br />
(n = 583)<br />
37.4 (8.8)<br />
(n = 582)<br />
59.6 (12.4)<br />
(n = 657)<br />
64.3 (11.7)<br />
(n = 657)<br />
64.9 (11.9)<br />
(n = 654)<br />
30 Months<br />
%<br />
Internalizing Problems (n = 3,654) (n = 2,350) (n = 1,825) (n = 1,286) (n = 991) (n = 655)<br />
Normal 32.5% 38.6% 42.5% 44.5% 47.6% 47.6%<br />
Borderline 10.9% 13.3% 12.3% 12.9% 12.5% 9.0%<br />
Clinical 56.6% 48.1% 45.2% 42.6% 39.9% 43.4%<br />
Externalizing Problems (n = 3,654) (n = 2,350) (n = 1,825) (n = 1,286) (n = 991) (n = 655)<br />
Normal 19.3% 26.0% 29.2% 30.7% 32.6% 34.8%<br />
Borderline 8.7% 9.3% 9.6% 9.9% 10.3% 9.9%<br />
Clinical 72.0% 64.6% 61.2% 59.4% 57.1% 55.3%<br />
Total Problems (n = 3,643) (n = 2,340) (n = 1,820) (n = 1,276) (n = 983) (n = 652)<br />
Normal 15.7% 21.9% 25.7% 26.6% 28.2% 28.2%<br />
Borderline 7.0% 10.0% 10.0% 10.0% 9.9% 10.4%<br />
Clinical 77.3% 68.1% 64.3% 63.4% 62.0% 61.3%
2006–08 Annual Report to Congress ● Appendix E ● Page 31<br />
The Comprehensive Community <strong>Mental</strong> Health Services for Children <strong>and</strong> Their Families Program <strong>Evaluation</strong> <strong>Findings</strong><br />
Table E-9: Child <strong>and</strong> Family Outcomes at Intake, 6 Months, 12 Months, 18 Months, 24 Months, <strong>and</strong> 30 Months for Grant Communities<br />
Funded in 1999–2000 (continued)<br />
Child <strong>and</strong> Adolescent Functional Assessment Scale<br />
(CAFAS)<br />
Grant Communities Funded in 1999–2000<br />
Intake<br />
Mean (SD)<br />
Mean Total Scale Score 116.8 (48.7)<br />
(n = 3,410)<br />
Home Rolea 74.2%<br />
(n = 3,412)<br />
School Role 81.5%<br />
(n = 3,399)<br />
Community Role 38.6%<br />
(n = 3,412)<br />
Behavior Toward Others 77.3%<br />
(n = 3,412)<br />
Mood <strong>and</strong> Emotions 73.3%<br />
(n = 3,412)<br />
Harmful Behavior 30.7%<br />
(n = 3,414)<br />
<strong>Substance</strong> <strong>Abuse</strong> 8.9%<br />
(n = 3,392)<br />
Thinking 30.5%<br />
(n = 3,411)<br />
6 Months<br />
Mean (SD)<br />
100.7 (50.5)<br />
(n = 2,241)<br />
66.2%<br />
(n = 2,243)<br />
72.2%<br />
(n = 2,252)<br />
27.8%<br />
(n = 2,245)<br />
69.4%<br />
(n = 2,247)<br />
66.0%<br />
(n = 2,245)<br />
21.6%<br />
(n = 2,245)<br />
6.5%<br />
(n = 2,237)<br />
26.3%<br />
(n = 2,246)<br />
12 Months<br />
Mean (SD)<br />
97.1 (51.1)<br />
(n = 1,730)<br />
64.0%<br />
(n = 1,730)<br />
72.8%<br />
(n = 1,751)<br />
24.5%<br />
(n = 1,733)<br />
67.5%<br />
(n = 1,734)<br />
64.4%<br />
(n = 1,732)<br />
18.6%<br />
(n = 1,736)<br />
6.2%<br />
(n = 1,732)<br />
23.1%<br />
(n = 1,735)<br />
a For Home Role to Thinking scales, the percentages represented those with moderate or severe level of functional impairment.<br />
18 Months<br />
Mean (SD)<br />
92.2 (51.1)<br />
(n = 1,243)<br />
58.9%<br />
(n = 1,242)<br />
68.3%<br />
(n = 1,263)<br />
22.2%<br />
(n = 1,245)<br />
63.8%<br />
(n = 1,246)<br />
61.4%<br />
(n = 1,247)<br />
16.9%<br />
(n = 1,247)<br />
5.6%<br />
(n = 1,242)<br />
23.3%<br />
(n = 1,247)<br />
24 Months<br />
Mean (SD)<br />
97.1 (51.6)<br />
(n = 956)<br />
60.2%<br />
(n = 955)<br />
66.5%<br />
(n = 983)<br />
22.1%<br />
(n = 956)<br />
63.9%<br />
(n = 956)<br />
60.1%<br />
(n = 956)<br />
15.0%<br />
(n = 955)<br />
6.5%<br />
(n = 954)<br />
24.3%<br />
(n = 955)<br />
30 Months<br />
Mean (SD)<br />
85.3 (51.2)<br />
(n = 625)<br />
57.0%<br />
(n = 625)<br />
64.3%<br />
(n = 664)<br />
17.8%<br />
(n = 629)<br />
58.1%<br />
(n = 630)<br />
57.9%<br />
(n = 630)<br />
13.2%<br />
(n = 629)<br />
4.8%<br />
(n = 628)<br />
20.8%<br />
(n = 629)
2006–08 Annual Report to Congress ● Appendix E ● Page 32<br />
The Comprehensive Community <strong>Mental</strong> Health Services for Children <strong>and</strong> Their Families Program <strong>Evaluation</strong> <strong>Findings</strong><br />
Table E-9: Child <strong>and</strong> Family Outcomes at Intake, 6 Months, 12 Months, 18 Months, 24 Months, <strong>and</strong> 30 Months for Grant Communities<br />
Funded in 1999–2000 (continued)<br />
Behavioral <strong>and</strong> Emotional Rating Scale (BERS)<br />
Grant Communities Funded in 1999–2000<br />
Intake<br />
Mean (SD)<br />
Intrapersonal Strengths 8.7 (3.2)<br />
(n = 3,626)<br />
Interpersonal Strengths 7.4 (2.9)<br />
(n = 3,630)<br />
School Functioning 7.5 (2.9)<br />
(n = 3,341)<br />
Family Involvement 8.6 (2.9)<br />
(n = 3,570)<br />
Affective Strengths 9.7 (3.5)<br />
(n = 3,631)<br />
Strengths Quotient 87.6 (17.6)<br />
(n = 3,645)<br />
Family Functioning Scale (FAD)–Caregiver<br />
General Functioning b 2.9 (0.5)<br />
(n = 3,544)<br />
Family Functioning Scale (FAD)–Youth<br />
General Functioning b 2.7 (0.4)<br />
(n = 2,320)<br />
6 Months<br />
Mean (SD)<br />
9.0 (3.1)<br />
(n = 2,353)<br />
7.8 (2.8)<br />
(n = 2,356)<br />
8.1 (2.9)<br />
(n = 2,163)<br />
8.9 (2.9)<br />
(n = 2,308)<br />
10.0 (3.4)<br />
(n = 2,358)<br />
90.1 (17.7)<br />
(n = 2,362)<br />
2.9 (0.5)<br />
(n = 2,282)<br />
2.8 (0.4)<br />
(n = 1,512)<br />
b<br />
Only the General Functioning Subscale items were collected for grant communities initially funded in 1999–2000.<br />
12 Months<br />
Mean (SD)<br />
9.1 (3.1)<br />
(n = 1,842)<br />
8.0 (2.8)<br />
(n = 1,847)<br />
8.2 (2.9)<br />
(n = 1,709)<br />
9.0 (2.8)<br />
(n = 1,815)<br />
10.0 (3.4)<br />
(n = 1,853)<br />
90.7 (17.5)<br />
(n = 1,854)<br />
3.0 (0.5)<br />
(n = 1,782)<br />
2.8 (0.4)<br />
(n = 1,1198)<br />
18 Months<br />
Mean (SD)<br />
9.2 (3.1)<br />
(n = 1,299)<br />
8.0 (2.9)<br />
(n = 1,298)<br />
8.2 (2.9)<br />
(n = 1,203)<br />
9.0 (2.8)<br />
(n = 1,278)<br />
10.0 (3.4)<br />
(n = 1,295)<br />
91.1 (17.7)<br />
(n = 1,300)<br />
3.0 (0.5)<br />
(n = 1,263)<br />
2.8 (0.4)<br />
(n = 886)<br />
24 Months<br />
Mean (SD)<br />
9.2 (3.1)<br />
(n = 1,003)<br />
8.1 (2.8)<br />
(n = 1,004)<br />
8.2 (2.8)<br />
(n = 927)<br />
9.1 (2.9)<br />
(n = 995)<br />
10.1 (3.4)<br />
(n = 1,003)<br />
91.4 (17.5)<br />
(n = 1,007)<br />
3.0 (0.5)<br />
(n = 983)<br />
2.9 (0.4)<br />
(n = 721)<br />
30 Months<br />
Mean (SD)<br />
9.3 (3.1)<br />
(n = 678)<br />
8.1 (2.9)<br />
(n = 679)<br />
8.1 (2.8)<br />
(n = 617)<br />
9.1 (2.9)<br />
(n = 672)<br />
10.1 (3.3)<br />
(n = 679)<br />
91.5 (17.2)<br />
(n = 679)<br />
3.0 (0.5)<br />
(n = 670)<br />
2.8 (0.4)<br />
(n = 505)
2006–08 Annual Report to Congress ● Appendix E ● Page 33<br />
The Comprehensive Community <strong>Mental</strong> Health Services for Children <strong>and</strong> Their Families Program <strong>Evaluation</strong> <strong>Findings</strong><br />
Table E-9: Child <strong>and</strong> Family Outcomes at Intake, 6 Months, 12 Months, 18 Months, 24 Months, <strong>and</strong> 30 Months for Grant Communities<br />
Funded in 1999–2000 (continued)<br />
Caregiver Strain Questionnaire (CGSQ)<br />
Grant Communities Funded in 1999–2000<br />
Intake<br />
Mean (SD)<br />
Subjective Externalizing Strain 2.4 (1.0)<br />
(n = 3,507)<br />
Subjective Internalizing Strain 3.7 (1.0)<br />
(n = 3,521)<br />
Objective Strain 2.8 (1.1)<br />
(n = 3,515)<br />
Global Strain 3.0 (0.9)<br />
(n = 3,508)<br />
Family Resource Scale (FRS)<br />
Basic Needs 4.3 (0.7)<br />
(n = 3,541)<br />
Quality of Life 4.0 (0.9)<br />
(n = 3,210)<br />
Cash <strong>and</strong> Recreation 2.8 (1.1)<br />
(n = 3,497)<br />
Time 3.2 (0.9)<br />
(n = 3,549)<br />
Health <strong>and</strong> Social Services 3.9 (1.1)<br />
(n = 2,979)<br />
Childcare 2.5 (1.5)<br />
(n = 2,254)<br />
6 Months<br />
Mean (SD)<br />
2.2 (1.0)<br />
(n = 2,271)<br />
3.4 (1.1)<br />
(n = 2,273)<br />
2.5 (1.1)<br />
(n = 2,272)<br />
2.7 (0.9)<br />
(n = 2,265)<br />
4.3 (0.7)<br />
(n = 2,289)<br />
4.1 (0.9)<br />
(n = 2,037)<br />
2.9 (1.0)<br />
(n = 2,259)<br />
3.3 (0.9)<br />
(n = 2,280)<br />
3.9 (1.1)<br />
(n = 1,929)<br />
2.6 (1.5)<br />
(n = 1,348)<br />
12 Months<br />
Mean (SD)<br />
2.1 (0.9)<br />
(n = 1,773)<br />
3.2 (1.1)<br />
(n = 1,776)<br />
2.4 (1.0)<br />
(n = 1,772)<br />
2.6 (0.9)<br />
(n = 1,772)<br />
4.3 (0.7)<br />
(n = 1,783)<br />
4.1 (0.9)<br />
(n = 1,588)<br />
2.9 (1.0)<br />
(n = 1,758)<br />
3.3 (0.9)<br />
(n = 1,790)<br />
4.0 (1.0)<br />
(n = 1,510)<br />
2.5 (1.4)<br />
(n = 1,028)<br />
18 Months<br />
Mean (SD)<br />
2.0 (0.9)<br />
(n = 1,260)<br />
3.1 (1.1)<br />
(n = 1,262)<br />
2.3 (1.1)<br />
(n = 1,257)<br />
2.5 (0.9)<br />
(n = 1,258)<br />
4.4 (0.7)<br />
(n = 1,268)<br />
4.1 (0.9)<br />
(n = 1,110)<br />
2.9 (1.0)<br />
(n = 1,249)<br />
3.3 (0.9)<br />
(n = 1,260)<br />
3.9 (1.0)<br />
(n = 1,057)<br />
2.6 (1.5)<br />
(n = 695)<br />
24 Months<br />
Mean (SD)<br />
2.0 (0.9)<br />
(n = 985)<br />
3.0 (1.1)<br />
(n = 985)<br />
2.2 (1.0)<br />
(n = 984)<br />
2.4 (0.9)<br />
(n = 983)<br />
4.4 (0.7)<br />
(n = 996)<br />
4.1 (0.9)<br />
(n = 882)<br />
3.0 (1.0)<br />
(n = 974)<br />
3.4 (0.9)<br />
(n = 990)<br />
4.0 (1.1)<br />
(n = 848)<br />
2.6 (1.5)<br />
(n = 498)<br />
30 Months<br />
Mean (SD)<br />
2.0 (0.9)<br />
(n = 663)<br />
3.0 (1.1)<br />
(n = 664)<br />
2.2 (1.0)<br />
(n = 665)<br />
2.4 (0.9)<br />
(n = 663)<br />
4.4 (0.7)<br />
(n = 676)<br />
4.1 (0.9)<br />
(n = 603)<br />
2.9 (1.0)<br />
(n = 668)<br />
3.4 (0.9)<br />
(n = 672)<br />
3.9 (1.1)<br />
(n = 575)<br />
2.7 (1.4)<br />
(n = 340)
2006–08 Annual Report to Congress ● Appendix E ● Page 34<br />
The Comprehensive Community <strong>Mental</strong> Health Services for Children <strong>and</strong> Their Families Program <strong>Evaluation</strong> <strong>Findings</strong><br />
Table E-9: Child <strong>and</strong> Family Outcomes at Intake, 6 Months, 12 Months, 18 Months, 24 Months, <strong>and</strong> 30 Months for Grant Communities<br />
Funded in 1999–2000 (continued)<br />
Restrictiveness of Living Environments <strong>and</strong> Placement<br />
Stability Scale–Revised Version (ROLES–R)<br />
Grant Communities Funded in 1999–2000<br />
Intake<br />
%<br />
6 Months<br />
%<br />
12 Months<br />
%<br />
18 Months<br />
%<br />
24 Months<br />
%<br />
30 Months<br />
%<br />
Living Arrangement (n = 3,704) (n = 2,416) (n = 1,895) (n = 1,333) (n = 1,046) (n = 710)<br />
No Place to Stay 0.1% 0.1% 0.1% 0.2% 0.0% 0.1%<br />
Independent Living by Self 0.1% 0.3% 0.4% 0.5% 0.6% 1.1%<br />
Independent Living with Partner–Friend 0.1% 0.3% 0.5% 0.7% 1.1% 1.3%<br />
Two Parents/Caregivers, At Least One Biological Parent 29.4% 27.9% 27.9% 27.3% 24.8% 26.2%<br />
Biological Mother Only 33.6% 33.5% 33.5% 32.2% 33.7% 33.1%<br />
Biological Father Only 2.5% 2.4% 2.3% 2.6% 2.2% 3.0%<br />
Split Parenting 0.3% 0.2% 0.3% 0.3% 0.4% 0.3%<br />
School Dormitory 0.1% 0.1% 0.2% 0.2% 0.1% 0.1%<br />
Home of a Relative 10.7% 11.3% 10.5% 11.2% 11.8% 11.4%<br />
Adoptive Home 5.1% 5.8% 5.9% 6.2% 5.7% 5.6%<br />
Home of a Friend 0.4% 0.4% 0.4% 0.5% 0.3% 0.1%<br />
Camp 0.0% 0.0% 0.1% 0.2% 0.1% 0.0%<br />
Supervised Independent Living 0.2% 0.2% 0.4% 0.5% 0.3% 0.4%<br />
Foster Care 3.2% 2.6% 2.2% 2.1% 2.2% 1.7%<br />
Specialized Foster Care 0.2% 0.2% 0.2% 0.2% 0.4% 0.6%<br />
Therapeutic Foster Care 1.3% 2.0% 1.9% 1.6% 1.9% 1.4%<br />
Individual Home Emergency Shelter 0.2% 0.0% 0.1% 0.0% 0.0% 0.0%<br />
Group Emergency Shelter 0.6% 0.2% 0.1% 0.2% 0.1% 0.0%<br />
Group Home 2.6% 3.1% 2.9% 2.8% 2.7% 2.5%<br />
Residential Job Corp–Vocational Center 0.0% 0.0% 0.0% 0.2% 0.2% 0.1%<br />
Residential Treatment Center (non drug-alcohol) 4.3% 4.9% 5.8% 5.3% 5.6% 6.1%<br />
Drug-Alcohol Residential Treatment Center 0.5% 0.5% 0.3% 0.2% 0.1% 0.1%<br />
Medical Hospital (non-psychiatric) 0.1% 0.0% 0.0% 0.1% 0.1% 0.0%<br />
Psychiatric Hospital 2.0% 1.2% 0.9% 0.9% 1.3% 1.1%<br />
Juvenile Detention Center 1.5% 1.5% 2.0% 3.2% 2.3% 1.5%<br />
Jail/Prison 0.0% 0.3% 0.4% 0.4% 1.2% 1.5%<br />
Other 0.9% 0.7% 0.7% 0.6% 1.0% 0.4%
2006–08 Annual Report to Congress ● Appendix E ● Page 35<br />
The Comprehensive Community <strong>Mental</strong> Health Services for Children <strong>and</strong> Their Families Program <strong>Evaluation</strong> <strong>Findings</strong><br />
Table E-9: Child <strong>and</strong> Family Outcomes at Intake, 6 Months, 12 Months, 18 Months, 24 Months, <strong>and</strong> 30 Months for Grant Communities<br />
Funded in 1999–2000 (continued)<br />
Restrictiveness of Living Environments <strong>and</strong> Placement<br />
Stability Scale–Revised Version (ROLES–R)<br />
Children With One or More Living Arrangements in Past 6<br />
Months<br />
Grant Communities Funded in 1999–2000<br />
Intake<br />
%<br />
6 Months<br />
%<br />
12 Months<br />
%<br />
18 Months<br />
%<br />
24 Months<br />
%<br />
30 Months<br />
%<br />
(n = 3,708) (n = 2,418) (n = 1,898) (n = 1,333) (n = 1,047) (n = 710)<br />
One 56.4% 68.0% 71.7% 72.2% 75.6% 76.5%<br />
Two or More 43.6% 32.0% 28.3% 27.8% 24.4% 23.5%<br />
Education Questionnaire (EQ)<br />
School Performance Last 6 Months (n = 3,482) (n = 2,240) (n = 1,726) (n = 1,211) (n = 925) (n = 621)<br />
Grade Average A 6.4% 8.7% 8.7% 9.4% 10.1% 10.0%<br />
Grade Average B 22.6% 27.6% 29.3% 28.2% 29.0% 31.6%<br />
Grade Average C 29.0% 31.3% 32.2% 32.4% 32.8% 31.6%<br />
Grade Average D 9.3% 8.4% 7.9% 8.2% 9.2% 7.9%<br />
Failing All or Most Classes 20.4% 14.6% 12.2% 12.0% 10.3% 10.6%<br />
School Does Not Grade 9.7% 7.9% 8.2% 9.0% 8.0% 7.6%<br />
Other 2.5% 1.5% 1.5% 0.9% 0.8% 0.8%<br />
Caregiver Perception: Do Child’s Grades Match Ability or<br />
Could Child Do Better<br />
(n = 3,453) (n = 2,231) (n = 1,727) (n = 1,216) (n = 929) (n = 615)<br />
Matches Ability 24.7% 30.6% 32.5% 32.6% 30.6% 34.3%<br />
Could Do Better 75.3% 69.4% 67.5% 67.4% 69.4% 65.7%<br />
Child Had Individualized Education Plan in Last 6 Months (n = 3,482) (n = 2,259) (n = 1,737) (n = 1,211) (n = 928) (n = 621)<br />
Had IEP 63.3% 68.5% 72.3% 72.7% 75.0% 76.0%<br />
Did Not Have IEP 36.7% 31.5% 27.7% 27.3% 25.0% 24.0%
2006–08 Annual Report to Congress ● Appendix E ● Page 36<br />
The Comprehensive Community <strong>Mental</strong> Health Services for Children <strong>and</strong> Their Families Program <strong>Evaluation</strong> <strong>Findings</strong><br />
Table E-9: Child <strong>and</strong> Family Outcomes at Intake, 6 Months, 12 Months, 18 Months, 24 Months, <strong>and</strong> 30 Months for Grant Communities<br />
Funded in 1999–2000 (continued)<br />
Education Questionnaire (EQ)<br />
Grant Communities Funded in 1999–2000<br />
Intake<br />
%<br />
6 Months<br />
%<br />
12 Months<br />
%<br />
18 Months<br />
%<br />
24 Months<br />
%<br />
30 Months<br />
%<br />
Reasons for IEP (n = 2,130) (n = 1,485) (n = 1,214) (n = 860) (n = 675) (n = 461)<br />
Behavioral/Emotional Problems 85.8% 87.5% 87.7% 86.9% 86.2% 89.2%<br />
Learning Disability 58.8% 58.0% 57.9% 54.0% 54.1% 51.8%<br />
Physical Disability 3.9% 3.8% 3.7% 3.1% 3.6% 3.3%<br />
Developmental Disability/<strong>Mental</strong> Retardation 12.9% 13.0% 13.9% 13.3% 13.6% 13.2%<br />
Vision or Hearing Impairment 4.2% 3.4% 3.5% 3.4% 4.1% 3.7%<br />
Speech Impairment 11.4% 10.4% 8.4% 7.3% 8.4% 7.2%<br />
Other Reason 0.8% 0.5% 0.4% 0.5% 0.3% 0.9%<br />
School Attendance in Last 6 Months (n = 2,849) (n = 1,667) (n = 1,274) (n = 833) (n = 652) (n = 423)<br />
Attended Regularly 67.3% 74.3% 74.8% 76.5% 77.3% 76.1%<br />
Attended More Often Than Not 18.8% 16.1% 16.8% 15.5% 15.2% 17.0%<br />
Attended Infrequently 14.0% 9.6% 8.4% 8.0% 7.5% 6.9%<br />
Special Education<br />
Child Took Classes Where Everyone Attending Was in Special<br />
Education<br />
Child Took Classes Where Some Attending Were in Special<br />
Education, Others Not<br />
46.9%<br />
(n = 3,486)<br />
30.1%<br />
(n = 3,421)<br />
50.3%<br />
(n = 2,238)<br />
30.6%<br />
(n = 2,209)<br />
51.5%<br />
(n = 1,734)<br />
29.1%<br />
(n = 1,706)<br />
50.9%<br />
(n = 1,213)<br />
32.4%<br />
(n = 1,193)<br />
52.8%<br />
(n = 935)<br />
34.5%<br />
(n = 922)<br />
54.8%<br />
(n = 619)<br />
33.1%<br />
(n = 614)<br />
Percent of Day Spent in Special Education Classes (n = 3,194) (n = 2,075) (n = 1,591) (n = 1,101) (n = 864) (n = 554)<br />
0–25% 47.2% 44.7% 42.7% 44.7% 39.9% 39.4%<br />
26–50% 8.6% 7.3% 7.8% 8.5% 9.5% 9.0%<br />
51–75% 7.5% 8.0% 8.0% 7.6% 9.4% 8.7%<br />
76–100% 34.7% 38.1% 40.2% 37.5% 39.6% 42.4%<br />
Other 2.1% 2.0% 1.3% 1.6% 1.6% 0.5%
2006–08 Annual Report to Congress ● Appendix E ● Page 37<br />
The Comprehensive Community <strong>Mental</strong> Health Services for Children <strong>and</strong> Their Families Program <strong>Evaluation</strong> <strong>Findings</strong><br />
Table E-9: Child <strong>and</strong> Family Outcomes at Intake, 6 Months, 12 Months, 18 Months, 24 Months, <strong>and</strong> 30 Months for Grant Communities<br />
Funded in 1999–2000 (continued)<br />
Education Questionnaire (EQ)<br />
Grant Communities Funded in 1999–2000<br />
Intake<br />
%<br />
6 Months<br />
%<br />
12 Months<br />
%<br />
18 Months<br />
%<br />
24 Months<br />
%<br />
30 Months<br />
%<br />
School Performance Last 6 Months: Grades 1 Through 6 (n = 1,425) (n = 848) (n = 627) (n = 409) (n = 301) (n = 191)<br />
Grade Average A 6.3% 9.4% 9.9% 12.5% 11.3% 11.5%<br />
Grade Average B 24.1% 30.8% 30.5% 26.7% 29.6% 33.5%<br />
Grade Average C 28.1% 30.3% 29.8% 26.9% 27.9% 28.8%<br />
Grade Average D 8.9% 6.6% 5.6% 6.4% 10.6% 6.3%<br />
Failing All or Most Classes 16.7% 9.6% 8.5% 10.8% 4.3% 7.3%<br />
School Does Not Grade 13.1% 12.3% 13.2% 15.9% 15.0% 11.5%<br />
Other 2.7% 1.1% 2.6% 1.0% 1.3% 1.0%<br />
School Performance Last 6 Months: Grades 7 <strong>and</strong> 8 (n = 825) (n = 553) (n = 416) (n = 303) (n = 208) (n = 141)<br />
Grade Average A 5.9% 8.5% 8.4% 8.3% 7.2% 5.0%<br />
Grade Average B 21.7% 28.2% 31.0% 32.7% 24.5% 30.5%<br />
Grade Average C 33.9% 32.5% 34.1% 38.9% 39.4% 41.1%<br />
Grade Average D 10.8% 9.8% 9.1% 6.3% 9.6% 9.9%<br />
Failing All or Most Classes 24.0% 16.5% 12.3% 8.9% 13.5% 9.9%<br />
School Does Not Grade 2.5% 3.6% 3.6% 4.3% 5.8% 2.8%<br />
Other 1.1% 0.9% 1.4% 0.7% 0.0% 0.7%<br />
School Performance Last 6 Months: Grades 9 Through 12 (n = 899) (n = 656) (n = 555) (n = 412) (n = 358) (n = 257)<br />
Grade Average A 7.5% 8.2% 8.1% 8.5% 9.8% 11.7%<br />
Grade Average B 24.6% 26.4% 29.0% 26.7% 31.6% 32.7%<br />
Grade Average C 29.1% 34.1% 35.0% 34.7% 33.2% 28.0%<br />
Grade Average D 10.3% 9.9% 9.5% 11.4% 8.7% 8.6%<br />
Failing All or Most Classes 23.5% 17.5% 14.4% 13.8% 13.7% 12.5%<br />
School Does Not Grade 3.4% 2.6% 3.6% 4.4% 2.8% 5.8%<br />
Other 1.6% 1.2% 0.4% 0.5% 0.3% 0.8%
2006–08 Annual Report to Congress ● Appendix E ● Page 38<br />
The Comprehensive Community <strong>Mental</strong> Health Services for Children <strong>and</strong> Their Families Program <strong>Evaluation</strong> <strong>Findings</strong><br />
Table E-9: Child <strong>and</strong> Family Outcomes at Intake, 6 Months, 12 Months, 18 Months, 24 Months, <strong>and</strong> 30 Months for Grant Communities<br />
Funded in 1999–2000 (continued)<br />
Education Questionnaire (EQ)<br />
Grant Communities Funded in 1999–2000<br />
Intake<br />
%<br />
6 Months<br />
%<br />
12 Months<br />
%<br />
18 Months<br />
%<br />
24 Months<br />
%<br />
30 Months<br />
%<br />
Type of Educational Placement c (n = 3,569) (n = 2,294) (n = 1,766) (n = 1,238) (n = 946) (n = 628)<br />
Regular Public Day School 75.7% 72.1% 70.8% 69.5% 70.5% 69.7%<br />
Regular Private or Boarding School 1.4% 1.0% 1.4% 1.3% 1.1% 1.1%<br />
Home Schooling 1.3% 1.0% 0.7% 0.8% 0.7% 0.2%<br />
Home-Based Instruction 1.9% 1.2% 0.9% 1.2% 0.6% 1.1%<br />
Combination Home Schooling/Home-Based Instruction 0.3% 0.5% 0.5% 0.2% 0.3% 0.2%<br />
Alternative/Special Day School 23.9% 24.1% 24.0% 23.9% 21.1% 25.0%<br />
School in 24-Hour Hospital Setting 5.9% 3.4% 2.6% 2.9% 2.4% 2.1%<br />
School in 24-Hour Juvenile Justice Facility 4.2% 2.7% 3.3% 4.1% 4.7% 4.0%<br />
School in 24-Hour Residential Treatment Center 5.9% 6.4% 5.4% 5.4% 5.3% 5.3%<br />
Other 2.4% 2.4% 2.7% 2.4% 2.5% 2.5%<br />
Disciplinary Actions in Past 6 Months<br />
Detention 33.6%<br />
(n = 3,474)<br />
Suspension 45.8%<br />
(n = 3,520)<br />
Expulsion 7.3%<br />
(n = 3,532)<br />
27.9%<br />
(n = 2,161)<br />
36.6%<br />
(n = 2,179)<br />
4.1%<br />
(n = 2,184)<br />
25.7%<br />
(n = 1,667)<br />
36.4%<br />
(n = 1,682)<br />
3.9%<br />
(n = 1,676)<br />
23.6%<br />
(n = 1,166)<br />
32.6%<br />
(n = 1,179)<br />
3.0%<br />
(n = 1,176)<br />
c Because an individual may have more than one educational placement, the educational placement variable may add to more than 100%.<br />
23.6%<br />
(n = 903)<br />
30.9%<br />
(n = 909)<br />
2.4%<br />
(n = 911)<br />
21.6%<br />
(n = 601)<br />
29.3%<br />
(n = 608)<br />
2.6%<br />
(n = 607)
2006–08 Annual Report to Congress ● Appendix E ● Page 39<br />
The Comprehensive Community <strong>Mental</strong> Health Services for Children <strong>and</strong> Their Families Program <strong>Evaluation</strong> <strong>Findings</strong><br />
Table E-9: Child <strong>and</strong> Family Outcomes at Intake, 6 Months, 12 Months, 18 Months, 24 Months, <strong>and</strong> 30 Months for Grant Communities<br />
Funded in 1999–2000 (continued)<br />
Delinquency Survey (DS)<br />
Juvenile Delinquency in Past 6 Months<br />
Grant Communities Funded in 1999–2000<br />
Intake<br />
%<br />
Accused of Breaking the Law 24.7%<br />
(n = 2,328)<br />
Arrested 23.2%<br />
(n = 2,347)<br />
Convicted of a Crime 13.7%<br />
(n = 2,345)<br />
On Probation 29.8%<br />
(n = 2,350)<br />
In Detention Center/Jail 21.1%<br />
(n = 2,310)<br />
6 Months<br />
%<br />
17.5%<br />
(n = 1,436)<br />
15.1%<br />
(n = 1,444)<br />
10.0%<br />
(n = 1,435)<br />
30.0%<br />
(n = 1,448)<br />
14.3%<br />
(n = 1,420)<br />
12 Months<br />
%<br />
15.4%<br />
(n = 1,074)<br />
14.0%<br />
(n = 1,078)<br />
8.2%<br />
(n = 1,079)<br />
23.4%<br />
(n = 1,085)<br />
12.0%<br />
(n = 1,072)<br />
18 Months<br />
%<br />
14.7%<br />
(n = 750)<br />
13.2%<br />
(n = 756)<br />
7.3%<br />
(n = 751)<br />
22.3%<br />
(n = 753)<br />
9.7%<br />
(n = 749)<br />
24 Months<br />
%<br />
14.8%<br />
(n = 587)<br />
12.0%<br />
(n = 592)<br />
5.9%<br />
(n = 592)<br />
20.9%<br />
(n = 593)<br />
11.3%<br />
(n = 586)<br />
30 Months<br />
%<br />
12.9%<br />
(n = 395)<br />
8.5%<br />
(n = 399)<br />
8.0%<br />
(n = 399)<br />
17.5%<br />
(n = 399)<br />
10.6%<br />
(n = 397)
2006–08 Annual Report to Congress ● Appendix E ● Page 40<br />
The Comprehensive Community <strong>Mental</strong> Health Services for Children <strong>and</strong> Their Families Program <strong>Evaluation</strong> <strong>Findings</strong><br />
Table E-9: Child <strong>and</strong> Family Outcomes at Intake, 6 Months, 12 Months, 18 Months, 24 Months, <strong>and</strong> 30 Months for Grant Communities<br />
Funded in 1999–2000 (continued)<br />
<strong>Substance</strong> Use Survey A (SUS–A)<br />
Have You Ever Used:<br />
Grant Communities Funded in 1999–2000<br />
Intake<br />
%<br />
Cigarettes 51.0%<br />
(n = 2,359)<br />
Alcohol 44.7%<br />
(n = 2,360)<br />
Marijuana/Hashish 38.2%<br />
(n = 2,357)<br />
Cocaine in a Powder Form 5.6%<br />
(n = 2,356)<br />
LSD, Acid, PCP or Other Psychedelics 6.2%<br />
(n = 2,355)<br />
Nonprescription or Over-the-Counter Drugs 7.1%<br />
(n = 2,351)<br />
Quaaludes (e.g., quads) 0.6%<br />
(n = 2,352)<br />
Heroin, Smack 1.7%<br />
(n = 2,356)<br />
Barbituates (e.g., downers) 2.4%<br />
(n = 2,354)<br />
Narcotics (e.g., morphine) 4.3%<br />
(n = 2,353)<br />
Crack or Rock in a Hard Chunk Form 2.8%<br />
(n = 2,357)<br />
Amphetamines 5.6%<br />
(n = 2,354)<br />
Tranquilizers (e.g., Valium) 3.9%<br />
(n = 2,353)<br />
Inhalants (e.g., spray cans) 7.5%<br />
(n = 2,356)<br />
6 Months<br />
%<br />
48.2%<br />
(n = 1,462)<br />
42.0%<br />
(n = 1,462)<br />
35.0%<br />
(n = 1,462)<br />
5.6%<br />
(n = 1,462)<br />
5.1%<br />
(n = 1,462)<br />
5.8%<br />
(n = 1,457)<br />
0.8%<br />
(n = 1,462)<br />
2.0%<br />
(n = 1,462)<br />
1.8%<br />
(n = 1,462)<br />
2.9%<br />
(n = 1,462)<br />
2.7%<br />
(n = 1,462)<br />
5.0%<br />
(n = 1,461)<br />
3.8%<br />
(n = 1,462)<br />
4.9%<br />
(n = 1,462)<br />
12 Months<br />
%<br />
49.2%<br />
(n = 1,093)<br />
43.7%<br />
(n = 1,094)<br />
36.0%<br />
(n = 1,093)<br />
5.3%<br />
(n = 1,092)<br />
4.4%<br />
(n = 1,092)<br />
5.1%<br />
(n = 1,090)<br />
0.3%<br />
(n = 1,091)<br />
1.6%<br />
(n = 1,091)<br />
1.8%<br />
(n = 1,092)<br />
2.9%<br />
(n = 1,092)<br />
2.0%<br />
(n = 1,091)<br />
4.8%<br />
(n = 1,092)<br />
3.4%<br />
(n = 1,091)<br />
5.4%<br />
(n = 1,090)<br />
18 Months<br />
%<br />
48.4%<br />
(n = 756)<br />
43.9%<br />
(n = 758)<br />
37.5%<br />
(n = 757)<br />
6.6%<br />
(n = 755)<br />
6.1%<br />
(n = 756)<br />
6.4%<br />
(n = 755)<br />
0.7%<br />
(n = 755)<br />
2.6%<br />
(n = 756)<br />
3.0%<br />
(n = 756)<br />
4.9%<br />
(n = 756)<br />
3.3%<br />
(n = 755)<br />
5.2%<br />
(n = 756)<br />
4.4%<br />
(n = 757)<br />
5.0%<br />
(n = 756)<br />
24 Months<br />
%<br />
51.3%<br />
(n = 591)<br />
45.0%<br />
(n = 591)<br />
38.1%<br />
(n = 590)<br />
7.8%<br />
(n = 589)<br />
7.1%<br />
(n = 589)<br />
6.1%<br />
(n = 589)<br />
1.0%<br />
(n = 588)<br />
1.5%<br />
(n = 589)<br />
2.0%<br />
(n = 589)<br />
5.1%<br />
(n = 589)<br />
3.6%<br />
(n = 589)<br />
5.9%<br />
(n = 590)<br />
5.3%<br />
(n = 589)<br />
4.4%<br />
(n = 589)<br />
30 Months<br />
%<br />
51.4%<br />
(n = 401)<br />
47.4%<br />
(n = 401)<br />
39.2%<br />
(n = 401)<br />
7.0%<br />
(n = 401)<br />
4.5%<br />
(n = 401)<br />
6.8%<br />
(n = 400)<br />
0.2%<br />
(n = 401)<br />
1.7%<br />
(n = 401)<br />
1.7%<br />
(n = 401)<br />
3.5%<br />
(n = 401)<br />
3.2%<br />
(n = 401)<br />
5.0%<br />
(n = 401)<br />
3.0%<br />
(n = 401)<br />
5.2%<br />
(n = 401)
2006–08 Annual Report to Congress ● Appendix E ● Page 41<br />
The Comprehensive Community <strong>Mental</strong> Health Services for Children <strong>and</strong> Their Families Program <strong>Evaluation</strong> <strong>Findings</strong><br />
Table E-9: Child <strong>and</strong> Family Outcomes at Intake, 6 Months, 12 Months, 18 Months, 24 Months, <strong>and</strong> 30 Months for Grant Communities<br />
Funded in 1999–2000 (continued)<br />
<strong>Substance</strong> Use Survey A (SUS–A)<br />
<strong>Substance</strong> Use in Last 6 Months<br />
Grant Communities Funded in 1999–2000<br />
Intake<br />
%<br />
Cigarettes 34.2%<br />
(n = 2,357)<br />
Alcohol 22.9%<br />
(n = 2,357)<br />
Marijuana/Hashish 19.3%<br />
(n = 2,357)<br />
Multi-Sector Service Contacts (MSSC)<br />
Traditional Services Received in Last 6 Months<br />
6 Months<br />
%<br />
31.1%<br />
(n = 1,461)<br />
19.1%<br />
(n = 1,462)<br />
15.3%<br />
(n = 1,461)<br />
Individual Therapy n/a 77.7%<br />
(n = 2,237)<br />
Case Management n/a 77.2%<br />
(n = 2,234)<br />
Assessment or <strong>Evaluation</strong> n/a 63.0%<br />
(n = 2,219)<br />
Medication Treatment/Monitoring n/a 69.3%<br />
(n = 2,241)<br />
Family Therapy n/a 37.6%<br />
(n = 2,238)<br />
Group Therapy n/a 37.8%<br />
(n = 2,238)<br />
Crisis Stabilization n/a 19.4%<br />
(n = 2,240)<br />
12 Months<br />
%<br />
31.8%<br />
(n = 1,093)<br />
19.5%<br />
(n = 1,092)<br />
15.7%<br />
(n = 1,093)<br />
74.7%<br />
(n = 1,644)<br />
71.6%<br />
(n = 1,644)<br />
56.8%<br />
(n = 1,636)<br />
71.9%<br />
(n = 1,647)<br />
34.1%<br />
(n = 1,642)<br />
35.4%<br />
(n = 1,645)<br />
15.1%<br />
(n = 1,644)<br />
18 Months<br />
%<br />
30.9%<br />
(n = 757)<br />
21.1%<br />
(n = 757)<br />
15.2%<br />
(n = 757)<br />
71.0%<br />
(n = 1,146)<br />
67.1%<br />
(n = 1,142)<br />
51.7%<br />
(n = 1,141)<br />
70.9%<br />
(n = 1,147)<br />
30.5%<br />
(n = 1,141)<br />
34.0%<br />
(n = 1,143)<br />
14.9%<br />
(n = 1,147)<br />
24 Months<br />
%<br />
31.2%<br />
(n = 590)<br />
20.8%<br />
(n = 591)<br />
17.8%<br />
(n = 590)<br />
72.2%<br />
(n = 831)<br />
62.0%<br />
(n = 832)<br />
50.4%<br />
(n = 829)<br />
73.5%<br />
(n = 834)<br />
27.8%<br />
(n = 832)<br />
33.7%<br />
(n = 827)<br />
12.2%<br />
(n = 833)<br />
30 Months<br />
%<br />
34.8%<br />
(n = 400)<br />
23.3%<br />
(n = 400)<br />
14.2%<br />
(n = 401)<br />
68.0%<br />
(n = 572)<br />
59.5%<br />
(n = 573)<br />
49.7%<br />
(n = 569)<br />
71.9%<br />
(n = 573)<br />
26.7%<br />
(n = 576)<br />
34.4%<br />
(n = 573)<br />
12.5%<br />
(n = 574)
2006–08 Annual Report to Congress ● Appendix E ● Page 42<br />
The Comprehensive Community <strong>Mental</strong> Health Services for Children <strong>and</strong> Their Families Program <strong>Evaluation</strong> <strong>Findings</strong><br />
Table E-9: Child <strong>and</strong> Family Outcomes at Intake, 6 Months, 12 Months, 18 Months, 24 Months, <strong>and</strong> 30 Months for Grant Communities<br />
Funded in 1999–2000 (continued)<br />
Multi-Sector Service Contacts (MSSC)<br />
Innovative Services Received in Last 6 Months<br />
Grant Communities Funded in 1999–2000<br />
Intake<br />
%<br />
6 Months<br />
%<br />
Recreational Activities n/a 36.0%<br />
(n = 2,241)<br />
Family Support n/a 28.5%<br />
(n = 2,230)<br />
Transportation n/a 26.5%<br />
(n = 2,236)<br />
Flexible Funds n/a 23.8%<br />
(n = 2,222)<br />
Behavioral/Therapeutic Aide n/a 18.2%<br />
(n = 2,239)<br />
Family Preservation n/a 15.5%<br />
(n = 2,234)<br />
Respite n/a 17.4%<br />
(n = 2,240)<br />
Transition n/a 3.1%<br />
(n = 2,243)<br />
Independent Living n/a 3.3%<br />
(n = 2,245)<br />
Afterschool Programs n/a 13.6%<br />
(n = 2,235)<br />
12 Months<br />
%<br />
36.5%<br />
(n = 1,645)<br />
25.1%<br />
(n = 1,636)<br />
25.6%<br />
(n = 1,647)<br />
20.4%<br />
(n = 1,634)<br />
18.1%<br />
(n = 1,644)<br />
11.5%<br />
(n = 1,639)<br />
16.3%<br />
(n = 1,642)<br />
2.9%<br />
(n = 1,646)<br />
4.2%<br />
(n = 1,648)<br />
11.6%<br />
(n = 1,642)<br />
18 Months<br />
%<br />
35.8%<br />
(n = 1,145)<br />
23.1%<br />
(n = 1,135)<br />
23.5%<br />
(n = 1,143)<br />
17.9%<br />
(n = 1,137)<br />
16.8%<br />
(n = 1,143)<br />
10.1%<br />
(n = 1,138)<br />
16.0%<br />
(n = 1,142)<br />
3.9%<br />
(n = 1,141)<br />
4.6%<br />
(n = 1,146)<br />
12.4%<br />
(n = 1,141)<br />
24 Months<br />
%<br />
34.7%<br />
(n = 830)<br />
21.1%<br />
(n = 829)<br />
23.0%<br />
(n = 832)<br />
12.8%<br />
(n = 830)<br />
17.4%<br />
(n = 832)<br />
7.8%<br />
(n = 831)<br />
14.5%<br />
(n = 830)<br />
3.7%<br />
(n = 830)<br />
4.6%<br />
(n = 833)<br />
10.5%<br />
(n = 830)<br />
30 Months<br />
%<br />
33.8%<br />
(n = 571)<br />
19.7%<br />
(n = 574)<br />
23.2%<br />
(n = 573)<br />
13.7%<br />
(n = 575)<br />
16.6%<br />
(n = 573)<br />
5.7%<br />
(n = 574)<br />
15.0%<br />
(n = 574)<br />
4.2%<br />
(n = 575)<br />
6.4%<br />
(n = 574)<br />
12.2%<br />
(n = 574)
2006–08 Annual Report to Congress ● Appendix E ● Page 43<br />
The Comprehensive Community <strong>Mental</strong> Health Services for Children <strong>and</strong> Their Families Program <strong>Evaluation</strong> <strong>Findings</strong><br />
Table E-9: Child <strong>and</strong> Family Outcomes at Intake, 6 Months, 12 Months, 18 Months, 24 Months, <strong>and</strong> 30 Months for Grant Communities<br />
Funded in 1999–2000 (continued)<br />
Multi-Sector Service Contacts (MSSC)<br />
Restrictive Services Received in Last 6 Months<br />
Grant Communities Funded in 1999–2000<br />
Intake<br />
%<br />
6 Months<br />
%<br />
Day Treatment n/a 15.1%<br />
(n = 2,243)<br />
Inpatient Hospitalization n/a 12.6%<br />
(n = 2,248)<br />
Residential Treatment Center n/a 12.1%<br />
(n = 2,245)<br />
Therapeutic Group Home n/a 5.4%<br />
(n = 2,248)<br />
Therapeutic Foster Care n/a 4.9%<br />
(n = 2,240)<br />
Residential Camp n/a 4.9%<br />
(n = 2,241)<br />
Average Number of Service Types Received in Last 6<br />
Months<br />
n/a 6.1<br />
(n = 2,251)<br />
12 Months<br />
%<br />
14.0%<br />
(n = 1,650)<br />
11.0%<br />
(n = 1,648)<br />
12.2%<br />
(n = 1,649)<br />
5.3%<br />
(n = 1,647)<br />
4.6%<br />
(n = 1,639)<br />
3.7%<br />
(n = 1,644)<br />
5.7<br />
(n = 1,654)<br />
18 Months<br />
%<br />
13.9%<br />
(n = 1,145)<br />
10.0%<br />
(n = 1,147)<br />
11.6%<br />
(n = 1,146)<br />
5.4%<br />
(n = 1,145)<br />
4.2%<br />
(n = 1,144)<br />
3.3%<br />
(n = 1,144)<br />
5.4<br />
(n = 1,148)<br />
24 Months<br />
%<br />
13.5%<br />
(n = 832)<br />
9.0%<br />
(n = 833)<br />
11.7%<br />
(n = 832)<br />
5.9%<br />
(n = 833)<br />
4.3%<br />
(n = 830)<br />
3.4%<br />
(n = 833)<br />
5.2<br />
(n = 835)<br />
30 Months<br />
%<br />
13.1%<br />
(n = 574)<br />
8.3%<br />
(n = 575)<br />
14.3%<br />
(n = 575)<br />
3.0%<br />
(n = 574)<br />
3.0%<br />
(n = 568)<br />
3.7%<br />
(n = 574)<br />
5.1<br />
(n = 576)
2006–08 Annual Report to Congress ● Appendix E ● Page 44<br />
The Comprehensive Community <strong>Mental</strong> Health Services for Children <strong>and</strong> Their Families Program <strong>Evaluation</strong> <strong>Findings</strong><br />
Table E-10: Child <strong>and</strong> Family Outcomes at Intake, 6 Months, 12 Months, 18 Months, <strong>and</strong> 24 Months for Grant Communities Funded in<br />
2002–2004<br />
Child Behavior Checklist (CBCL 1½–5)<br />
Grant Communities Funded in 2002–2004<br />
Intake<br />
Mean (SD)<br />
Emotionally Reactive 67.2 (10.8)<br />
(n = 363)<br />
Sleep Problems 62.6 (12.2)<br />
(n = 363)<br />
Withdrawn 64.5 (10.4)<br />
(n = 363)<br />
Somatic Complaints 57.9 (8.7)<br />
(n = 363)<br />
Anxious/Depressed 62.9 (10.3)<br />
(n = 363)<br />
Attention Problems 64.1 (8.8)<br />
(n = 363)<br />
Aggressive Problems 72.0 (14.0)<br />
(n = 363)<br />
Internalizing Problems 64.8 (9.8)<br />
(n = 363)<br />
Externalizing Problems 69.8 (12.5)<br />
(n = 363)<br />
Total Problems 68.4 (10.6)<br />
(n = 363)<br />
At/Above Clinical Level 70.0%<br />
(n = 363)<br />
6 Months<br />
Mean (SD)<br />
64.7 (9.8)<br />
(n = 159)<br />
59.2 (10.3)<br />
(n = 159)<br />
63.0 (10.1)<br />
(n = 159)<br />
56.7 (8.2)<br />
(n = 159)<br />
60.5 (9.9)<br />
(n = 159)<br />
62.6 (8.5)<br />
(n = 159)<br />
67.5 (13.5)<br />
(n = 159)<br />
62.2 (10.5)<br />
(n = 159)<br />
65.8 (12.6)<br />
(n = 159)<br />
64.5 (11.2)<br />
(n = 159)<br />
57.2%<br />
(n = 159)<br />
12 Months<br />
Mean (SD)<br />
64.3 (10.7)<br />
(n = 102)<br />
60.1 (11.0)<br />
(n = 102)<br />
62.4 (10.4)<br />
(n = 102)<br />
57.8 (9.2)<br />
(n = 102)<br />
59.5 (8.7)<br />
(n = 102)<br />
61.3 (8.5)<br />
(n = 102)<br />
65.8 (13.3)<br />
(n = 100)<br />
61.4 (11.6)<br />
(n = 102)<br />
63.1 (13.7)<br />
(n = 102)<br />
63.4 (13.0)<br />
(n = 102)<br />
52.0%<br />
(n = 102)<br />
18 Months<br />
Mean (SD)<br />
62.5 (10.9)<br />
(n = 42)<br />
62.6 (13.6)<br />
(n = 42)<br />
60.9 (11.2)<br />
(n = 42)<br />
56.6 (9.1)<br />
(n = 42)<br />
60.6 (10.0)<br />
(n = 42)<br />
57.9 (8.3)<br />
(n = 42)<br />
64.3 (11.8)<br />
(n = 40)<br />
59.5 (13.2)<br />
(n = 42)<br />
59.4 (14.3)<br />
(n = 42)<br />
60.6 (14.8)<br />
(n = 42)<br />
52.4%<br />
(n = 42)<br />
24 Months<br />
Mean (SD)<br />
63.9 (12.8)<br />
(n = 25)<br />
58.9 (8.6)<br />
(n = 25)<br />
60.1 (8.7)<br />
(n = 25)<br />
57.1 (10.7)<br />
(n = 25)<br />
59.2 (8.6)<br />
(n = 25)<br />
59.2 (8.0)<br />
(n = 25)<br />
61.3 (12.9)<br />
(n = 25)<br />
59.8 (12.8)<br />
(n = 25)<br />
58.8 (14.3)<br />
(n = 25)<br />
60.1 (15.0)<br />
(n = 25)<br />
40.0%<br />
(n = 25)
2006–08 Annual Report to Congress ● Appendix E ● Page 45<br />
The Comprehensive Community <strong>Mental</strong> Health Services for Children <strong>and</strong> Their Families Program <strong>Evaluation</strong> <strong>Findings</strong><br />
Table E-10: Child <strong>and</strong> Family Outcomes at Intake, 6 Months, 12 Months, 18 Months, <strong>and</strong> 24 Months for Grant Communities Funded in<br />
2002–2004 (continued)<br />
Child Behavior Checklist (CBCL 6–18)<br />
Grant Communities Funded in 2002–2004<br />
Intake<br />
Mean (SD)<br />
Activities Competence 36.6 (9.3)<br />
(n = 3,458)<br />
Social Competence 36.5 (9.0)<br />
(n = 3,355)<br />
School Competence 36.2 (8.4)<br />
(n = 3,105)<br />
Total Competence 31.4 (8.5)<br />
(n = 2,964)<br />
Anxious/Depressed 65.1 (10.7)<br />
(n = 3,537)<br />
Withdrawn 65.9 (10.2)<br />
(n = 3,537)<br />
Somatic Complaints 61.3 (9.4)<br />
(n = 3,537)<br />
Social Problems 66.7 (9.7)<br />
(n = 3,537)<br />
Thought Problems 66.9 (10.0)<br />
(n = 3,537)<br />
Attention Problems 68.5 (11.1)<br />
(n = 3,537)<br />
Rule-Breaking Behavior 67.3 (8.9)<br />
(n = 3,537)<br />
Aggressive Behavior 72.4 (12.4)<br />
(n = 3,537)<br />
Internalizing 65.4 (9.9)<br />
(n = 3,537)<br />
Externalizing 69.7 (9.5)<br />
(n = 3,537)<br />
Total Problems 69.6 (8.9)<br />
(n = 3,537)<br />
Clinical Level (Total Problems) 77.90%<br />
(n = 3,537)<br />
6 Months<br />
Mean (SD)<br />
36.6 (9.2)<br />
(n = 2,335)<br />
37.9 (9.0)<br />
(n = 2,283)<br />
37.4 (8.5)<br />
(n = 2,104)<br />
32.5 (8.7)<br />
(n = 2,024)<br />
62.9 (10.4)<br />
(n = 2,370)<br />
64.0 (9.9)<br />
(n = 2,370)<br />
60.0 (9.3)<br />
(n = 2,370)<br />
65.1 (9.5)<br />
(n = 2,370)<br />
65.2 (9.9)<br />
(n = 2,370)<br />
66.4 (10.6)<br />
(n = 2,370)<br />
65.8 (9.0)<br />
(n = 2,370)<br />
69.8 (12.1)<br />
(n = 2,370)<br />
63.1 (10.6)<br />
(n = 2,370)<br />
67.6 (10.1)<br />
(n = 2,370)<br />
67.3 (9.8)<br />
(n = 2,370)<br />
69.60%<br />
(n = 2,370)<br />
12 Months<br />
Mean (SD)<br />
36.7 (9.2)<br />
(n = 1,804)<br />
38.2 (9.1)<br />
(n = 1,767)<br />
37.8 (8.6)<br />
(n = 1,631)<br />
32.8 (8.9)<br />
(n = 1,571)<br />
61.8 (10.0)<br />
(n = 1,833)<br />
63.2 (9.7)<br />
(n = 1,833)<br />
59.3 (9.1)<br />
(n = 1,833)<br />
64.4 (9.6)<br />
(n = 1,833)<br />
64.5 (9.9)<br />
(n = 1,833)<br />
65.2 (10.3)<br />
(n = 1,833)<br />
65.0 (9.0)<br />
(n = 1,833)<br />
68.8 (12.2)<br />
(n = 1,833)<br />
61.8 (10.8)<br />
(n = 1,833)<br />
66.8 (10.3)<br />
(n = 1,833)<br />
66.3 (10.1)<br />
(n = 1,833)<br />
66.30%<br />
(n = 1,833)<br />
18 Months<br />
Mean (SD)<br />
36.6 (9.4)<br />
(n = 1,312)<br />
37.9 (9.1)<br />
(n = 1,283)<br />
38.1 (8.9)<br />
(n = 1,165)<br />
32.6 (9.2)<br />
(n = 1,116)<br />
61.4 (10.3)<br />
(n = 1,338)<br />
62.6 (9.6)<br />
(n = 1,338)<br />
59.0 (8.9)<br />
(n = 1,338)<br />
64.0 (9.8)<br />
(n = 1,338)<br />
63.7 (9.9)<br />
(n = 1,338)<br />
64.7 (10.4)<br />
(n = 1,338)<br />
64.3 (9.2)<br />
(n = 1,338)<br />
68.1 (12.5)<br />
(n = 1,338)<br />
61.1 (11.1)<br />
(n = 1,338)<br />
65.9 (10.9)<br />
(n = 1,338)<br />
65.3 (11.0)<br />
(n = 1,338)<br />
62.90%<br />
(n = 1,338)<br />
24 Months<br />
Mean (SD)<br />
36.7 (9.3)<br />
(n = 884)<br />
38.8 (8.7)<br />
(n = 852)<br />
37.8 (8.9)<br />
(n = 761)<br />
33.5 (9.0)<br />
(n = 725)<br />
60.7 (10.3)<br />
(n = 901)<br />
62.0 (9.1)<br />
(n = 901)<br />
58.8 (9.2)<br />
(n = 901)<br />
63.4 (10.1)<br />
(n = 901)<br />
63.1 (10.0)<br />
(n = 901)<br />
64.1 (10.6)<br />
(n = 901)<br />
64.0 (9.0)<br />
(n = 901)<br />
67.0 (12.0)<br />
(n = 901)<br />
60.1 (11.7)<br />
(n = 901)<br />
65.0 (11.2)<br />
(n = 901)<br />
64.3 (11.6)<br />
(n = 901)<br />
60.50%<br />
(n = 901)
2006–08 Annual Report to Congress ● Appendix E ● Page 46<br />
The Comprehensive Community <strong>Mental</strong> Health Services for Children <strong>and</strong> Their Families Program <strong>Evaluation</strong> <strong>Findings</strong><br />
Table E-10: Child <strong>and</strong> Family Outcomes at Intake, 6 Months, 12 Months, 18 Months, <strong>and</strong> 24 Months for Grant Communities Funded in<br />
2002–2004 (continued)<br />
Behavioral <strong>and</strong> Emotional Rating Scale–2, Caregiver<br />
(BERS–2C)<br />
Grant Communities Funded in 2002–2004<br />
Intake<br />
Mean (SD)<br />
Intrapersonal Strengths 7.6 (3.3)<br />
(n = 3,674)<br />
Interpersonal Strengths 6.6 (3.1)<br />
(n = 3,681)<br />
School Functioning 6.4 (3.0)<br />
(n = 3,517)<br />
Family Involvement 7.0 (2.9)<br />
(n = 3,689)<br />
Affective Strengths 8.1 (3.1)<br />
(n = 3,689)<br />
Career Strengths 8.7 (3.7)<br />
(n = 3,130)<br />
Strengths Quotient 80.2 (17.2)<br />
(n = 3,501)<br />
6 Months<br />
Mean (SD)<br />
8.0 (3.3)<br />
(n = 2,437)<br />
7.1 (3.2)<br />
(n = 2,437)<br />
7.0 (3.1)<br />
(n = 2,355)<br />
7.4 (2.9)<br />
(n = 2,440)<br />
8.3 (3.0)<br />
(n = 2,442)<br />
9.1 (3.6)<br />
(n = 2,121)<br />
83.1 (17.9)<br />
(n = 2,352)<br />
12 Months<br />
Mean (SD)<br />
8.2 (3.3)<br />
(n = 1,876)<br />
7.3 (3.2)<br />
(n = 1,880)<br />
7.2 (3.2)<br />
(n = 1,798)<br />
7.5 (3.0)<br />
(n = 1,879)<br />
8.4 (3.1)<br />
(n = 1,882)<br />
9.2 (3.6)<br />
(n = 1,670)<br />
84.4 (18.2)<br />
(n = 1,792)<br />
18 Months<br />
Mean (SD)<br />
8.3 (3.5)<br />
(n = 1,356)<br />
7.5 (3.3)<br />
(n = 1,355)<br />
7.4 (3.3)<br />
(n = 1,277)<br />
7.6 (3.0)<br />
(n = 1,356)<br />
8.5 (3.1)<br />
(n = 1,357)<br />
9.3 (3.6)<br />
(n = 1,197)<br />
85.1 (19.0)<br />
(n = 1,274)<br />
24 Months<br />
Mean (SD)<br />
8.5 (3.5)<br />
(n = 922)<br />
7.7 (3.3)<br />
(n = 922)<br />
7.3 (3.4)<br />
(n = 872)<br />
7.7 (3.1)<br />
(n = 919)<br />
8.6 (3.1)<br />
(n = 923)<br />
9.3 (3.5)<br />
(n = 808)<br />
86.2 (19.5)<br />
(n = 870)
2006–08 Annual Report to Congress ● Appendix E ● Page 47<br />
The Comprehensive Community <strong>Mental</strong> Health Services for Children <strong>and</strong> Their Families Program <strong>Evaluation</strong> <strong>Findings</strong><br />
Table E-10: Child <strong>and</strong> Family Outcomes at Intake, 6 Months, 12 Months, 18 Months, <strong>and</strong> 24 Months for Grant Communities Funded in<br />
2002–2004 (continued)<br />
Behavioral <strong>and</strong> Emotional Rating Scale–2, Youth<br />
(BERS–2Y)<br />
Grant Communities Funded in 2002–2004<br />
Intake<br />
Mean (SD)<br />
Intrapersonal Strengths 9.3 (2.9)<br />
(n = 2,359)<br />
Interpersonal Strengths 8.7 (3.4)<br />
(n = 2,358)<br />
School Functioning 8.4 (3.0)<br />
(n = 2,323)<br />
Family Involvement 8.8 (3.0)<br />
(n = 2,360)<br />
Affective Strengths 9.6 (3.1)<br />
(n = 2,359)<br />
Career Strengths 9.7 (2.9)<br />
(n = 2,238)<br />
Strengths Quotient 92.7 (16.9)<br />
(n = 2,319)<br />
Columbia Impairment Scale (CIS)<br />
Overall Level of Impairment 23.0 (10.6)<br />
(n = 3,996)<br />
6 Months<br />
Mean (SD)<br />
9.6 (2.9)<br />
(n = 1,588)<br />
9.1 (3.3)<br />
(n = 1,586)<br />
8.9 (3.0)<br />
(n = 1,559)<br />
9.1 (2.8)<br />
(n = 1,585)<br />
9.9 (3.0)<br />
(n = 1,587)<br />
9.9 (2.7)<br />
(n = 1,543)<br />
95.3 (16.8)<br />
(n = 1,554)<br />
20.9 (10.6)<br />
(n = 2,569)<br />
12 Months<br />
Mean (SD)<br />
9.5 (2.9)<br />
(n = 1,255)<br />
9.2 (3.3)<br />
(n = 1,255)<br />
8.9 (3.0)<br />
(n = 1,213)<br />
9.2 (2.9)<br />
(n = 1,255)<br />
10.0 (3.1)<br />
(n = 1,256)<br />
9.8 (2.8)<br />
(n = 1,224)<br />
95.6 (17.3)<br />
(n = 1,213)<br />
20.1 (10.6)<br />
(n = 1,953)<br />
18 Months<br />
Mean (SD)<br />
9.6 (2.9)<br />
(n = 939)<br />
9.3 (3.4)<br />
(n = 938)<br />
9.1 (3.0)<br />
(n = 890)<br />
9.3 (2.9)<br />
(n = 938)<br />
10.1 (3.0)<br />
(n = 938)<br />
9.8 (2.7)<br />
(n = 928)<br />
96.5 (17.0)<br />
(n = 890)<br />
19.2 (10.8)<br />
(n = 1,391)<br />
24 Months<br />
Mean (SD)<br />
9.9 (2.9)<br />
(n = 682)<br />
9.6 (3.5)<br />
(n = 681)<br />
9.1 (3.1)<br />
(n = 642)<br />
9.4 (2.9)<br />
(n = 682)<br />
10.3 (3.0)<br />
(n = 682)<br />
10.0 (2.7)<br />
(n = 676)<br />
97.4 (17.3)<br />
(n = 641)<br />
18.5 (11.0)<br />
(n = 929)<br />
Clinical Level 76.9% 71.4% 68.6% 64.6% 62.1%<br />
Revised Children’s Manifest Anxiety Scale (RCMAS)<br />
Worry/Oversensitivity 11.1 (3.3)<br />
(n = 2,355)<br />
Social Concerns/Concentration 10.4 (3.4)<br />
(n = 2,358)<br />
Physiological Anxietyi8 11.0 (3.1)<br />
(n = 2,266)<br />
Total Anxiety 54.6 (11.7)<br />
(n = 2,350)<br />
Clinical Level 31.1%<br />
(n = 2,350)<br />
10.8 (3.4)<br />
(n = 1,590)<br />
9.9 (3.5)<br />
(n = 1,590)<br />
10.4 (3.2)<br />
(n = 1,524)<br />
52.9 (12.1)<br />
(n = 1,586)<br />
26.3%<br />
(n = 1,586)<br />
10.7 (3.5)<br />
(n = 1,246)<br />
9.8 (3.5)<br />
(n = 1,245)<br />
10.4 (3.3)<br />
(n = 1,186)<br />
52.5 (12.6)<br />
(n = 1,239)<br />
26.1%<br />
(n = 1,239)<br />
10.4 (3.5)<br />
(n = 935)<br />
9.4 (3.4)<br />
(n = 933)<br />
10.0 (3.2)<br />
(n = 885)<br />
51.0 (12.5)<br />
(n = 931)<br />
23.4%<br />
(n = 931)<br />
10.3 (3.4)<br />
(n = 693)<br />
9.3 (3.4)<br />
(n = 691)<br />
9.9 (3.3)<br />
(n = 654)<br />
50.6 (12.4)<br />
(n = 689)<br />
21.8%<br />
(n = 689)
2006–08 Annual Report to Congress ● Appendix E ● Page 48<br />
The Comprehensive Community <strong>Mental</strong> Health Services for Children <strong>and</strong> Their Families Program <strong>Evaluation</strong> <strong>Findings</strong><br />
Table E-10: Child <strong>and</strong> Family Outcomes at Intake, 6 Months, 12 Months, 18 Months, <strong>and</strong> 24 Months for Grant Communities Funded in<br />
2002–2004 (continued)<br />
Reynolds Adolescent Depression Scale–2 (RADS–2)<br />
Grant Communities Funded in 2002–2004<br />
Intake<br />
Mean (SD)<br />
Dysphoric Mood 50.8 (11.1)<br />
(n = 2,426)<br />
Anhedonia/Negative Affect 51.3 (7.8)<br />
(n = 2,421)<br />
Negative Self-<strong>Evaluation</strong> 53.7 (10.7)<br />
(n = 2,423)<br />
Somatic Complaints 51.5 (10.8)<br />
(n = 2,427)<br />
Total Depression 52.5 (10.3)<br />
(n = 2,427)<br />
Clinical Level (Total Depression) 22.7%<br />
(n = 2,427)<br />
Caregiver Strain Questionnaire (CGSQ)<br />
Subjective Externalizing Strain 2.4 (1.0)<br />
(n = 3,998)<br />
Subjective Internalizing Strain 3.6 (1.0)<br />
(n = 3,996)<br />
Objective Strain 2.7 (1.1)<br />
(n = 3,998)<br />
Global Strain 8.6 (2.6)<br />
(n = 3,988)<br />
Family Life Questionnaire (FLQ)<br />
Family Functioning Scale 3.4 (.73)<br />
(n = 4,075)<br />
6 Months<br />
Mean (SD)<br />
49.1 (10.8)<br />
(n = 1,616)<br />
50.7 (7.6)<br />
(n = 1,615)<br />
51.7 (10.3)<br />
(n = 1,615)<br />
50.0 (10.8)<br />
(n = 1,617)<br />
50.1 (10.1)<br />
(n = 1,617)<br />
17.0%<br />
(n = 1,617)<br />
2.3 (1.0)<br />
(n = 2,535)<br />
3.3 (1.1)<br />
(n = 2,535)<br />
2.4 (1.1)<br />
(n = 2,543)<br />
7.9 (2.7)<br />
(n = 2,534)<br />
3.4 (.73)<br />
(n = 2,604)<br />
12 Months<br />
Mean (SD)<br />
48.9 (10.8)<br />
(n = 1,266)<br />
50.8 (7.9)<br />
(n = 1,261)<br />
51.4 (10.2)<br />
(n = 1,261)<br />
49.4 (11.0)<br />
(n = 1,265)<br />
50.2 (10.2)<br />
(n = 1,266)<br />
17.6%<br />
(n = 1,266)<br />
2.2 (0.9)<br />
(n = 1,923)<br />
3.1 (1.1)<br />
(n = 1,922)<br />
2.3 (1.0)<br />
(n = 1,922)<br />
7.6 (2.6)<br />
(n = 1,921)<br />
3.4 (.73)<br />
(n = 1,980)<br />
18 Months<br />
Mean (SD)<br />
48.2 (10.7)<br />
(n = 950)<br />
50.6 (7.9)<br />
(n = 942)<br />
50.7 (10.2)<br />
(n = 950)<br />
48.9 (11.0)<br />
(n = 949)<br />
49.5 (10.2)<br />
(n = 950)<br />
15.5%<br />
(n = 950)<br />
2.2 (1.0)<br />
(n = 1,371)<br />
3.0 (1.1)<br />
(n = 1,371)<br />
2.2 (1.1)<br />
(n = 1,369)<br />
7.4 (2.7)<br />
(n = 1,369)<br />
3.4 (.73)<br />
(n = 1,428)<br />
24 Months<br />
Mean (SD)<br />
47.8 (10.7)<br />
(n = 699)<br />
50.1 (7.6)<br />
(n = 691)<br />
50.3 (10.0)<br />
(n = 697)<br />
48.8 (10.4)<br />
(n = 699)<br />
49.0 (9.9)<br />
(n = 699)<br />
13.3%<br />
(n = 699)<br />
2.1 (0.9)<br />
(n = 923)<br />
2.9 (1.2)<br />
(n = 923)<br />
2.1 (1.0)<br />
(n = 923)<br />
7.1 (2.8)<br />
(n = 923)<br />
3.4 (.76)<br />
(n = 980)
2006–08 Annual Report to Congress ● Appendix E ● Page 49<br />
The Comprehensive Community <strong>Mental</strong> Health Services for Children <strong>and</strong> Their Families Program <strong>Evaluation</strong> <strong>Findings</strong><br />
Table E-10: Child <strong>and</strong> Family Outcomes at Intake, 6 Months, 12 Months, 18 Months, <strong>and</strong> 24 Months for Grant Communities Funded in<br />
2002–2004 (continued)<br />
Family Life Questionnaire (FLQ)<br />
Grant Communities Funded in 2002–2004<br />
Intake<br />
%<br />
6 Months<br />
%<br />
12 Months<br />
%<br />
18 Months<br />
%<br />
24 Months<br />
%<br />
Type of Living Arrangements a (n = 4,043) (n = 2,603) (n = 1,969) (n = 1,435) (n = 974)<br />
Homeless 1.2% 1.0% 0.9% 0.8% 0.8%<br />
Home 95.6% 94.7% 95.3% 95.2% 95.0%<br />
School Dormitory 0.2% 0.3% 0.3% 0.6% 0.5%<br />
Recreational Camp 0.1% 0.2% 0.3% 0.2% 0.4%<br />
Emergency Shelter 1.3% 1.2% 0.5% 0.6% 0.1%<br />
Foster Home 3.0% 1.8% 1.4% 1.3% 1.2%<br />
Therapeutic/Specialized Foster Home 1.1% 0.9% 0.7% 0.4% 0.6%<br />
Group Home 2.1% 1.8% 1.6% 1.4% 1.4%<br />
Medical Hospital 1.3% 0.7% 0.3% 0.5% 0.2%<br />
Residential Treatment Center 5.7% 5.6% 5.9% 4.5% 3.4%<br />
Psychiatric Hospital 7.4% 4.7% 4.2% 2.6% 1.7%<br />
Youth Justice Related 4.3% 3.8% 3.0% 3.4% 3.0%<br />
Adult Justice Related 0.4% 0.4% 0.6% 0.5% 0.8%<br />
Other 1.5% 1.2% 1.5% 0.9% 1.2%<br />
Stability in Living Arrangements (n = 4,043) (n = 2,606) (n = 1,969) (n = 1,435) (n = 974)<br />
One Living Arrangement 69.3% 77.9% 78.2% 80.9% 82.5%<br />
Multiple Living Arrangements 30.7% 22.1% 21.8% 19.1% 17.5%
2006–08 Annual Report to Congress ● Appendix E ● Page 50<br />
The Comprehensive Community <strong>Mental</strong> Health Services for Children <strong>and</strong> Their Families Program <strong>Evaluation</strong> <strong>Findings</strong><br />
Table E-10: Child <strong>and</strong> Family Outcomes at Intake, 6 Months, 12 Months, 18 Months, <strong>and</strong> 24 Months for Grant Communities Funded in<br />
2002–2004 (continued)<br />
Education Questionnaire–Revised (EQ–R)<br />
Grant Communities Funded in 2002–2004<br />
Intake<br />
%<br />
Attending School (n = 4,108)<br />
94.5%<br />
6 Months<br />
%<br />
(n = 2,641)<br />
94.9%<br />
12 Months<br />
%<br />
(n = 2,015)<br />
93.7%<br />
18 Months<br />
%<br />
(n = 1,450)<br />
92.4%<br />
24 Months<br />
%<br />
(n = 993)<br />
88.8%<br />
Excused <strong>and</strong> Unexcused Absences (n = 3,483) (n = 2,295) (n = 1,732) (n = 1,244) (n = 802)<br />
No Absences 16.2% 20.6% 23.2% 25.9% 25.2%<br />
Less Than 1 Day Per Month 23.4% 25.5% 27.9% 27.5% 26.8%<br />
About 1 Day a Month 19.3% 20.5% 19.3% 16.8% 16.7%<br />
About 1 Day Every 2 Weeks 13.7% 12.5% 10.7% 12.2% 12.0%<br />
About 1 Day a Week 8.2% 7.1% 6.6% 6.1% 8.2%<br />
2 Days Per Week 7.8% 5.8% 6.1% 4.8% 4.5%<br />
3 or More Days Per Week 11.4% 8.1% 6.1% 6.7% 6.6%<br />
Educational Placement (n = 3,502) (n = 2,305) (n = 1,747) (n = 1,252) (n = 804)<br />
Public Day School 85.3% 81.8% 78.6% 78.0% 78.5%<br />
Private Day/Boarding School 2.9% 3.3% 3.8% 4.0% 4.1%<br />
Home School 2.5% 2.6% 3.0% 2.4% 1.9%<br />
Alternative/Special Day School 15.6% 18.1% 17.5% 17.0% 16.0%<br />
School in 24-Hour Restrictive Setting b 7.5% 5.4% 6.5% 5.7% 3.9%<br />
Postsecondary School 0.2% 0.4% 1.0% 1.8% 2.1%<br />
Other 3.3% 2.6% 2.3% 2.0% 2.6%<br />
School Performance (n = 3,415) (n = 2,259) (n = 1,711) (n = 1,235) (n = 792)<br />
Grade Average A 8.0% 8.4% 10.0% 11.4% 9.5%<br />
Grade Average B 21.0% 24.1% 26.5% 28.9% 31.1%<br />
Grade Average C 23.9% 27.7% 27.2% 25.1% 28.0%<br />
Grade Average D 9.5% 9.7% 8.6% 8.8% 7.8%<br />
Failing All or Most Classes 22.1% 15.5% 15.0% 13.0% 13.0%<br />
School Does Not Grade 13.2% 12.9% 10.8% 10.6% 9.3%<br />
Other 2.3% 1.8% 1.9% 2.1% 1.3%
2006–08 Annual Report to Congress ● Appendix E ● Page 51<br />
The Comprehensive Community <strong>Mental</strong> Health Services for Children <strong>and</strong> Their Families Program <strong>Evaluation</strong> <strong>Findings</strong><br />
Table E-10: Child <strong>and</strong> Family Outcomes at Intake, 6 Months, 12 Months, 18 Months, <strong>and</strong> 24 Months for Grant Communities Funded in<br />
2002–2004 (continued)<br />
Education Questionnaire–Revised (EQ–R)<br />
Grant Communities Funded in 2002–2004<br />
Intake<br />
%<br />
Individualized Education Plan (IEP) (n = 3,483)<br />
49.6%<br />
6 Months<br />
%<br />
(n = 2,282)<br />
53.3%<br />
12 Months<br />
%<br />
(n = 1,720)<br />
56.4%<br />
18 Months<br />
%<br />
(n = 1,223)<br />
54.9%<br />
24 Months<br />
%<br />
(n = 786)<br />
54.8%<br />
Reasons for IEP a (n = 1,710) (n = 1,204) (n = 964) (n = 667) (n = 424)<br />
Behavior/Emotional Problems 75.5% 78.1% 78.1% 77.8% 77.1%<br />
Learning Disability 54.8% 53.8% 58.1% 55.3% 59.2%<br />
Physical Disability 2.9% 3.4% 3.4% 3.3% 3.5%<br />
Developmental Disability or <strong>Mental</strong> Retardation 14.7% 13.7% 12.0% 14.2% - -<br />
Vision Impairment 3.7% 2.7% 2.4% 2.7% 2.6%<br />
Speech Impairment 16.7% 14.0% 13.3% 12.6% 10.4%<br />
Other 5.6% 4.9% 4.5% 4.0% 4.5%<br />
Type of Special Education Placement a (n = 1,541) (n = 1,089) (n = 894) (n = 614) (n = 407)<br />
Special Class All or Most of the Day 54.3% 55.6% 56.8% 53.6% 58.2%<br />
Special Class for a Portion of the Day 26.4% 26.8% 22.7% 20.0% 22.6%<br />
Special Instruction As Part of a General Education Class 23.6% 22.3% 25.6% 26.5% 24.9%<br />
Disciplinary Actions (n = 3,388) (n = 2,245) (n = 1,700) (n = 1,206) (n = 781)<br />
None 39.3% 32.4% 30.9% 28.8% 27.1%<br />
Suspended 1.2% 0.9% 0.4% 0.2% 0.3%<br />
Expelled 3.7% 3.0% 2.2% 1.7% 1.9%<br />
Suspended <strong>and</strong> Expelled 55.8% 63.6% 66.6% 69.4% 70.7%
2006–08 Annual Report to Congress ● Appendix E ● Page 52<br />
The Comprehensive Community <strong>Mental</strong> Health Services for Children <strong>and</strong> Their Families Program <strong>Evaluation</strong> <strong>Findings</strong><br />
Table E-10: Child <strong>and</strong> Family Outcomes at Intake, 6 Months, 12 Months, 18 Months, <strong>and</strong> 24 Months for Grant Communities Funded in<br />
2002–2004 (continued)<br />
Delinquency Survey–Revised (DS–R)<br />
Juvenile Justice Contacts<br />
Grant Communities Funded in 2002–2004<br />
Intake<br />
%<br />
Questioned by Police 22.8%<br />
(n = 2,291)<br />
Arrested 22.6%<br />
(n = 2,296)<br />
Told to Appear in Court 18.8%<br />
(n = 2,285)<br />
Convicted of a Crime 10.2%<br />
(n = 2,290)<br />
On Probation 10.6%<br />
(n = 2,294)<br />
Sentenced to Secure Facility 10.6%<br />
(n = 2,287)<br />
<strong>Substance</strong> Problem Urgency (GAIN)<br />
6 Months<br />
%<br />
17.4%<br />
(n = 1,477)<br />
15.3%<br />
(n = 1,482)<br />
14.8%<br />
(n = 1,483)<br />
7.3%<br />
(n = 1,484)<br />
21.6%<br />
(n = 1,485)<br />
7.4%<br />
(n = 1,485)<br />
12 Months<br />
%<br />
17.2%<br />
(n = 1,120)<br />
13.4%<br />
(n = 1,120)<br />
12.4%<br />
(n = 1,118)<br />
6.8%<br />
(n = 1,122)<br />
19.4%<br />
(n = 1,121)<br />
6.6%<br />
(n = 1,121)<br />
18 Months<br />
%<br />
17.1%<br />
(n = 808)<br />
11.6%<br />
(n = 810)<br />
13.2%<br />
(n = 805)<br />
6.4%<br />
(n = 807)<br />
18.0%<br />
(n = 806)<br />
7.9%<br />
(n = 809)<br />
24 Months<br />
%<br />
14.2%<br />
(n = 569)<br />
11.8%<br />
(n = 570)<br />
12.1%<br />
(n = 570)<br />
5.8%<br />
(n = 569)<br />
15.5%<br />
(n = 568)<br />
6.3%<br />
(n = 568)<br />
<strong>Substance</strong> Use <strong>and</strong> <strong>Abuse</strong> Scale (SUS–9) (n = 689) (n = 384) (n = 320) (n = 200) (n = 162)<br />
Mean (SD) 3.2 (2.5) 2.8 (2.4) 2.6 (2.4) 2.6 (2.4) 2.1 (2.2)<br />
Minimal/No Urgency 46.2% 52.9% 55.3% 57.0% 67.9%<br />
Moderate Urgency 40.6% 39.1% 35.9% 34.0% 26.5%<br />
High Urgency 13.2% 8.1% 8.8% 9.0% 5.6%<br />
<strong>Substance</strong> Dependence Scale (SUS–7) (n = 683) (n = 384) (n = 319) (n = 200) (n = 161)<br />
Mean (SD) 1.9 (2.1) 1.6 (1.9) 1.4 (1.9) 1.4 (1.4) 1.1 (1.5)<br />
Minimal/No Urgency 57.0% 60.2% 66.1% 67.0% 72.0%<br />
Moderate Urgency 32.1% 34.6% 25.7% 26.5% 24.8%<br />
High Urgency 11.0% 5.2% 8.2% 6.5% 3.1%
2006–08 Annual Report to Congress ● Appendix E ● Page 53<br />
The Comprehensive Community <strong>Mental</strong> Health Services for Children <strong>and</strong> Their Families Program <strong>Evaluation</strong> <strong>Findings</strong><br />
Table E-10: Child <strong>and</strong> Family Outcomes at Intake, 6 Months, 12 Months, 18 Months, <strong>and</strong> 24 Months for Grant Communities Funded in<br />
2002–2004 (continued)<br />
<strong>Substance</strong> Problem Urgency (GAIN)<br />
Grant Communities Funded in 2002–2004<br />
Intake<br />
%<br />
6 Months<br />
%<br />
12 Months<br />
%<br />
18 Months<br />
%<br />
24 Months<br />
%<br />
<strong>Substance</strong> Problem Scale (SPS) (n = 689) (n = 384) (n = 320) (n = 200) (n = 162)<br />
Mean (SD) 5.1 (4.3) 4.4 (3.9) 4.1 (4.0) 4.0 (3.9) 3.1 (3.4)<br />
Minimal/No Urgency 46.9% 50.5% 55.9% 59.0% 64.8%<br />
Moderate Urgency 41.7% 42.7% 36.6% 34.5% 30.9%<br />
High Urgency 11.5% 6.8% 7.5% 6.5% 4.3%<br />
Multi-Sector Service Contacts–Revised (MSSC–R)<br />
Number of Different Services Utilized (n = 2,365) (n = 1,552) (n = 952) (n = 552)<br />
Mean (SD) n/a 5.3 (2.9) 5.0 (2.9) 4.7 (2.9) 4.4 (2.8)<br />
1–3 n/a 30.4% 35.1% 38.7% 45.1%<br />
4–6 n/a 38.4% 37.4% 35.8% 34.6%<br />
7–9 n/a 22.1% 19.3% 19.2% 14.5%<br />
10 or more n/a 9.0% 8.2% 6.3% 5.8%
2006–08 Annual Report to Congress ● Appendix E ● Page 54<br />
The Comprehensive Community <strong>Mental</strong> Health Services for Children <strong>and</strong> Their Families Program <strong>Evaluation</strong> <strong>Findings</strong><br />
Table E-10: Child <strong>and</strong> Family Outcomes at Intake, 6 Months, 12 Months, 18 Months, <strong>and</strong> 24 Months for Grant Communities Funded in<br />
2002–2004 (continued)<br />
Multi-Sector Service Contacts–Revised (MSSC–R)<br />
Type of Services Utilized<br />
Traditional<br />
Grant Communities Funded in 2002–2004<br />
Intake<br />
%<br />
6 Months<br />
%<br />
Individual Therapy n/a 69.0%<br />
(n = 2,401)<br />
Case Management n/a 68.6%<br />
(n = 2,394)<br />
Assessment or <strong>Evaluation</strong> n/a 57.4%<br />
(n = 2,366)<br />
Medication Treatment/Monitoring n/a 43.2%<br />
(n = 2,398)<br />
Family Therapy n/a 30.9%<br />
(n = 2,400)<br />
Group Therapy n/a 21.7%<br />
(n = 2,397)<br />
Crisis Stabilization n/a 14.3%<br />
(n = 2,399)<br />
12 Months<br />
%<br />
66.7%<br />
(n = 1,585)<br />
63.7%<br />
(n = 1,580)<br />
45.4%<br />
(n = 1,572)<br />
46.3%<br />
(n = 1,584)<br />
29.8%<br />
(n = 1,587)<br />
22.3%<br />
(n = 1,585)<br />
10.7%<br />
(n = 1,585)<br />
18 Months<br />
%<br />
62.9%<br />
(n = 976)<br />
59.8%<br />
(n = 974)<br />
42.5%<br />
(n = 969)<br />
47.5%<br />
(n = 973)<br />
28.4%<br />
(n = 973)<br />
21.2%<br />
(n = 972)<br />
9.5%<br />
(n = 977)<br />
24 Months<br />
%<br />
60.6%<br />
(n = 566)<br />
54.3%<br />
(n = 565)<br />
41.6%<br />
(n = 567)<br />
49.2%<br />
(n = 569)<br />
23.4%<br />
(n = 568)<br />
18.9%<br />
(n = 565)<br />
8.1%<br />
(n = 566)
2006–08 Annual Report to Congress ● Appendix E ● Page 55<br />
The Comprehensive Community <strong>Mental</strong> Health Services for Children <strong>and</strong> Their Families Program <strong>Evaluation</strong> <strong>Findings</strong><br />
Table E-10: Child <strong>and</strong> Family Outcomes at Intake, 6 Months, 12 Months, 18 Months, <strong>and</strong> 24 Months for Grant Communities Funded in<br />
2002–2004 (continued)<br />
Multi-Sector Service Contacts–Revised (MSSC–R)<br />
Type of Services Utilized (continued)<br />
Innovative<br />
Grant Communities Funded in 2002–2004<br />
Intake<br />
%<br />
6 Months<br />
%<br />
Recreational Activities n/a 27.0%<br />
(n = 2,399)<br />
Family Support n/a 29.0%<br />
(n = 2,394)<br />
Transportation n/a 22.9%<br />
(n = 2,402)<br />
Flexible Funds n/a 20.9%<br />
(n = 2,396)<br />
Behavioral/Therapeutic Aide n/a 12.1%<br />
(n = 2,395)<br />
Family Preservation n/a 10.1%<br />
(n = 2,391)<br />
Respite n/a 10.3%<br />
(n = 2,397)<br />
Transition n/a 3.1%<br />
(n = 2,390)<br />
Independent Living n/a 2.5%<br />
(n = 2,389)<br />
Afterschool Programs n/a 14.6%<br />
(n = 2,397)<br />
12 Months<br />
%<br />
25.4%<br />
(n = 1,584)<br />
25.1%<br />
(n = 1,578)<br />
19.4%<br />
(n = 1,587)<br />
20.5%<br />
(n = 1,578)<br />
9.7%<br />
(n = 1,584)<br />
8.7%<br />
(n = 1,579)<br />
10.9%<br />
(n = 1,585)<br />
3.1%<br />
(n = 1,570)<br />
2.4%<br />
(n = 1,573)<br />
14.5%<br />
(n = 1,588)<br />
18 Months<br />
%<br />
23.0%<br />
(n = 975)<br />
24.3%<br />
(n = 971)<br />
18.2%<br />
(n = 974)<br />
16.3%<br />
(n = 973)<br />
9.0%<br />
(n = 976)<br />
8.3%<br />
(n = 971)<br />
11.1%<br />
(n = 973)<br />
3.3%<br />
(n = 967)<br />
2.3%<br />
(n = 970)<br />
13.2%<br />
(n = 978)<br />
24 Months<br />
%<br />
22.7%<br />
(n = 565)<br />
17.1%<br />
(n = 563)<br />
18.0%<br />
(n = 568)<br />
12.7%<br />
(n = 565)<br />
9.5%<br />
(n = 566)<br />
8.6%<br />
(n = 567)<br />
9.4%<br />
(n = 566)<br />
3.0%<br />
(n = 566)<br />
3.9%<br />
(n = 567)<br />
14.8%<br />
(n = 567)
2006–08 Annual Report to Congress ● Appendix E ● Page 56<br />
The Comprehensive Community <strong>Mental</strong> Health Services for Children <strong>and</strong> Their Families Program <strong>Evaluation</strong> <strong>Findings</strong><br />
Table E-10: Child <strong>and</strong> Family Outcomes at Intake, 6 Months, 12 Months, 18 Months, <strong>and</strong> 24 Months for Grant Communities Funded in<br />
2002–2004 (continued)<br />
Multi-Sector Service Contacts–Revised (MSSC–R)<br />
Type of Services Utilized (continued)<br />
Restrictive<br />
Grant Communities Funded in 2002–2004<br />
Intake<br />
%<br />
6 Months<br />
%<br />
Day Treatment n/a 5.4%<br />
(n = 2,397)<br />
Inpatient Hospitalization n/a 9.0%<br />
(n = 2,403)<br />
Residential Treatment Center n/a 6.4%<br />
(n = 2,404)<br />
Therapeutic Group Home n/a 1.7%<br />
(n = 2,404)<br />
Therapeutic Foster Care n/a 1.9%<br />
(n = 2,402)<br />
Residential Camp n/a 2.7%<br />
(n = 2,399<br />
12 Months<br />
%<br />
a An individual may provide more than one response; therefore, percentages may sum to more than 100%.<br />
b<br />
Includes school in 24-hour hospital setting, 24-hour juvenile justice facility, <strong>and</strong> 24-hour residential treatment setting.<br />
6.4%<br />
(n = 1,584)<br />
8.1%<br />
(n = 1,589)<br />
7.1%<br />
(n = 1,586)<br />
1.4%<br />
(n = 1,586)<br />
2.0%<br />
(n = 1,586)<br />
2.1%<br />
(n = 1,587)<br />
18 Months<br />
%<br />
5.7%<br />
(n = 976)<br />
6.9%<br />
(n = 977)<br />
7.2%<br />
(n = 976)<br />
1.2%<br />
(n = 976)<br />
1.8%<br />
(n = 974)<br />
1.5%<br />
(n = 976)<br />
24 Months<br />
%<br />
5.7%<br />
(n = 976)<br />
6.9%<br />
(n = 977)<br />
7.2%<br />
(n = 976)<br />
1.2%<br />
(n = 976)<br />
1.8%<br />
(n = 974)<br />
1.5%<br />
(n = 976)
2006–08 Annual Report to Congress ● Appendix E ● Page 57<br />
The Comprehensive Community <strong>Mental</strong> Health Services for Children <strong>and</strong> Their Families Program <strong>Evaluation</strong> <strong>Findings</strong><br />
Table E-10: Child <strong>and</strong> Family Outcomes at Intake, 6 Months, 12 Months, 18 Months, <strong>and</strong> 24 Months for Grant Communities Funded in<br />
2002–2004 (continued)<br />
Youth Services Survey for Families (YSS–F)<br />
Grant Communities Funded in 2002–2004<br />
Intake<br />
Mean (SD)<br />
6 Months<br />
Mean (SD)<br />
Caregiver Perception of Services n/a 4.0 (0.7)<br />
(n = 2,293)<br />
Access to Services n/a 4.3 (0.8)<br />
(n = 2,293<br />
Participation in Treatment n/a 4.2 (0.8)<br />
(n = 2,293)<br />
Cultural Sensitivity n/a 4.5 (0.6)<br />
(n = 2,259)<br />
Satisfaction With Services n/a 4. 0 (0.9)<br />
(n = 2,294)<br />
Outcomes n/a 3.5 (1.0)<br />
(n = 2,286)<br />
Youth Services Survey (YSS)<br />
Youth Perception of Services n/a 3.9 (0.7)<br />
(n = 1,423)<br />
Access to Services n/a 3.9 (0.9)<br />
(n = 1,414)<br />
Participation in Treatment n/a 3.6 (0.9)<br />
(n = 1,425)<br />
Cultural Sensitivity n/a 4.3 (0.7)<br />
(n = 1,409)<br />
Satisfaction With Services n/a 3.9 (0.9)<br />
(n = 1,424)<br />
Outcomes n/a 3.9 (0.7)<br />
(n = 1,423)<br />
12 Months<br />
Mean (SD)<br />
4.0 (0.7)<br />
(n = 1,505)<br />
4.3 (0.8)<br />
(n = 1,506)<br />
4.2 (0.8)<br />
(n = 1,506)<br />
4.5 (0.7)<br />
(n = 1,486)<br />
4.0 (0.9)<br />
(n = 1,508)<br />
3.6 (0.9)<br />
(n = 1,504)<br />
4.0 (0.7)<br />
(n = 970)<br />
4.0 (0.9)<br />
(n = 969)<br />
3.7 (0.9)<br />
(n = 972)<br />
4.3 (0.7)<br />
(n = 963)<br />
4.0 (0.8)<br />
(n = 972)<br />
3.9 (0.8)<br />
(n = 973)<br />
18 Months<br />
Mean (SD)<br />
4.0 (0.7)<br />
(n = 898)<br />
4.2 (0.9)<br />
(n = 899)<br />
4.2 (0.8)<br />
(n = 896)<br />
4.4 (0.7)<br />
(n = 888)<br />
4.0 (0.9)<br />
(n = 900)<br />
3.6 (1.0)<br />
(n = 896)<br />
4.0 (0.7)<br />
(n = 621)<br />
3.9 (0.9)<br />
(n = 619)<br />
3.7 (0.9)<br />
(n = 623)<br />
4.3 (0.7)<br />
(n = 620)<br />
4.0 (0.8)<br />
(n = 622)<br />
3.9 (0.7)<br />
(n = 621)<br />
24 Months<br />
Mean (SD)<br />
4.0 (0.7)<br />
(n = 526)<br />
4.2 (1.0)<br />
(n = 527)<br />
4.2 (0.8)<br />
(n = 524)<br />
4.4 (0.7)<br />
(n = 517)<br />
4.0 (0.9)<br />
(n = 526)<br />
3.6 (1.0)<br />
(n = 528)<br />
4.0 (0.6)<br />
(n = 373)<br />
4.0 (0.9)<br />
(n = 371)<br />
3.8 (0.9)<br />
(n = 372)<br />
4.3 (0.7)<br />
(n = 372)<br />
4.0 (0.8)<br />
(n = 373)<br />
3.9 (0.7)<br />
(n = 373)
2006–08 Annual Report to Congress ● Appendix E ● Page 58<br />
The Comprehensive Community <strong>Mental</strong> Health Services for Children <strong>and</strong> Their Families Program <strong>Evaluation</strong> <strong>Findings</strong><br />
Table E-10: Child <strong>and</strong> Family Outcomes at Intake, 6 Months, 12 Months, 18 Months, <strong>and</strong> 24 Months for Grant Communities Funded in<br />
2002–2004 (continued)<br />
Cultural Competence <strong>and</strong> Service Provision (CCSP)<br />
Grant Communities Funded in 2002–2004<br />
Intake<br />
Mean (SD)<br />
6 Months<br />
Mean (SD)<br />
Importance of Provider‘s Underst<strong>and</strong>ing of Family‘s Culture n/a 2.8 (1.2)<br />
(n = 2,579)<br />
Frequency of Provider‘s Culturally Competent Practices n/a 4.6 (0.6)<br />
(n = 2,312)<br />
Overall n/a 4.0 (0.8)<br />
(n = 2,582)<br />
12 Months<br />
Mean (SD)<br />
2.8 (1.2)<br />
(n = 1,951)<br />
4.6 (0.6)<br />
(n = 1,507)<br />
3.9 (0.9)<br />
(n = 1,954)<br />
18 Months<br />
Mean (SD)<br />
2.7 (1.2)<br />
(n = 953)<br />
4.6 (0.6)<br />
(n = 893)<br />
3.6 (1.1)<br />
(n = 1,386)<br />
24 Months<br />
Mean (SD)<br />
2.7 (1.2)<br />
(n = 951)<br />
4.5 (0.7)<br />
(n = 518)<br />
3.5 (1.2)<br />
(n = 953)
2006–08 Annual Report to Congress ● Appendix E ● Page 59<br />
The Comprehensive Community <strong>Mental</strong> Health Services for Children <strong>and</strong> Their Families Program <strong>Evaluation</strong> <strong>Findings</strong><br />
Table E-11: Child <strong>and</strong> Family Outcomes at Intake <strong>and</strong> 6 Months for Grant Communities Funded in 2005–2006<br />
Child Behavior Checklist (CBCL 1½–5)<br />
Grant Communities Funded in 2005–2006<br />
Intake<br />
Mean (SD)<br />
Emotionally Reactive 65.2 (11.5)<br />
(n = 296)<br />
Sleep Problems 61.7 (12.2)<br />
(n = 296)<br />
Withdrawn 63.6 (10.5)<br />
(n = 296)<br />
Somatic Complaints 58.3 (8.4)<br />
(n = 296)<br />
Anxious/Depressed 62.3 (10.5)<br />
(n = 296)<br />
Attention Problems 63.2 (9.1)<br />
(n = 296)<br />
Aggressive Problems 70.1 (13.6)<br />
(n = 296)<br />
Internalizing Problems 63.5 (10.2)<br />
(n = 296)<br />
Externalizing Problems 68.1 (12.9)<br />
(n = 296)<br />
Total Problems 66.9 (11.4)<br />
(n = 296)<br />
At/Above Clinical Level 59.8%<br />
(n = 296)<br />
6 Months<br />
Mean (SD)<br />
62.6 (11.1)<br />
(n = 114)<br />
57.9 (10.0)<br />
(n = 114)<br />
60.6 (9.5)<br />
(n = 114)<br />
57.2 (7.8)<br />
(n = 114)<br />
60.3 (9.6)<br />
(n = 114)<br />
61.3 (9.0)<br />
(n = 114)<br />
65.3 (12.1)<br />
(n = 112)<br />
60.4 (11.5)<br />
(n = 114)<br />
63.2 (12.6)<br />
(n = 114)<br />
62.5 (12.0)<br />
(n = 114)<br />
51.8%<br />
(n = 114)
2006–08 Annual Report to Congress ● Appendix E ● Page 60<br />
The Comprehensive Community <strong>Mental</strong> Health Services for Children <strong>and</strong> Their Families Program <strong>Evaluation</strong> <strong>Findings</strong><br />
Table E-11: Child <strong>and</strong> Family Outcomes at Intake <strong>and</strong> 6 Months for Grant Communities Funded in 2005–2006 (continued)<br />
Child Behavior Checklist (CBCL 6–18)<br />
Grant Communities Funded in 2005–2006<br />
Intake<br />
Mean (SD)<br />
Activities Competence 37.9 (9.5)<br />
(n = 1,074)<br />
Social Competence 37.6 (9.2)<br />
(n = 1,046)<br />
School Competence 36.7 (8.2)<br />
(n = 967)<br />
Total Competence 32.8 (8.6)<br />
(n = 921)<br />
Anxious/Depressed 65.6 (11.0)<br />
(n = 1,093)<br />
Withdrawn 66.0 (10.0)<br />
(n = 1,093)<br />
Somatic Complaints 61.7 (9.4)<br />
(n = 1,093)<br />
Social Problems 66.5 (9.8)<br />
(n = 1,093)<br />
Thought Problems 67.5 (10.0)<br />
(n = 1,093)<br />
Attention Problems 68.6 (10.9)<br />
(n = 1,093)<br />
Rule-Breaking Behavior 68.0 (9.1)<br />
(n = 1,093)<br />
Aggressive Behavior 72.4 (12.4)<br />
(n = 1,093)<br />
Internalizing 65.7 (10.2)<br />
(n = 1,093)<br />
Externalizing 70.0 (9.9)<br />
(n = 1,093)<br />
Total Problem 69.8 (9.6)<br />
(n = 1,093)<br />
Clinical Level (Total Problems) 80.1%<br />
(n = 1,093)<br />
6 Months<br />
Mean (SD)<br />
36.7 (9.1)<br />
(n = 467)<br />
37.9 (9.0)<br />
(n = 458)<br />
37.4 (8.5)<br />
(n = 424)<br />
32.3 (8.6)<br />
(n = 402)<br />
63.6 (10.7)<br />
(n = 476)<br />
65.0 (10.5)<br />
(n = 476)<br />
60.9 (9.6)<br />
(n = 476)<br />
65.5 (10.1)<br />
(n = 476)<br />
66.0 (10.1)<br />
(n = 476)<br />
66.6 (10.1)<br />
(n = 476)<br />
66.4 (8.8)<br />
(n = 476)<br />
70.1 (11.9)<br />
(n = 476)<br />
63.9 (10.7)<br />
(n = 476)<br />
68.0 (10.1)<br />
(n = 476)<br />
68.0 (9.8)<br />
(n = 476)<br />
74.6%<br />
(n = 476)
2006–08 Annual Report to Congress ● Appendix E ● Page 61<br />
The Comprehensive Community <strong>Mental</strong> Health Services for Children <strong>and</strong> Their Families Program <strong>Evaluation</strong> <strong>Findings</strong><br />
Table E-11: Child <strong>and</strong> Family Outcomes at Intake <strong>and</strong> 6 Months for Grant Communities Funded in 2005–2006 (continued)<br />
Behavioral <strong>and</strong> Emotional Rating Scale–2, Caregiver<br />
(BERS–2C)<br />
Grant Communities Funded in 2005–2006<br />
Intake<br />
Mean (SD)<br />
Intrapersonal Strengths 7.7 (3.3)<br />
(n = 1,156)<br />
Interpersonal Strengths 6.5 (3.0)<br />
(n = 1,160)<br />
School Functioning 6.3 (2.9)<br />
(n = 1,106)<br />
Family Involvement 7.0 (2.9)<br />
(n = 1,164)<br />
Affective Strengths 7.9 (3.0)<br />
(n = 1,165)<br />
Career Strengths 8.9 (3.6)<br />
(n = 910)<br />
Strengths Quotient 79.6 (17.1)<br />
(n = 1,097)<br />
Behavioral <strong>and</strong> Emotional Rating Scale–2, Youth<br />
(BERS–2Y)<br />
Intrapersonal Strengths 9.4 (3.0)<br />
(n = 762)<br />
Interpersonal Strengths 8.5 (3.3)<br />
(n = 761)<br />
School Functioning 8.3 (3.1)<br />
(n = 759)<br />
Family Involvement 8.8 (3.0)<br />
(n = 762)<br />
Affective Strengths 9.7 (3.0)<br />
(n = 763)<br />
Career Strengths 9.6 (2.9)<br />
(n = 711)<br />
Strengths Quotient 92.4 (16.9)<br />
(n = 757)<br />
6 Months<br />
Mean (SD)<br />
7.9 (3.3)<br />
(n = 518)<br />
6.9 (3.0)<br />
(n = 518)<br />
6.7 (2.9)<br />
(n = 490)<br />
7.2 (2.8)<br />
(n = 518)<br />
8.1 (3.0)<br />
(n = 519)<br />
8.9 (3.4)<br />
(n = 427)<br />
81.7 (17.0)<br />
(n = 489)<br />
9.3 (2.9)<br />
(n = 323)<br />
8.8 (3.3)<br />
(n = 322)<br />
8.6 (3.1)<br />
(n = 314)<br />
9.0 (2.9)<br />
(n = 322)<br />
9.8 (3.0)<br />
(n = 323)<br />
9.7 (2.7)<br />
(n = 312)<br />
93.5 (16.9)<br />
(n = 313)
2006–08 Annual Report to Congress ● Appendix E ● Page 62<br />
The Comprehensive Community <strong>Mental</strong> Health Services for Children <strong>and</strong> Their Families Program <strong>Evaluation</strong> <strong>Findings</strong><br />
Table E-11: Child <strong>and</strong> Family Outcomes at Intake <strong>and</strong> 6 Months for Grant Communities Funded in 2005–2006 (continued)<br />
Columbia Impairment Scale (CIS)<br />
Grant Communities Funded in 2005–2006<br />
Intake<br />
Mean (SD)<br />
Overall Level of Impairment 22.6 (10.7)<br />
(n = 1,364)<br />
6 Months<br />
Mean (SD)<br />
20.5 (10.4)<br />
(n = 564)<br />
Clinical Level 75.5% 68.4%<br />
Revised Children’s Manifest Anxiety Scale (RCMAS)<br />
Worry/Oversensitivity 10.1 (3.6)<br />
(n = 752)<br />
Social Concerns/Concentration 10.9 (3.2)<br />
(n = 720)<br />
Physiological Anxietyi8 11.3 (3.4)<br />
(n = 755)<br />
Total Anxiety 54.3 (12.3)<br />
(n = 752)<br />
Clinical Level 30.9%<br />
(n = 752)<br />
Reynolds Adolescent Depression Scale–2 (RADS–2)<br />
Dysphoric Mood 50.4 (10.9)<br />
(n = 781)<br />
Anhedonia/Negative Affect 51.1 (8.0)<br />
(n = 778)<br />
Negative Self-<strong>Evaluation</strong> 53.3 (10.6)<br />
(n = 777)<br />
Somatic Complaints 52.4 (10.5)<br />
(n = 782)<br />
Total Depression 52.4 (10.4)<br />
(n = 781)<br />
Clinical Level (Total Depression) 22.2%<br />
(n = 781)<br />
10.1 (3.6)<br />
(n = 322)<br />
10.9 (3.4)<br />
(n = 305)<br />
11.3 (3.6)<br />
(n = 326)<br />
54.2 (13.1)<br />
(n = 321)<br />
33.3%<br />
(n = 321)<br />
50.7 (11.3)<br />
(n = 324)<br />
51.0 (8.0)<br />
(n = 322)<br />
52.8 (10.8)<br />
(n = 323)<br />
51.4 (11.2)<br />
(n = 325)<br />
52.0 (10.8)<br />
(n = 325)<br />
21.2%<br />
(n = 325)
2006–08 Annual Report to Congress ● Appendix E ● Page 63<br />
The Comprehensive Community <strong>Mental</strong> Health Services for Children <strong>and</strong> Their Families Program <strong>Evaluation</strong> <strong>Findings</strong><br />
Table E-11: Child <strong>and</strong> Family Outcomes at Intake <strong>and</strong> 6 Months for Grant Communities Funded in 2005–2006 (continued)<br />
Caregiver Strain Questionnaire (CGSQ)<br />
Grant Communities Funded in 2005–2006<br />
Intake<br />
Mean (SD)<br />
Subjective Externalizing Strain 2.3 (1.0)<br />
(n = 1,444)<br />
Subjective Internalizing Strain 3.5 (1.1)<br />
(n = 1,442)<br />
Objective Strain 2.6 (1.1)<br />
(n = 1,446)<br />
Global Strain 8.4 (2.8)<br />
(n = 1,440)<br />
Family Life Questionnaire (FLQ)<br />
Family Functioning Scale 3.4 (0.7)<br />
(n = 1,441)<br />
6 Months<br />
Mean (SD)<br />
2.1 (1.0)<br />
(n = 574)<br />
3.2 (1.0)<br />
(n = 574)<br />
2.4 (1.0)<br />
(n = 572)<br />
7.7 (2.6)<br />
(n = 572)<br />
3.4 (0.7)<br />
(n = 577)
2006–08 Annual Report to Congress ● Appendix E ● Page 64<br />
The Comprehensive Community <strong>Mental</strong> Health Services for Children <strong>and</strong> Their Families Program <strong>Evaluation</strong> <strong>Findings</strong><br />
Table E-11: Child <strong>and</strong> Family Outcomes at Intake <strong>and</strong> 6 Months for Grant Communities Funded in 2005–2006 (continued)<br />
Living Situations Questionnaire (LSQ)<br />
Grant Communities Funded in 2005–2006<br />
Intake<br />
%<br />
6 Months<br />
%<br />
Type of Living Arrangements a (n = 1,433) (n = 589)<br />
Homeless 1.6% 1.2%<br />
Home 95.3% 91.9%<br />
School Dormitory 0.1% 0.0%<br />
Recreational Camp 0.1% 0.2%<br />
Emergency Shelter 1.3% 1.5%<br />
Foster Home 4.0% 3.7%<br />
Therapeutic/Specialized Foster Home 0.5% 0.7%<br />
Group Home 2.7% 1.7%<br />
Medical Hospital 0.8% 0.3%<br />
Residential Treatment Center 4.0% 5.6%<br />
Psychiatric Hospital 5.6% 3.1%<br />
Youth Justice Related 5.6% 5.4%<br />
Adult Justice Related 0.3% 0.5%<br />
Other 2.3% 5.6%<br />
Stability in Living Arrangements (n = 1,433) (n = 573)<br />
One Living Arrangement 68.8% 74.3%<br />
Multiple Living Arrangements 31.2% 25.7%
2006–08 Annual Report to Congress ● Appendix E ● Page 65<br />
The Comprehensive Community <strong>Mental</strong> Health Services for Children <strong>and</strong> Their Families Program <strong>Evaluation</strong> <strong>Findings</strong><br />
Table E-11: Child <strong>and</strong> Family Outcomes at Intake <strong>and</strong> 6 Months for Grant Communities Funded in 2005–2006 (continued)<br />
Education Questionnaire–Revised (EQ–R)<br />
Grant Communities Funded in 2005–2006<br />
Intake<br />
%<br />
Attending School 91.8%<br />
(n = 1,452)<br />
6 Months<br />
%<br />
93.6%<br />
(n = 596)<br />
Excused <strong>and</strong> Unexcused Absences (n = 1,199) (n = 510)<br />
No Absences 14.8% 13.7%<br />
Less Than 1 Day Per Month 23.9% 30.2%<br />
About 1 Day a Month 18.3% 22.0%<br />
About 1 Day Every 2 Weeks 14.4% 12.9%<br />
About 1 Day a Week 9.3% 10.8%<br />
2 Days Per Week 7.5% 5.5%<br />
3 or More Days Per Week 11.7% 4.9%<br />
Educational Placement (n = 1,217) (n = 518)<br />
Public Day School 83.6% 79.2%<br />
Private Day/Boarding School 2.5% 3.3%<br />
Home School 1.8% 2.1%<br />
Alternative/Special Day School 18.1% 17.0%<br />
School in 24-Hour Restrictive Setting b 6.2% 5.6%<br />
Other 4.8% 4.2%<br />
School Performance (n = 1,160) (n = 500)<br />
Grade Average A 6.0% 5.4%<br />
Grade Average B 17.7% 21.6%<br />
Grade Average C 21.5% 21.8%<br />
Grade Average D 8.4% 6.6%<br />
Failing All or Most Classes 20.7% 16.2%<br />
School Does Not Grade 22.2% 26.6%<br />
Other 3.5% 1.8%
2006–08 Annual Report to Congress ● Appendix E ● Page 66<br />
The Comprehensive Community <strong>Mental</strong> Health Services for Children <strong>and</strong> Their Families Program <strong>Evaluation</strong> <strong>Findings</strong><br />
Table E-11: Child <strong>and</strong> Family Outcomes at Intake <strong>and</strong> 6 Months for Grant Communities Funded in 2005–2006 (continued)<br />
Education Questionnaire–Revised (EQ–R)<br />
Grant Communities Funded in 2005–2006<br />
Intake<br />
%<br />
Individualized Education Plan (IEP) (n = 1,195)<br />
53.6%<br />
6 Months<br />
%<br />
(n = 512)<br />
59.0%<br />
Reasons for IEP a (n = 639) (n = 299)<br />
Behavior/Emotional Problems 72.8% 78.9%<br />
Learning Disability 51.6% 47.5%<br />
Physical Disability 4.2% 3.7%<br />
Developmental Disability or <strong>Mental</strong> Retardation 15.6% 13.0%<br />
Vision Impairment 3.1% 3.7%<br />
Speech Impairment 17.7% 18.4%<br />
Other 7.0% 6.4%<br />
Type of Special Education Placements a (n = 514) (n = 247)<br />
Special Class All or Most of the Day 46.3% 46.2%<br />
Special Class for a Portion of the Day 31.9% 33.2%<br />
Special Instruction As Part of a General Education Class 26.1% 27.5%<br />
Disciplinary Actions (n = 1,179) (n = 502)<br />
None 57.2% 66.7%<br />
Suspended 38.2% 30.7%<br />
Expelled 1.4% 0.2%<br />
Suspended <strong>and</strong> Expelled 3.2% 2.4%
2006–08 Annual Report to Congress ● Appendix E ● Page 67<br />
The Comprehensive Community <strong>Mental</strong> Health Services for Children <strong>and</strong> Their Families Program <strong>Evaluation</strong> <strong>Findings</strong><br />
Table E-11: Child <strong>and</strong> Family Outcomes at Intake <strong>and</strong> 6 Months for Grant Communities Funded in 2005–2006 (continued)<br />
Delinquency Survey–Revised (DS–R)<br />
Juvenile Justice Contacts<br />
Grant Communities Funded in 2005–2006<br />
Intake<br />
%<br />
Questioned by Police 27.6%<br />
(n = 732)<br />
Arrested 20.6%<br />
(n = 732)<br />
Told to Appear in Court 26.0%<br />
(n = 732)<br />
Convicted of a Crime 15.2%<br />
(n = 732)<br />
On Probation 31.1%<br />
(n = 731)<br />
Sentenced to Secure Facility 13.9%<br />
(n = 728)<br />
<strong>Substance</strong> Problem Urgency (GAIN)<br />
6 Months<br />
%<br />
91.7%<br />
(n = 303)<br />
81.8%<br />
(n = 303)<br />
87.5%<br />
(n = 303)<br />
40.5%<br />
(n = 74)<br />
70.9%<br />
(n = 117)<br />
56.1%<br />
(n = 57)<br />
<strong>Substance</strong> Use <strong>and</strong> <strong>Abuse</strong> Scale (SUS–9) (n = 263) (n = 91)<br />
Mean (SD) 3.1 (2.4) 3.1 (2.4)<br />
Minimal/No Urgency 42.9% 47.7%<br />
Moderate Urgency 48.4% 40.9%<br />
High Urgency 8.7% 11.4%<br />
<strong>Substance</strong> Dependence Scale (SUS–7) (n = 262) (n = 91)<br />
Mean (SD) 1.7 (1.9) 1.7 (1.9)<br />
Minimal/No Urgency 56.6% 60.2%<br />
Moderate Urgency 37.5% 33.0%<br />
High Urgency 6.0% 6.8%
2006–08 Annual Report to Congress ● Appendix E ● Page 68<br />
The Comprehensive Community <strong>Mental</strong> Health Services for Children <strong>and</strong> Their Families Program <strong>Evaluation</strong> <strong>Findings</strong><br />
Table E-11: Child <strong>and</strong> Family Outcomes at Intake <strong>and</strong> 6 Months for Grant Communities Funded in 2005–2006 (continued)<br />
<strong>Substance</strong> Problem Urgency (GAIN)<br />
Grant Communities Funded in 2005–2006<br />
Intake<br />
%<br />
6 Months<br />
%<br />
<strong>Substance</strong> Problem Scale (SPS) (n = 263) (n = 91)<br />
Mean (SD) 4.8 (3.9) 4.8 (4.0)<br />
Minimal/No Urgency 44.8% 46.6%<br />
Moderate Urgency 47.2% 43.2%<br />
High Urgency 7.9% 10.2%<br />
Multi-Sector Service Contacts–Revised (MSSC–R)<br />
Number of Different Services Utilized (n = 538)<br />
Mean (SD) n/a 5.6 (2.9)<br />
1–3 n/a 24.9%<br />
4–6 n/a 40.5%<br />
7–9 n/a 25.7%<br />
10 or more n/a 8.9%
2006–08 Annual Report to Congress ● Appendix E ● Page 69<br />
The Comprehensive Community <strong>Mental</strong> Health Services for Children <strong>and</strong> Their Families Program <strong>Evaluation</strong> <strong>Findings</strong><br />
Table E-11: Child <strong>and</strong> Family Outcomes at Intake <strong>and</strong> 6 Months for Grant Communities Funded in 2005–2006 (continued)<br />
Multi-Sector Service Contacts–Revised (MSSC–R)<br />
Type of Services Utilized<br />
Traditional<br />
Grant Communities Funded in 2005–2006<br />
Intake<br />
%<br />
6 Months<br />
%<br />
Individual Therapy n/a 70.9%<br />
(n = 540)<br />
Case Management n/a 57.9%<br />
(n = 534)<br />
Assessment or <strong>Evaluation</strong> n/a 61.5%<br />
(n = 535)<br />
Medication Treatment/Monitoring n/a 45.8%<br />
(n = 533)<br />
Family Therapy n/a 31.4%<br />
(n = 538)<br />
Group Therapy n/a 26.0%<br />
(n = 535)<br />
Crisis Stabilization n/a 15.0%<br />
(n = 532)
2006–08 Annual Report to Congress ● Appendix E ● Page 70<br />
The Comprehensive Community <strong>Mental</strong> Health Services for Children <strong>and</strong> Their Families Program <strong>Evaluation</strong> <strong>Findings</strong><br />
Table E-11: Child <strong>and</strong> Family Outcomes at Intake <strong>and</strong> 6 Months for Grant Communities Funded in 2005–2006 (continued)<br />
Multi-Sector Service Contacts–Revised (MSSC–R)<br />
Type of Services Utilized (continued)<br />
Innovative<br />
Grant Communities Funded in 2005–2006<br />
Intake<br />
%<br />
6 Months<br />
%<br />
Recreational Activities n/a 32.6%<br />
(n = 534)<br />
Family Support n/a 34.9%<br />
(n = 536)<br />
Transportation n/a 25.4%<br />
(n = 536)<br />
Flexible Funds n/a 25.5%<br />
(n = 537)<br />
Behavioral/Therapeutic Aide n/a 21.2%<br />
(n = 533)<br />
Family Preservation n/a 10.8%<br />
(n = 527)<br />
Respite n/a 10.3%<br />
(n = 533)<br />
Transition n/a 1.5%<br />
(n = 532)<br />
Independent Living n/a 1.3%<br />
(n = 529)<br />
Afterschool Programs n/a 16.6%<br />
(n = 531)<br />
Informal Support n/a 47.2%<br />
(n = 532)<br />
Vocational Training n/a 1.7%<br />
(n = 531)
2006–08 Annual Report to Congress ● Appendix E ● Page 71<br />
The Comprehensive Community <strong>Mental</strong> Health Services for Children <strong>and</strong> Their Families Program <strong>Evaluation</strong> <strong>Findings</strong><br />
Table E-11: Child <strong>and</strong> Family Outcomes at Intake <strong>and</strong> 6 Months for Grant Communities Funded in 2005–2006 (continued)<br />
Multi-Sector Service Contacts–Revised (MSSC–R)<br />
Type of Services Utilized (continued)<br />
Restrictive<br />
Grant Communities Funded in 2005–2006<br />
Intake<br />
%<br />
6 Months<br />
%<br />
Day Treatment n/a 5.8%<br />
(n = 532)<br />
Inpatient Hospitalization n/a 8.2%<br />
(n = 535)<br />
Residential Treatment Center n/a 6.9%<br />
(n = 535)<br />
Therapeutic Group Home n/a 2.1%<br />
(n = 536)<br />
Therapeutic Foster Care n/a 1.7%<br />
(n = 536)<br />
Residential Camp n/a 1.7%<br />
(n = 535)<br />
a<br />
An individual may provide more than one response; therefore, percentages may sum to more than 100%.<br />
b<br />
Includes school in 24-hour hospital setting, 24-hour juvenile justice facility, <strong>and</strong> 24-hour residential treatment setting.
2006–08 Annual Report to Congress ● Appendix E ● Page 72<br />
The Comprehensive Community <strong>Mental</strong> Health Services for Children <strong>and</strong> Their Families Program <strong>Evaluation</strong> <strong>Findings</strong><br />
Table E-11: Child <strong>and</strong> Family Outcomes at Intake <strong>and</strong> 6 Months for Grant Communities Funded in 2005–2006 (continued)<br />
Youth Services Survey for Families (YSS–F)<br />
Grant Communities Funded in 2005–2006<br />
Intake<br />
Mean (SD)<br />
6 Months<br />
Mean (SD)<br />
Caregiver Overall Perception of Services n/a 4.0 (0.7)<br />
(n = 499)<br />
Access to Services n/a 4.2 (0.8)<br />
(n = 498)<br />
Participation in Treatment n/a 4.2 (0.7)<br />
(n = 499)<br />
Cultural Sensitivity n/a 4.4 (0.6)<br />
(n = 482)<br />
Satisfaction With Services n/a 4.0 (0.9)<br />
(n = 499)<br />
Outcomes n/a 3.5 (.9)<br />
(n = 498)
2006–08 Annual Report to Congress ● Appendix E ● Page 73<br />
The Comprehensive Community <strong>Mental</strong> Health Services for Children <strong>and</strong> Their Families Program <strong>Evaluation</strong> <strong>Findings</strong><br />
Table E-11: Child <strong>and</strong> Family Outcomes at Intake <strong>and</strong> 6 Months for Grant Communities Funded in 2005–2006 (continued)<br />
Youth Services Survey (YSS)<br />
Grant Communities Funded in 2005–2006<br />
Intake<br />
Mean (SD)<br />
6 Months<br />
Mean (SD)<br />
Youth Overall Perception of Services n/a 3.9 (0.6)<br />
(n = 276)<br />
Access to Services n/a 3.9 (0.9)<br />
(n = 274)<br />
Participation in Treatment n/a 3.6 (0.9)<br />
(n = 275)<br />
Cultural Sensitivity n/a 4.2 (0.7)<br />
(n = 272)<br />
Satisfaction With Services n/a 3.9 (0.8)<br />
(n = 277)<br />
Outcomes n/a 3.8 (0.7)<br />
(n = 276)<br />
Cultural Competence <strong>and</strong> Service Provision (CCSP)<br />
Importance of Provider‘s Underst<strong>and</strong>ing of Family‘s Culture n/a 2.7 (1.2)<br />
(n = 469)<br />
Frequency of Provider‘s Culturally Competent Practices n/a 4.6 (0.6)<br />
(n = 398)
PEP12-CMHI0608