lab enzyme catalysis - Explore Biology
lab enzyme catalysis - Explore Biology
lab enzyme catalysis - Explore Biology

You also want an ePaper? Increase the reach of your titles
YUMPU automatically turns print PDFs into web optimized ePapers that Google loves.
Name __________________________________<br />
Period _________<br />
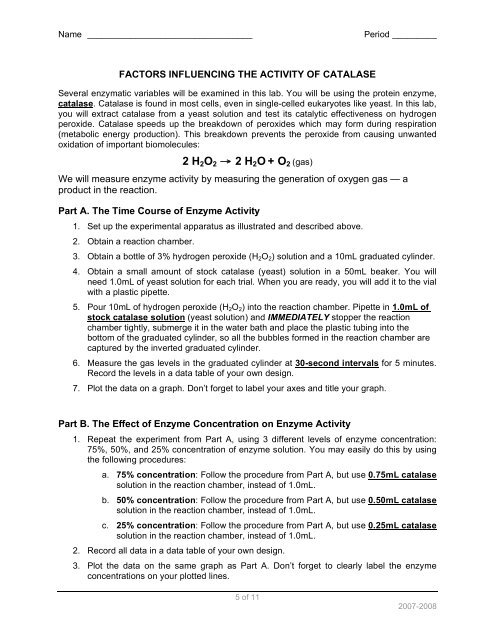
FACTORS INFLUENCING THE ACTIVITY OF CATALASE<br />
Several enzymatic variables will be examined in this <strong>lab</strong>. You will be using the protein <strong>enzyme</strong>,<br />
catalase. Catalase is found in most cells, even in single-celled eukaryotes like yeast. In this <strong>lab</strong>,<br />
you will extract catalase from a yeast solution and test its catalytic effectiveness on hydrogen<br />
peroxide. Catalase speeds up the breakdown of peroxides which may form during respiration<br />
(metabolic energy production). This breakdown prevents the peroxide from causing unwanted<br />
oxidation of important biomolecules:<br />
2 H 2 O 2 → 2 H 2 O + O 2 (gas)<br />
We will measure <strong>enzyme</strong> activity by measuring the generation of oxygen gas — a<br />
product in the reaction.<br />
Part A. The Time Course of Enzyme Activity<br />
1. Set up the experimental apparatus as illustrated and described above.<br />
2. Obtain a reaction chamber.<br />
3. Obtain a bottle of 3% hydrogen peroxide (H 2 O 2 ) solution and a 10mL graduated cylinder.<br />
4. Obtain a small amount of stock catalase (yeast) solution in a 50mL beaker. You will<br />
need 1.0mL of yeast solution for each trial. When you are ready, you will add it to the vial<br />
with a plastic pipette.<br />
5. Pour 10mL of hydrogen peroxide (H 2 O 2 ) into the reaction chamber. Pipette in 1.0mL of<br />
stock catalase solution (yeast solution) and IMMEDIATELY stopper the reaction<br />
chamber tightly, submerge it in the water bath and place the plastic tubing into the<br />
bottom of the graduated cylinder, so all the bubbles formed in the reaction chamber are<br />
captured by the inverted graduated cylinder.<br />
6. Measure the gas levels in the graduated cylinder at 30-second intervals for 5 minutes.<br />
Record the levels in a data table of your own design.<br />
7. Plot the data on a graph. Don’t forget to <strong>lab</strong>el your axes and title your graph.<br />
Part B. The Effect of Enzyme Concentration on Enzyme Activity<br />
1. Repeat the experiment from Part A, using 3 different levels of <strong>enzyme</strong> concentration:<br />
75%, 50%, and 25% concentration of <strong>enzyme</strong> solution. You may easily do this by using<br />
the following procedures:<br />
a. 75% concentration: Follow the procedure from Part A, but use 0.75mL catalase<br />
solution in the reaction chamber, instead of 1.0mL.<br />
b. 50% concentration: Follow the procedure from Part A, but use 0.50mL catalase<br />
solution in the reaction chamber, instead of 1.0mL.<br />
c. 25% concentration: Follow the procedure from Part A, but use 0.25mL catalase<br />
solution in the reaction chamber, instead of 1.0mL.<br />
2. Record all data in a data table of your own design.<br />
3. Plot the data on the same graph as Part A. Don’t forget to clearly <strong>lab</strong>el the <strong>enzyme</strong><br />
concentrations on your plotted lines.<br />
5 of 11<br />
2007-2008