lab enzyme catalysis - Explore Biology
lab enzyme catalysis - Explore Biology
lab enzyme catalysis - Explore Biology
You also want an ePaper? Increase the reach of your titles
YUMPU automatically turns print PDFs into web optimized ePapers that Google loves.
Name __________________________________<br />
Period _________<br />
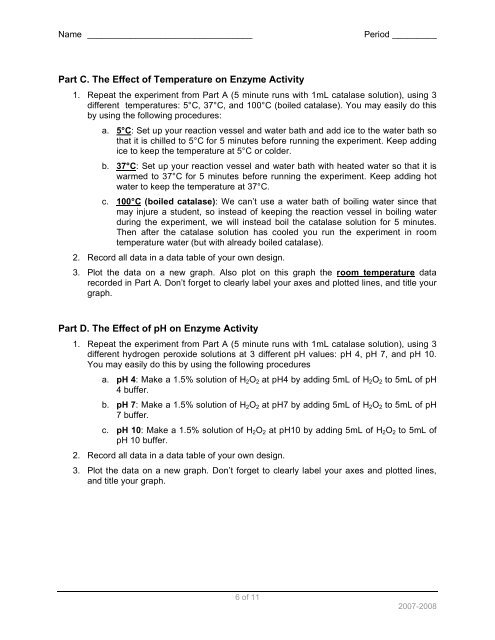
Part C. The Effect of Temperature on Enzyme Activity<br />
1. Repeat the experiment from Part A (5 minute runs with 1mL catalase solution), using 3<br />
different temperatures: 5°C, 37°C, and 100°C (boiled catalase). You may easily do this<br />
by using the following procedures:<br />
a. 5°C: Set up your reaction vessel and water bath and add ice to the water bath so<br />
that it is chilled to 5°C for 5 minutes before running the experiment. Keep adding<br />
ice to keep the temperature at 5°C or colder.<br />
b. 37°C: Set up your reaction vessel and water bath with heated water so that it is<br />
warmed to 37°C for 5 minutes before running the experiment. Keep adding hot<br />
water to keep the temperature at 37°C.<br />
c. 100°C (boiled catalase): We can’t use a water bath of boiling water since that<br />
may injure a student, so instead of keeping the reaction vessel in boiling water<br />
during the experiment, we will instead boil the catalase solution for 5 minutes.<br />
Then after the catalase solution has cooled you run the experiment in room<br />
temperature water (but with already boiled catalase).<br />
2. Record all data in a data table of your own design.<br />
3. Plot the data on a new graph. Also plot on this graph the room temperature data<br />
recorded in Part A. Don’t forget to clearly <strong>lab</strong>el your axes and plotted lines, and title your<br />
graph.<br />
Part D. The Effect of pH on Enzyme Activity<br />
1. Repeat the experiment from Part A (5 minute runs with 1mL catalase solution), using 3<br />
different hydrogen peroxide solutions at 3 different pH values: pH 4, pH 7, and pH 10.<br />
You may easily do this by using the following procedures<br />
a. pH 4: Make a 1.5% solution of H 2 O 2 at pH4 by adding 5mL of H 2 O 2 to 5mL of pH<br />
4 buffer.<br />
b. pH 7: Make a 1.5% solution of H 2 O 2 at pH7 by adding 5mL of H 2 O 2 to 5mL of pH<br />
7 buffer.<br />
c. pH 10: Make a 1.5% solution of H 2 O 2 at pH10 by adding 5mL of H 2 O 2 to 5mL of<br />
pH 10 buffer.<br />
2. Record all data in a data table of your own design.<br />
3. Plot the data on a new graph. Don’t forget to clearly <strong>lab</strong>el your axes and plotted lines,<br />
and title your graph.<br />
6 of 11<br />
2007-2008


