Lamb wave assessment of fiber volume fraction in composites
Lamb wave assessment of fiber volume fraction in composites
Lamb wave assessment of fiber volume fraction in composites

Create successful ePaper yourself
Turn your PDF publications into a flip-book with our unique Google optimized e-Paper software.
<strong>Lamb</strong> <strong>wave</strong> <strong>assessment</strong> <strong>of</strong> <strong>fiber</strong> <strong>volume</strong> <strong>fraction</strong> <strong>in</strong> <strong>composites</strong><br />
Michael D. Seale a)<br />
Department <strong>of</strong> Physics, The College <strong>of</strong> William and Mary, Williamsburg, Virg<strong>in</strong>ia 23187<br />
Barry T. Smith<br />
Norfolk Academy, 1585 Wesleyan Drive, Norfolk, Virg<strong>in</strong>ia 23502<br />
W. H. Prosser and Joseph N. Zalameda b)<br />
NASA Langley Research Center, Mail Stop 231, Hampton, Virg<strong>in</strong>ia 23681<br />
Received 12 December 1997; accepted for publication 6 June 1998<br />
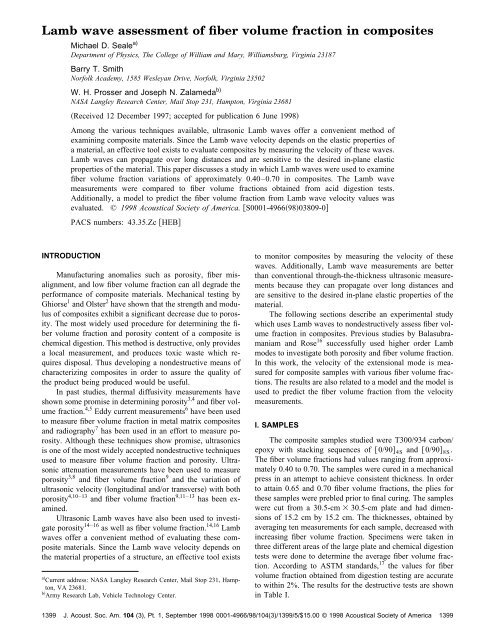
Among the various techniques available, ultrasonic <strong>Lamb</strong> <strong>wave</strong>s <strong>of</strong>fer a convenient method <strong>of</strong><br />
exam<strong>in</strong><strong>in</strong>g composite materials. S<strong>in</strong>ce the <strong>Lamb</strong> <strong>wave</strong> velocity depends on the elastic properties <strong>of</strong><br />
a material, an effective tool exists to evaluate <strong>composites</strong> by measur<strong>in</strong>g the velocity <strong>of</strong> these <strong>wave</strong>s.<br />
<strong>Lamb</strong> <strong>wave</strong>s can propagate over long distances and are sensitive to the desired <strong>in</strong>-plane elastic<br />
properties <strong>of</strong> the material. This paper discusses a study <strong>in</strong> which <strong>Lamb</strong> <strong>wave</strong>s were used to exam<strong>in</strong>e<br />
<strong>fiber</strong> <strong>volume</strong> <strong>fraction</strong> variations <strong>of</strong> approximately 0.40–0.70 <strong>in</strong> <strong>composites</strong>. The <strong>Lamb</strong> <strong>wave</strong><br />
measurements were compared to <strong>fiber</strong> <strong>volume</strong> <strong>fraction</strong>s obta<strong>in</strong>ed from acid digestion tests.<br />
Additionally, a model to predict the <strong>fiber</strong> <strong>volume</strong> <strong>fraction</strong> from <strong>Lamb</strong> <strong>wave</strong> velocity values was<br />
evaluated. © 1998 Acoustical Society <strong>of</strong> America. S0001-49669803809-0<br />
PACS numbers: 43.35.Zc HEB<br />
INTRODUCTION<br />
Manufactur<strong>in</strong>g anomalies such as porosity, <strong>fiber</strong> misalignment,<br />
and low <strong>fiber</strong> <strong>volume</strong> <strong>fraction</strong> can all degrade the<br />
performance <strong>of</strong> composite materials. Mechanical test<strong>in</strong>g by<br />
Ghiorse 1 and Olster 2 have shown that the strength and modulus<br />
<strong>of</strong> <strong>composites</strong> exhibit a significant decrease due to porosity.<br />
The most widely used procedure for determ<strong>in</strong><strong>in</strong>g the <strong>fiber</strong><br />
<strong>volume</strong> <strong>fraction</strong> and porosity content <strong>of</strong> a composite is<br />
chemical digestion. This method is destructive, only provides<br />
a local measurement, and produces toxic waste which requires<br />
disposal. Thus develop<strong>in</strong>g a nondestructive means <strong>of</strong><br />
characteriz<strong>in</strong>g <strong>composites</strong> <strong>in</strong> order to assure the quality <strong>of</strong><br />
the product be<strong>in</strong>g produced would be useful.<br />
In past studies, thermal diffusivity measurements have<br />
shown some promise <strong>in</strong> determ<strong>in</strong><strong>in</strong>g porosity 3,4 and <strong>fiber</strong> <strong>volume</strong><br />
<strong>fraction</strong>. 4,5 Eddy current measurements 6 have been used<br />
to measure <strong>fiber</strong> <strong>volume</strong> <strong>fraction</strong> <strong>in</strong> metal matrix <strong>composites</strong><br />
and radiography 7 has been used <strong>in</strong> an effort to measure porosity.<br />
Although these techniques show promise, ultrasonics<br />
is one <strong>of</strong> the most widely accepted nondestructive techniques<br />
used to measure <strong>fiber</strong> <strong>volume</strong> <strong>fraction</strong> and porosity. Ultrasonic<br />
attenuation measurements have been used to measure<br />
porosity 3,8 and <strong>fiber</strong> <strong>volume</strong> <strong>fraction</strong> 9 and the variation <strong>of</strong><br />
ultrasonic velocity longitud<strong>in</strong>al and/or transverse with both<br />
porosity 4,10–13 and <strong>fiber</strong> <strong>volume</strong> <strong>fraction</strong> 9,11–13 has been exam<strong>in</strong>ed.<br />
Ultrasonic <strong>Lamb</strong> <strong>wave</strong>s have also been used to <strong>in</strong>vestigate<br />
porosity 14–16 as well as <strong>fiber</strong> <strong>volume</strong> <strong>fraction</strong>. 14,16 <strong>Lamb</strong><br />
<strong>wave</strong>s <strong>of</strong>fer a convenient method <strong>of</strong> evaluat<strong>in</strong>g these composite<br />
materials. S<strong>in</strong>ce the <strong>Lamb</strong> <strong>wave</strong> velocity depends on<br />
the material properties <strong>of</strong> a structure, an effective tool exists<br />
a Current address: NASA Langley Research Center, Mail Stop 231, Hampton,<br />
VA 23681.<br />
b Army Research Lab, Vehicle Technology Center.<br />
to monitor <strong>composites</strong> by measur<strong>in</strong>g the velocity <strong>of</strong> these<br />
<strong>wave</strong>s. Additionally, <strong>Lamb</strong> <strong>wave</strong> measurements are better<br />
than conventional through-the-thickness ultrasonic measurements<br />
because they can propagate over long distances and<br />
are sensitive to the desired <strong>in</strong>-plane elastic properties <strong>of</strong> the<br />
material.<br />
The follow<strong>in</strong>g sections describe an experimental study<br />
which uses <strong>Lamb</strong> <strong>wave</strong>s to nondestructively assess <strong>fiber</strong> <strong>volume</strong><br />
<strong>fraction</strong> <strong>in</strong> <strong>composites</strong>. Previous studies by Balasubramaniam<br />
and Rose 16 successfully used higher order <strong>Lamb</strong><br />
modes to <strong>in</strong>vestigate both porosity and <strong>fiber</strong> <strong>volume</strong> <strong>fraction</strong>.<br />
In this work, the velocity <strong>of</strong> the extensional mode is measured<br />
for composite samples with various <strong>fiber</strong> <strong>volume</strong> <strong>fraction</strong>s.<br />
The results are also related to a model and the model is<br />
used to predict the <strong>fiber</strong> <strong>volume</strong> <strong>fraction</strong> from the velocity<br />
measurements.<br />
I. SAMPLES<br />
The composite samples studied were T300/934 carbon/<br />
epoxy with stack<strong>in</strong>g sequences <strong>of</strong> 0/90 4S and 0/90 8S .<br />
The <strong>fiber</strong> <strong>volume</strong> <strong>fraction</strong>s had values rang<strong>in</strong>g from approximately<br />
0.40 to 0.70. The samples were cured <strong>in</strong> a mechanical<br />
press <strong>in</strong> an attempt to achieve consistent thickness. In order<br />
to atta<strong>in</strong> 0.65 and 0.70 <strong>fiber</strong> <strong>volume</strong> <strong>fraction</strong>s, the plies for<br />
these samples were prebled prior to f<strong>in</strong>al cur<strong>in</strong>g. The samples<br />
were cut from a 30.5-cm 30.5-cm plate and had dimensions<br />
<strong>of</strong> 15.2 cm by 15.2 cm. The thicknesses, obta<strong>in</strong>ed by<br />
averag<strong>in</strong>g ten measurements for each sample, decreased with<br />
<strong>in</strong>creas<strong>in</strong>g <strong>fiber</strong> <strong>volume</strong> <strong>fraction</strong>. Specimens were taken <strong>in</strong><br />
three different areas <strong>of</strong> the large plate and chemical digestion<br />
tests were done to determ<strong>in</strong>e the average <strong>fiber</strong> <strong>volume</strong> <strong>fraction</strong>.<br />
Accord<strong>in</strong>g to ASTM standards, 17 the values for <strong>fiber</strong><br />
<strong>volume</strong> <strong>fraction</strong> obta<strong>in</strong>ed from digestion test<strong>in</strong>g are accurate<br />
to with<strong>in</strong> 2%. The results for the destructive tests are shown<br />
<strong>in</strong> Table I.<br />
1399 J. Acoust. Soc. Am. 104 (3), Pt. 1, September 1998 0001-4966/98/104(3)/1399/5/$15.00 © 1998 Acoustical Society <strong>of</strong> America 1399
TABLE I. Destructive test results to determ<strong>in</strong>e <strong>fiber</strong> <strong>volume</strong> <strong>fraction</strong> FVF.<br />
f<strong>in</strong>ed as were estimated us<strong>in</strong>g common matrix values found <strong>in</strong><br />
Sample Layers Target FVF Destructive FVF Thickness mm<br />
Q 11 m 4 Q 11 n 4 Q 22 2m 2 n 2 Q 12 4m 2 n 2 Q 66 ,<br />
Q 22 n 4 Q 11 m 4 Q 22 2m 2 n 2 Q 12 4m 2 n 2 Q 66 , 5<br />
40-1 16 0.40 0.380 2.00<br />
50-1<br />
60-1<br />
16<br />
16<br />
0.50<br />
0.60<br />
0.529<br />
0.590<br />
1.78<br />
1.57<br />
Q 12 m 2 n 2 Q 11 m 2 n 2 Q 22 m 4 n 4 Q 12 4m 2 n 2 Q 66 ,<br />
65-1 16 0.65 0.659 1.35 where mcos() and ns<strong>in</strong>(). The angle is def<strong>in</strong>ed as<br />
70-1 16 0.70 0.690 1.35 positive for a counterclockwise rotation from the primed<br />
40-2 32 0.40 0.395 3.84<br />
lam<strong>in</strong>ate axes to the unprimed <strong>in</strong>dividual lam<strong>in</strong>a axes.<br />
50-2 32 0.50 0.518 3.40<br />
60-2 32 0.60 0.580 3.40 From Eq. 5, the Q ij for the 0° and 90° lam<strong>in</strong>as are given by<br />
65-2 32 0.65 0.660 2.72<br />
70-2 32 0.70 0.690 2.72<br />
Q 11 0 deg Q 11 , Q 11 90 deg Q 22 ,<br />
Q 22 0 deg Q 22 , Q 22 90 deg Q 11 ,<br />
6<br />
II. LAMB WAVE MODEL<br />
Q 12 0 deg Q 12 , Q 12 90 deg Q 12 .<br />
For a lam<strong>in</strong>ated composite with the 1-axis def<strong>in</strong>ed as the<br />
<strong>fiber</strong> direction, the 2-axis transverse to the <strong>fiber</strong>s, and the<br />
3-axis be<strong>in</strong>g out <strong>of</strong> the plane <strong>of</strong> the plate, the stress–stra<strong>in</strong><br />
relationship <strong>in</strong> an <strong>in</strong>dividual lam<strong>in</strong>a is given by 18<br />
The velocity <strong>of</strong> the extensional plate mode can be related<br />
to the <strong>in</strong>-plane stiffness <strong>of</strong> a composite. 19 For propagation<br />
<strong>in</strong> the 0° and 90° directions, these stiffnesses are A 11 and<br />
A 22 , respectively. The extensional plate mode velocity is<br />
related to the stiffness by<br />
1 11 Q 12 0<br />
2 Q 12 Q 22 0<br />
6Q 0 0 Q 66 1<br />
2<br />
1 v 1 A 11<br />
h<br />
6,<br />
for propagation <strong>in</strong> the 0° direction and by<br />
7<br />
where and represent the normal and shear stresses, respectively,<br />
and and represent the normal and shear v 2 A 22<br />
h<br />
stra<strong>in</strong>s, respectively. The Q ij are the reduced stiffness components<br />
8<br />
and are def<strong>in</strong>ed <strong>in</strong> terms <strong>of</strong> the eng<strong>in</strong>eer<strong>in</strong>g param-<br />
eters as 18<br />
for propagation <strong>in</strong> the 90° direction. The values for the <strong>in</strong>plane<br />
stiffnesses A 11 and A 22 can be calculated us<strong>in</strong>g Eqs.<br />
2–6 if the eng<strong>in</strong>eer<strong>in</strong>g stiffnesses <strong>of</strong> the composite are<br />
Q 11 E 1 /1 12 21 ,<br />
known. If the density, , and overall thickness <strong>of</strong> the plate, h,<br />
Q 22 E 2 /1 12 21 ,<br />
2<br />
are known as well, then the extensional mode velocity <strong>in</strong> the<br />
0° and 90° directions can be computed us<strong>in</strong>g Eqs. 7 and<br />
8.<br />
Q 12 12 E 1 /1 12 21 ,<br />
The effect <strong>of</strong> <strong>fiber</strong> <strong>volume</strong> <strong>fraction</strong> on composite lam<strong>in</strong>a<br />
parameters can be derived from a simple rule <strong>of</strong> mixtures<br />
where E 1 and E 2 are the Young’s moduli <strong>in</strong> the longitud<strong>in</strong>al<br />
and transverse directions, respectively, and 12 and 21 are<br />
the major and m<strong>in</strong>or Poisson’s ratios, respectively. The Poisson’s<br />
approach. The density takes the form 20<br />
f V f m V m<br />
9<br />
ratios <strong>in</strong> Eq. 2 are not <strong>in</strong>dependent quantities and are<br />
related to each other by 18<br />
and the elastic constants are given by 18<br />
E 1 E 1 f V f E m V m ,<br />
10<br />
21 E 2<br />
<br />
E 12 .<br />
1<br />
3<br />
E m E 2 f<br />
E 2 <br />
,<br />
E 2 f V m E m V f<br />
11<br />
The <strong>in</strong>-plane stiffnesses for the entire plate, A 11 and 12 12f V f m V m ,<br />
12<br />
A 22 , are obta<strong>in</strong>ed by <strong>in</strong>tegrat<strong>in</strong>g the Q ij through the thickness<br />
<strong>of</strong> the plate. These stiffness values are def<strong>in</strong>ed as 19 where is the density, E 1 and E 2 are the longitud<strong>in</strong>al and<br />
transverse moduli, respectively, 12 is Poisson’s ratio, V f is<br />
the <strong>fiber</strong> <strong>fraction</strong>, and V m is the matrix <strong>fraction</strong>. The f and m<br />
h/2<br />
A ij Q ij k dz, i,j1,2, 4 subscripts represent the constituent properties <strong>of</strong> the <strong>fiber</strong><br />
h/2<br />
and matrix, respectively, and quantities without subscripts<br />
represent the composite lam<strong>in</strong>a properties.<br />
where h is the plate thickness and the subscript k represents<br />
each lam<strong>in</strong>a. The Q ij are the transformed stiffness coefficients<br />
which take <strong>in</strong>to account the orientation <strong>of</strong> each ply<br />
with respect to the <strong>wave</strong> propagation direction and are de-<br />
In order to predict the composite properties as a function<br />
<strong>of</strong> <strong>fiber</strong> <strong>volume</strong>, the properties <strong>of</strong> the <strong>fiber</strong> and matrix must<br />
be obta<strong>in</strong>ed. The elastic modulus <strong>of</strong> the matrix was obta<strong>in</strong>ed<br />
from the manufacturer 21 and the density and Poisson’s ratio<br />
1400 J. Acoust. Soc. Am., Vol. 104, No. 3, Pt. 1, September 1998 Seale et al.: <strong>Lamb</strong> <strong>wave</strong> <strong>assessment</strong> <strong>of</strong> <strong>composites</strong> 1400
TABLE II. Composite material properties.<br />
Material (kg/m 3 ) E 1 GPa E 2 GPa 12<br />
Matrix 1220 a 4.14 b 4.14 b 0.35 a<br />
Fiber c 1770 220.6 13.79 0.20<br />
a Estimated from common matrix values found <strong>in</strong> Ref. 20.<br />
b Reference 21.<br />
c Reference 20.<br />
Chamis. 20 The <strong>fiber</strong> properties were obta<strong>in</strong>ed from Chamis. 20<br />
The various values used <strong>in</strong> the model are compiled <strong>in</strong> Table<br />
II.<br />
The material parameters as a function <strong>of</strong> <strong>fiber</strong> <strong>volume</strong><br />
<strong>fraction</strong> were calculated us<strong>in</strong>g Eqs. 9–12 and the values<br />
listed <strong>in</strong> Table II. From these values, the reduced stiffnesses<br />
for an <strong>in</strong>dividual lam<strong>in</strong>a, Q ij , were calculated us<strong>in</strong>g Eqs.<br />
2–3. The <strong>in</strong>-plane stiffnesses for the lam<strong>in</strong>ate, A 11 and<br />
A 22 , were then computed us<strong>in</strong>g Eqs. 4–6. F<strong>in</strong>ally, the<br />
extensional mode velocity as a function <strong>of</strong> <strong>fiber</strong> <strong>volume</strong> <strong>fraction</strong><br />
was determ<strong>in</strong>ed from Eqs. 7 to 8. Due to the architecture<br />
<strong>of</strong> the lam<strong>in</strong>ates, the velocity <strong>in</strong> the 90° direction is<br />
identical to the velocity <strong>in</strong> the 0° direction. Also, s<strong>in</strong>ce the<br />
<strong>in</strong>-plane stiffness, A ij , is dependent on the thickness <strong>of</strong> the<br />
sample, the <strong>Lamb</strong> <strong>wave</strong> velocity is <strong>in</strong>dependent <strong>of</strong> sample<br />
thickness because the thickness term is canceled by the factor<br />
<strong>of</strong> h <strong>in</strong> the denom<strong>in</strong>ator <strong>of</strong> Eqs. 7–8. Therefore, the<br />
calculated velocity as a function <strong>of</strong> <strong>fiber</strong> <strong>volume</strong> <strong>fraction</strong> is<br />
representative for both the 16-ply and 32-ply samples as well<br />
as for propagation <strong>in</strong> the 0° and 90° directions.<br />
III. LAMB WAVE MEASUREMENTS<br />
A 0.5-mm pencil lead break Hsu-Neilsen source on the<br />
edge <strong>of</strong> the samples was used to excite <strong>Lamb</strong> modes <strong>in</strong> the<br />
sample over a broad range <strong>of</strong> frequencies. Break<strong>in</strong>g the lead<br />
on the edge <strong>of</strong> the plate will tend to excite extensional mode<br />
(S 0 ) due to the fact that this mode is dom<strong>in</strong>ated by <strong>in</strong>-plane<br />
motion. 19 A typical signal for a lead break on the edge <strong>of</strong> a<br />
composite is shown <strong>in</strong> Fig. 1. As can be seen from the figure,<br />
the first arrival is the faster, nondispersive extensional mode,<br />
followed by the slower, dispersive flexural mode.<br />
The signals were received by two Panametrics model<br />
V103 1.3-cm-diam transducers with a nom<strong>in</strong>al center frequency<br />
<strong>of</strong> 1.0 MHz. The transducers were placed at distances<br />
<strong>of</strong> 5.1 cm and 10.2 cm from the lead break and a coupl<strong>in</strong>g<br />
gel was used between the transducers and the plate. The<br />
FIG. 2. Schematic show<strong>in</strong>g source and receiver locations.<br />
signals from the transducers were amplified with Tektronix<br />
AM 502 differential amplifiers and recorded on a LeCroy<br />
model 9420 digital oscilloscope. A schematic <strong>of</strong> the experimental<br />
setup is shown <strong>in</strong> Fig. 2.<br />
The time differences were measured by impos<strong>in</strong>g a delay<br />
on the first signal to overlap the signal received at a<br />
greater distance. The small thickness <strong>of</strong> the plates comb<strong>in</strong>ed<br />
with the low-frequency <strong>Lamb</strong> <strong>wave</strong> yielded frequencythickness<br />
products between 0.3 and 0.7 MHz•mm. In this<br />
region, only the S 0 and A 0 modes propagate see Fig. 1. The<br />
lead<strong>in</strong>g part <strong>of</strong> the <strong>wave</strong> was identified as the extensional<br />
<strong>wave</strong>, which is not very dispersive. The trail<strong>in</strong>g portion <strong>of</strong><br />
the signals conta<strong>in</strong>ed the dispersive flexural <strong>wave</strong> which was<br />
clearly separated from the extensional mode. The separation<br />
distance between the two receiv<strong>in</strong>g transducers was measured<br />
us<strong>in</strong>g a ruler and held fixed at 5.1 cm. Us<strong>in</strong>g the distance<br />
and time values, the velocity <strong>of</strong> the S 0 mode was measured<br />
<strong>in</strong> both the 0° and 90° directions. The f<strong>in</strong>al value for<br />
the velocity <strong>in</strong> each direction was obta<strong>in</strong>ed from the average<br />
<strong>of</strong> three measurements.<br />
The results <strong>of</strong> the <strong>Lamb</strong> <strong>wave</strong> velocity measurements for<br />
the 16-layer samples are plotted as a function <strong>of</strong> the destructively<br />
obta<strong>in</strong>ed <strong>fiber</strong> <strong>volume</strong> <strong>fraction</strong> <strong>in</strong> Fig. 3. Also shown <strong>in</strong><br />
the figure is the predicted <strong>Lamb</strong> <strong>wave</strong> velocity as a function<br />
<strong>of</strong> <strong>fiber</strong> <strong>volume</strong> <strong>fraction</strong> obta<strong>in</strong>ed from the model. The results<br />
for the 32-layer samples are shown <strong>in</strong> Fig. 4. The error bars<br />
represent the variation <strong>in</strong> the velocity measurements for each<br />
sample. The standard deviation for most <strong>of</strong> the specimens<br />
FIG. 1. Signal produced by a pencil lead break on the edge <strong>of</strong> a composite.<br />
FIG. 3. <strong>Lamb</strong> <strong>wave</strong> velocity measurements <strong>in</strong> the 0° solid circles and 90°<br />
open triangles directions for the 16-layer samples. Also shown is the numerically<br />
predicted S 0 mode velocity solid l<strong>in</strong>e.<br />
1401 J. Acoust. Soc. Am., Vol. 104, No. 3, Pt. 1, September 1998 Seale et al.: <strong>Lamb</strong> <strong>wave</strong> <strong>assessment</strong> <strong>of</strong> <strong>composites</strong> 1401
FIG. 4. <strong>Lamb</strong> <strong>wave</strong> velocity measurements <strong>in</strong> the 0° solid circles and 90°<br />
open triangles directions for the 32-layer samples. Also shown is the numerically<br />
predicted S 0 mode velocity solid l<strong>in</strong>e.<br />
was less than 4% from the average <strong>of</strong> the three measurements.<br />
Several <strong>in</strong>terest<strong>in</strong>g features are seen <strong>in</strong> the figures. First,<br />
the <strong>in</strong>crease <strong>of</strong> the <strong>Lamb</strong> <strong>wave</strong> velocity with <strong>fiber</strong> <strong>volume</strong><br />
<strong>fraction</strong> for both the 16-layer and 32-layer samples is quite<br />
dramatic. The <strong>in</strong>crease <strong>in</strong> velocity from the 0.40 <strong>fiber</strong> <strong>volume</strong><br />
<strong>fraction</strong> sample to the 0.70 <strong>fiber</strong> <strong>volume</strong> <strong>fraction</strong> sample is<br />
on the order <strong>of</strong> 15%. Second, due to the geometry <strong>of</strong> the<br />
samples, the velocity <strong>in</strong> the 0° and 90° directions are very<br />
similar. This is expected because the model predicts the velocities<br />
to be identical. F<strong>in</strong>ally, the experimental velocities<br />
are very close to those predicted by the model. The discrepancies<br />
are probably due to the fact that the material properties<br />
used <strong>in</strong> the model were values taken from the literature.<br />
As properties <strong>of</strong> <strong>composites</strong> may vary significantly depend<strong>in</strong>g<br />
on cure conditions and variations <strong>in</strong> res<strong>in</strong> chemistry, the<br />
discrepancy between the actual material parameters <strong>of</strong> the<br />
manufactured composite and nom<strong>in</strong>al values obta<strong>in</strong>ed from<br />
literature is not unexpected. Additionally, as stated earlier,<br />
there is up to a 2% error associated with the determ<strong>in</strong>ation <strong>of</strong><br />
<strong>fiber</strong> <strong>volume</strong> <strong>fraction</strong> from chemical digestion. 17 Therefore,<br />
the destructively obta<strong>in</strong>ed <strong>fiber</strong> <strong>volume</strong> <strong>fraction</strong> reported here<br />
may have some <strong>in</strong>accuracies due to the measurement technique.<br />
An alternate way <strong>of</strong> present<strong>in</strong>g the <strong>Lamb</strong> <strong>wave</strong> data is to<br />
use the velocity measurements to predict the <strong>fiber</strong> <strong>volume</strong><br />
<strong>fraction</strong>. If the velocity is known, the <strong>in</strong>-plane stiffness can<br />
FIG. 6. Fiber <strong>volume</strong> <strong>fraction</strong> predicted us<strong>in</strong>g <strong>Lamb</strong> <strong>wave</strong> velocity measurements<br />
<strong>in</strong> the 0° solid circles and 90° open triangles directions compared<br />
to destructively obta<strong>in</strong>ed <strong>fiber</strong> <strong>volume</strong> <strong>fraction</strong>. Data are for 32-layer<br />
samples and the solid l<strong>in</strong>e represents an exact fit.<br />
be calculated us<strong>in</strong>g Eqs. 7–8. From the values <strong>of</strong> A 11 and<br />
A 22 , the <strong>fiber</strong> <strong>volume</strong> <strong>fraction</strong> can be backed out us<strong>in</strong>g Eqs.<br />
2–6 and Eqs. 9–12. The results for the 16-layer<br />
samples are shown <strong>in</strong> Fig. 5 and the results for the 32-layer<br />
samples are shown <strong>in</strong> Fig. 6. The <strong>fiber</strong> <strong>volume</strong> <strong>fraction</strong> predicted<br />
by the <strong>Lamb</strong> <strong>wave</strong> velocity measurements correlates<br />
well with the values obta<strong>in</strong>ed from the destructive tests. As<br />
mentioned above, the deviations seen are probably due to<br />
estimat<strong>in</strong>g the material properties <strong>of</strong> the system as well as<br />
manufactur<strong>in</strong>g variations <strong>in</strong> the measured samples.<br />
In addition to the <strong>Lamb</strong> <strong>wave</strong> velocity measurements,<br />
the frequency content <strong>of</strong> the S 0 mode was also exam<strong>in</strong>ed as<br />
a function <strong>of</strong> <strong>fiber</strong> <strong>volume</strong> <strong>fraction</strong>. The average frequency<br />
from four measurements is shown <strong>in</strong> Fig. 7 for both the<br />
16-layer and the 32-layer samples. The frequency <strong>of</strong> propagation<br />
is higher for the th<strong>in</strong> plates and the frequency <strong>in</strong>creases<br />
with <strong>in</strong>creas<strong>in</strong>g <strong>fiber</strong> <strong>volume</strong> <strong>fraction</strong> for both the<br />
thick and the th<strong>in</strong> plates. This shift toward higher frequencies<br />
with <strong>in</strong>creas<strong>in</strong>g <strong>fiber</strong> <strong>fraction</strong> was demonstrated by Balasubramaniam<br />
and Rose 16 for higher order <strong>Lamb</strong> modes. Thus<br />
the frequency content as well as the <strong>Lamb</strong> <strong>wave</strong> velocity can<br />
provide useful <strong>in</strong>formation <strong>in</strong> characteriz<strong>in</strong>g the <strong>fiber</strong> <strong>volume</strong><br />
<strong>fraction</strong> <strong>of</strong> <strong>composites</strong>.<br />
IV. CONCLUSION<br />
The <strong>Lamb</strong> <strong>wave</strong> velocity measurements <strong>in</strong> this study<br />
were conducted at long <strong>wave</strong>lengths. This was done for several<br />
reasons. First, if the <strong>wave</strong>length is large compared to the<br />
FIG. 5. Fiber <strong>volume</strong> <strong>fraction</strong> predicted us<strong>in</strong>g <strong>Lamb</strong> <strong>wave</strong> velocity measurements<br />
<strong>in</strong> the 0° solid circles and 90° open triangles directions compared<br />
to destructively obta<strong>in</strong>ed <strong>fiber</strong> <strong>volume</strong> <strong>fraction</strong>. Data are for 16-layer<br />
samples and the solid l<strong>in</strong>e represents an exact fit.<br />
FIG. 7. Frequency versus <strong>fiber</strong> <strong>volume</strong> <strong>fraction</strong> for the 16-layer solid<br />
circles and 32-layer open triangles samples.<br />
1402 J. Acoust. Soc. Am., Vol. 104, No. 3, Pt. 1, September 1998 Seale et al.: <strong>Lamb</strong> <strong>wave</strong> <strong>assessment</strong> <strong>of</strong> <strong>composites</strong> 1402
diameter <strong>of</strong> the <strong>fiber</strong>s, <strong>composites</strong> can be treated as homogeneous.<br />
Second, only the lowest order modes propagate <strong>in</strong> the<br />
frequency range where the contact measurements were conducted.<br />
F<strong>in</strong>ally, the effective elastic properties <strong>of</strong> the material<br />
can be measured because local anomalies, which scatter<br />
high frequency <strong>wave</strong>s, will not be observed at long <strong>wave</strong>lengths.<br />
<strong>Lamb</strong> <strong>wave</strong>s <strong>of</strong>fer a useful technique for characteriz<strong>in</strong>g<br />
the material properties <strong>in</strong> composite materials. <strong>Lamb</strong> <strong>wave</strong><br />
velocity measurements are better than conventional ultrasonic<br />
measurement schemes i.e., through-the-thickness<br />
measurements because they can propagate over long distances<br />
and are sensitive to the desired <strong>in</strong>-plane elastic properties<br />
<strong>of</strong> the material. The propagation <strong>of</strong> <strong>Lamb</strong> <strong>wave</strong>s depends<br />
on a variety <strong>of</strong> material properties: elastic stiffness<br />
constants, density, and thickness. As manufactur<strong>in</strong>g abnormalities<br />
porosity, <strong>fiber</strong> misalignment, and low <strong>fiber</strong> <strong>volume</strong><br />
<strong>fraction</strong> are <strong>in</strong>troduced <strong>in</strong>to a composite, one or more <strong>of</strong><br />
these material properties are altered. S<strong>in</strong>ce the <strong>Lamb</strong> <strong>wave</strong><br />
velocity is directly related to these parameters, a convenient<br />
method exists to monitor <strong>composites</strong> by measur<strong>in</strong>g the velocity<br />
<strong>of</strong> these <strong>wave</strong>s.<br />
The <strong>Lamb</strong> <strong>wave</strong> velocity is a quantitative measurement<br />
and it has been shown by this work to be an effective tool <strong>in</strong><br />
evaluat<strong>in</strong>g <strong>fiber</strong> <strong>volume</strong> <strong>fraction</strong> <strong>in</strong> <strong>composites</strong>. Thus the<br />
<strong>Lamb</strong> <strong>wave</strong> method can be used to verify the <strong>in</strong>tegrity <strong>of</strong> a<br />
composite after it is manufactured. This is an important measurement<br />
for flight qualified composite materials that may be<br />
used <strong>in</strong> extreme conditions. With the cont<strong>in</strong>ued development<br />
<strong>of</strong> <strong>assessment</strong> techniques such as the <strong>Lamb</strong> <strong>wave</strong> method,<br />
the safety <strong>of</strong> such structures can be assured.<br />
1 S. R. Ghiorse, ‘‘Effect <strong>of</strong> void content on the mechanical properties <strong>of</strong><br />
carbon/epoxy lam<strong>in</strong>ates,’’ SAMPE Quarterly 24, 54–59 1993.<br />
2 E. F. Olster, ‘‘Effect <strong>of</strong> voids on graphite <strong>fiber</strong> re<strong>in</strong>forced <strong>composites</strong>,’’<br />
AVCO Corporation Systems Division, F<strong>in</strong>al Report for U.S. Naval Air<br />
Systems Command, 1973.<br />
3 P. H. Johnston, W. P. W<strong>in</strong>free, E. R. Long, Jr., S. M. Kullerd, N. Nathan,<br />
and R. D. Partos, ‘‘Thermal and ultrasonic evaluation <strong>of</strong> porosity <strong>in</strong> composite<br />
lam<strong>in</strong>ates,’’ <strong>in</strong> Review <strong>of</strong> Progress <strong>in</strong> Quantitative Nondestructive<br />
Evaluation, edited by D. O. Thompson and D. E. Chimenti Plenum, New<br />
York, 1992, Vol. 11, pp. 1555–1562.<br />
4 J. N. Zalameda, ‘‘Full field nondestructive techniques for imag<strong>in</strong>g composite<br />
<strong>fiber</strong> <strong>volume</strong> <strong>fraction</strong>,’’ Master’s thesis, The College <strong>of</strong> William<br />
and Mary, 1996.<br />
5 J. N. Zalameda and W. P. W<strong>in</strong>free, ‘‘Quantitative thermal diffusivity measurements<br />
on composite <strong>fiber</strong> <strong>volume</strong> <strong>fraction</strong> FVF samples,’’ <strong>in</strong> Review<br />
<strong>of</strong> Progress <strong>in</strong> Quantitative Nondestructive Evaluation, edited by D. O.<br />
Thompson and D. E. Chimenti Plenum, New York, 1993, Vol. 12, pp.<br />
1289–1295.<br />
6 R. E. Beissner, G. L. Burkhardt, and J. L. Fisher, ‘‘Eddy current measurement<br />
<strong>of</strong> <strong>fiber</strong> <strong>volume</strong> <strong>fraction</strong> <strong>in</strong> metal matrix <strong>composites</strong>,’’ <strong>in</strong> Review <strong>of</strong><br />
Progress <strong>in</strong> Quantitative Nondestructive Evaluation, edited by D. O.<br />
Thompson and D. E. Chimenti Plenum, New York, 1993, Vol. 12, pp.<br />
1321–1328.<br />
7 B. E. Shull and J. N. Gray, ‘‘X-Ray measurement <strong>of</strong> material properties <strong>in</strong><br />
<strong>composites</strong>,’’ <strong>in</strong> Review <strong>of</strong> Progress <strong>in</strong> Quantitative Nondestructive<br />
Evaluation, edited by D. O. Thompson and D. E. Chimenti Plenum, New<br />
York, 1990, Vol. 9, pp. 1465–1471.<br />
8 D. K. Hsu, ‘‘Ultrasonic measurements <strong>of</strong> porosity <strong>in</strong> woven graphite polyimide<br />
<strong>composites</strong>,’’ <strong>in</strong> Review <strong>of</strong> Progress <strong>in</strong> Quantitative Nondestructive<br />
Evaluation, edited by D. O. Thompson and D. E. Chimenti Plenum, New<br />
York, 1988, Vol. 7, pp. 1063–1068.<br />
9 H. C. Kim and J. M. Park, ‘‘Ultrasonic <strong>wave</strong> propagation <strong>in</strong> carbon fibrere<strong>in</strong>forced<br />
plastics,’’ J. Mater. Sci. 22, 4536–4540 1987.<br />
10 D. K. Hsu and H. Jeong, ‘‘Ultrasonic velocity change and dispersion due<br />
to porosity <strong>in</strong> composite lam<strong>in</strong>ates,’’ <strong>in</strong> Review <strong>of</strong> Progress <strong>in</strong> Quantitative<br />
Nondestructive Evaluation, edited by D. O. Thompson and D. E.<br />
Chimenti Plenum, New York, 1989, Vol. 8, pp. 1567–1573.<br />
11 K. Balasubramaniam, C. A. Issa, and S. Alluri, ‘‘Ultrasonic <strong>wave</strong> propagation<br />
studies <strong>in</strong> anisotropic plates with built-<strong>in</strong> material degradation,’’ <strong>in</strong><br />
Review <strong>of</strong> Progress <strong>in</strong> Quantitative Nondestructive Evaluation, edited by<br />
D. O. Thompson and D. E. Chimenti Plenum, New York, 1993, Vol. 12,<br />
pp. 1375–1382.<br />
12 B. G. Mart<strong>in</strong>, ‘‘Ultrasonic <strong>wave</strong> propagation <strong>in</strong> <strong>fiber</strong>-re<strong>in</strong>forced solids<br />
conta<strong>in</strong><strong>in</strong>g voids,’’ J. Appl. Phys. 48, 3368–3373 1977.<br />
13 W. N. Reynolds and S. J. Wilk<strong>in</strong>son, ‘‘The analysis <strong>of</strong> fibre-re<strong>in</strong>forced<br />
porous composite materials by the measurement <strong>of</strong> ultrasonic <strong>wave</strong> velocities,’’<br />
Ultrasonics 16, 159–163 1978.<br />
14 J. L. Rose, K. Balasubramaniam, J. Ditri, and A. Pilarski, ‘‘The utility <strong>of</strong><br />
guided <strong>wave</strong>s <strong>in</strong> the ultrasonic NDE <strong>of</strong> composite materials,’’ <strong>in</strong> Non-<br />
Destructive Test<strong>in</strong>g, Proceed<strong>in</strong>gs <strong>of</strong> the Twelfth World Conference, Amsterdam,<br />
Netherlands, 23–28 Apr. 1989 A91-18526 05-38 Elsevier Science,<br />
New York, 1989, Vol. 2, pp. 1567–1572.<br />
15 Y. Bar-Cohen and D. E. Chimenti, ‘‘NDE <strong>of</strong> defects <strong>in</strong> <strong>composites</strong> us<strong>in</strong>g<br />
leaky lamb <strong>wave</strong>s,’’ <strong>in</strong> Symposium on Nondestructive Evaluation, 15th,<br />
San Antonio, TX, 23–25 April 1985, Proceed<strong>in</strong>gs A86-47129 22-38<br />
Nondestructive Test<strong>in</strong>g Information Analysis Center, San Antonio, TX,<br />
1986, pp. 202–208.<br />
16 K. Balasubramaniam and J. L. Rose, ‘‘Guided plate <strong>wave</strong> potential for<br />
damage analysis <strong>of</strong> composite materials,’’ <strong>in</strong> Review <strong>of</strong> Progress <strong>in</strong> Quantitative<br />
Nondestructive Evaluation, edited by D. O. Thompson and D. E.<br />
Chimenti Plenum, New York, 1990, Vol. 9, pp. 1505–1512.<br />
17 D 3171-76 Reapproved 1990 Standard Test Method for Fiber Content <strong>of</strong><br />
Res<strong>in</strong>-Matrix Composites by Matrix Digestion, Annual Book <strong>of</strong> ASTM<br />
Standards, Vol. 08.01, pp. 128–130.<br />
18 I. M. Daniel and O. Ishai, Eng<strong>in</strong>eer<strong>in</strong>g Mechanics <strong>of</strong> Composite Materials<br />
Oxford U.P., New York, 1994, pp. 3–76.<br />
19 W. H. Prosser, ‘‘The propagation characteristics <strong>of</strong> the plate modes <strong>of</strong><br />
acoustic emission <strong>wave</strong>s <strong>in</strong> th<strong>in</strong> alum<strong>in</strong>um plates and th<strong>in</strong> graphite/epoxy<br />
composite plates and tubes,’’ NASA Technical Memorandum 104187<br />
November, 1991.<br />
20 C. C. Chamis, ‘‘Simplified composite micromechanics equations for<br />
hygral, thermal, and mechanical properties,’’ SAMPE Quarterly 15,<br />
14–23 1984.<br />
21 Private communication, Tom Triplett, Fiberite ® , Inc.<br />
1403 J. Acoust. Soc. Am., Vol. 104, No. 3, Pt. 1, September 1998 Seale et al.: <strong>Lamb</strong> <strong>wave</strong> <strong>assessment</strong> <strong>of</strong> <strong>composites</strong> 1403