Hypothesis Testing - Dependent Samples - SLC Home Page
Hypothesis Testing - Dependent Samples - SLC Home Page
Hypothesis Testing - Dependent Samples - SLC Home Page

You also want an ePaper? Increase the reach of your titles
YUMPU automatically turns print PDFs into web optimized ePapers that Google loves.
CEGEP CHAMPLAIN - ST. LAWRENCE<br />
201-510-LW: Business Statistics<br />
Patrice Camiré<br />
<strong>Hypothesis</strong> <strong>Testing</strong> - <strong>Dependent</strong> <strong>Samples</strong><br />
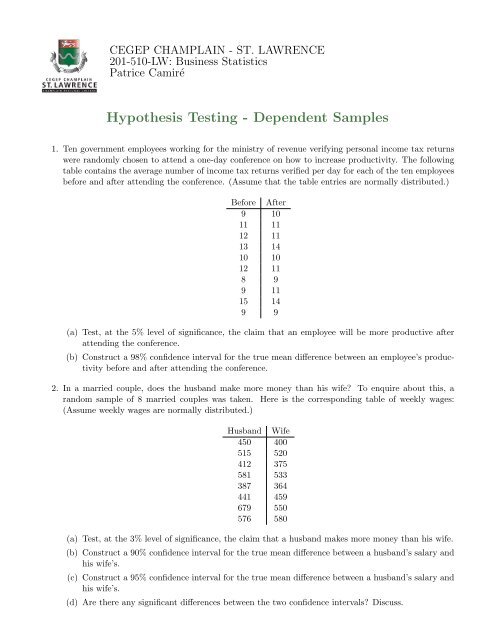
1. Ten government employees working for the ministry of revenue verifying personal income tax returns<br />
were randomly chosen to attend a one-day conference on how to increase productivity. The following<br />
table contains the average number of income tax returns verified per day for each of the ten employees<br />
before and after attending the conference. (Assume that the table entries are normally distributed.)<br />
Before After<br />
9 10<br />
11 11<br />
12 11<br />
13 14<br />
10 10<br />
12 11<br />
8 9<br />
9 11<br />
15 14<br />
9 9<br />
(a) Test, at the 5% level of significance, the claim that an employee will be more productive after<br />
attending the conference.<br />
(b) Construct a 98% confidence interval for the true mean difference between an employee’s productivity<br />
before and after attending the conference.<br />
2. In a married couple, does the husband make more money than his wife To enquire about this, a<br />
random sample of 8 married couples was taken. Here is the corresponding table of weekly wages:<br />
(Assume weekly wages are normally distributed.)<br />
Husband Wife<br />
450 400<br />
515 520<br />
412 375<br />
581 533<br />
387 364<br />
441 459<br />
679 550<br />
576 580<br />
(a) Test, at the 3% level of significance, the claim that a husband makes more money than his wife.<br />
(b) Construct a 90% confidence interval for the true mean difference between a husband’s salary and<br />
his wife’s.<br />
(c) Construct a 95% confidence interval for the true mean difference between a husband’s salary and<br />
his wife’s.<br />
(d) Are there any significant differences between the two confidence intervals Discuss.
3. A company created a new protein supplement in an attempt to increase the milk production of cows.<br />
To test this new protein, 12 dairy cows were randomly selected for a before-after study. Here is the<br />
corresponding table of daily milk production in liters: (Assume that a cow’s daily milk production is<br />
normally distributed.)<br />
Before After<br />
21 21.7<br />
20 23.1<br />
22.4 23.7<br />
22.4 23.5<br />
20.5 21.9<br />
19.2 22<br />
20.7 22.5<br />
22.3 24<br />
22.1 22.5<br />
19.4 20.3<br />
20.9 22.8<br />
21.8 21<br />
(a) Test, at the 5% level of significance, the claim that dairy cows produce more milk when consuming<br />
the new protein supplement.<br />
(b) Construct a 99% confidence interval for the true mean difference between a cow’s milk production<br />
before and after consuming the new protein supplement.<br />
4. A financial company wants to determine whether or not a boss’ comments about the task an employee<br />
must complete may be influential. To this end, the company designs the following experiment. They<br />
randomly select 9 pairs of identical twins and have them complete a challenging two-hour test. The<br />
pairs of twins are randomly split up into two groups. Group 1 is given the test with only indication<br />
that they are allowed two hours. Group 2 is given the same instructions as Group 1, but is also told<br />
that the test is very easy and they should only need about one hour. The following table shows the<br />
test scores ouf of a hundred. (Assume that the scores are normally distributed.)<br />
Twin 1 Twin 2<br />
84 72<br />
91 82<br />
77 72<br />
80 82<br />
69 62<br />
87 70<br />
93 86<br />
72 68<br />
83 82<br />
(a) Test, at the 1% level of significance, the claim that group 1 performed better than group 2.<br />
(b) Construct a 95% confidence interval for the true mean difference between the scores of group 1<br />
and group 2.
Answers<br />
1. (a) d = after − before, H 0 : µ d = 0, H 1 : µ d > 0, α = 0.05, d = 0.2, s d ≈ 1.0328, t obs ≈ 0.612, df = 9,<br />
R = [1.833, ∞)<br />
We accept H 0 , so the evidence that the conference does increase productivity is not statistically<br />
significant at the 5% level of significance.<br />
(b) −0.72 ≤ µ d ≤ 1.12<br />
2. (a) d = husband − wife, H 0 : µ d = 0, H 1 : µ d > 0, α = 0.03, d = 32.5, s d ≈ 46.687, t obs ≈ 1.969,<br />
df = 7, R ≈ [2.365, ∞)<br />
We accept H 0 , thus the evidence that a husband makes more money than his wife is not statistically<br />
significant at the 3% level of significance.<br />
(b) 1.22 ≤ µ d ≤ 63.78<br />
(c) −6.54 ≤ µ d ≤ 71.54<br />
(d) The key difference is that the first confidence interval contains strictly positive values whereas<br />
the second confidence interval does contain negative values. What does this imply in terms of<br />
possible conclusions<br />
3. (a) d = after − before, H 0 : µ d = 0, H 1 : µ d > 0, α = 0.05, d ≈ 1.358, s d ≈ 1.0449, t obs ≈ 4.503,<br />
df = 11, R = [1.796, ∞)<br />
We reject H 0 , thus the evidence that cows produce more milk when consuming the new protein<br />
supplement is statistically significant at the 5% level of significance.<br />
(b) 0.42 ≤ µ d ≤ 2.30<br />
4. (a) d = twin 2 − twin 1, H 0 : µ d = 0, H 1 : µ d < 0, α = 0.01, d ≈ −6.67, s d ≈ 5.679, t obs ≈ −3.522,<br />
df = 8, R = (−∞, −2.896]<br />
We reject H 0 , thus the evidence that group 1 performed better than group 2 is statistically<br />
significant at the 1% level of significance.<br />
(b) −11.03 ≤ µ d ≤ −2.30