Meteorological methods: temperature; humidity; rainfall; wind speed
Meteorological methods: temperature; humidity; rainfall; wind speed
Meteorological methods: temperature; humidity; rainfall; wind speed

You also want an ePaper? Increase the reach of your titles
YUMPU automatically turns print PDFs into web optimized ePapers that Google loves.
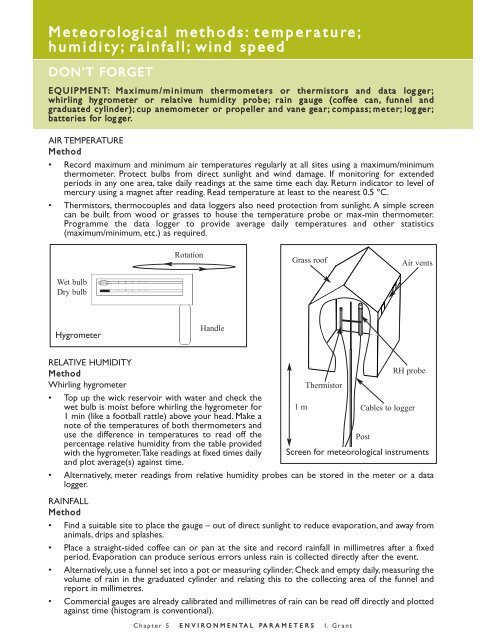
M e t e o rolog i c a l m e t h o d s : t e m p e r a t u re ;<br />
h u m i d i t y ; r a i n f a l l ; <strong>wind</strong> <strong>speed</strong><br />
DON’T FORGET<br />
EQUIPMENT: M a x i mum/minimum thermometers or thermistors and data log ger;<br />
whirling hygrometer or relative <strong>humidity</strong> probe; rain gauge (coffee can, funnel and<br />
graduated cylinder); cup anemometer or propeller and vane gear; compass; meter; log ger;<br />
batteries for log ger.<br />
AIR TEMPERATURE<br />
Method<br />
• Record maximum and minimum air <strong>temperature</strong>s regularly at all sites using a maximum/minimum<br />
thermometer. Protect bulbs from direct sunlight and <strong>wind</strong> damage. If monitoring for extended<br />
periods in any one area, take daily readings at the same time each day. Return indicator to level of<br />
mercury using a magnet after reading. Read <strong>temperature</strong> at least to the nearest 0.5 ºC.<br />
• Thermistors, thermocouples and data loggers also need protection from sunlight. A simple screen<br />
can be built from wood or grasses to house the <strong>temperature</strong> probe or max-min thermometer.<br />
Programme the data logger to provide average daily <strong>temperature</strong>s and other statistics<br />
(maximum/minimum, etc.) as required.<br />
Wet bulb<br />
Dry bulb<br />
Hygrometer<br />
Rotation<br />
Handle<br />
Grass roof<br />
RELATIVE HUMIDITY<br />
Method<br />
RH probe<br />
Whirling hygrometer<br />
Thermistor<br />
• Top up the wick reservoir with water and check the<br />
wet bulb is moist before whirling the hygrometer for<br />
1 min (like a football rattle) above your head. Make a<br />
note of the <strong>temperature</strong>s of both thermometers and<br />
1 m<br />
Cables to logger<br />
use the difference in <strong>temperature</strong>s to read off the<br />
percentage relative <strong>humidity</strong> from the table provided<br />
with the hygrometer.Take readings at fixed times daily<br />
and plot average(s) against time.<br />
Post<br />
Screen for meteorological instruments<br />
• Alternatively, meter readings from relative <strong>humidity</strong> probes can be stored in the meter or a data<br />
logger.<br />
RAINFALL<br />
Method<br />
• Find a suitable site to place the gauge – out of direct sunlight to reduce evaporation, and away from<br />
animals, drips and splashes.<br />
• Place a straight-sided coffee can or pan at the site and record <strong>rainfall</strong> in millimetres after a fixed<br />
period. Evaporation can produce serious errors unless rain is collected directly after the event.<br />
• Alternatively, use a funnel set into a pot or measuring cylinder. Check and empty daily, measuring the<br />
volume of rain in the graduated cylinder and relating this to the collecting area of the funnel and<br />
report in millimetres.<br />
• Commercial gauges are already calibrated and millimetres of rain can be read off directly and plotted<br />
against time (histogram is conventional).<br />
Chapter 5 E N V I R O N M E N TA L PA R A M E T E R S I. Grant<br />
Air vents
WIND SPEED AND DIRECTION<br />
Wind-sock Method<br />
• Suspend a <strong>wind</strong>-sock on a tall pole that is<br />
unobstructed from the <strong>wind</strong> by buildings,<br />
trees, etc. Note the direction of <strong>wind</strong><br />
using a compass. Note that direction is<br />
measured in degrees so a <strong>wind</strong> from the<br />
east (easterly) is recorded as 90º, and<br />
from the south-east as 135º.Take readings<br />
in the morning and afternoon.<br />
Wind vane Method<br />
• A more accurate way is to use a <strong>wind</strong> vane, on a 6–10 ft (1.8–3.0 m) pole, connected to a meter or<br />
data logger. Recordings can be averaged daily and plotted as a radial diagram (example Figure 1.16 in<br />
chapter 1).<br />
Anemometer Method<br />
• Measure <strong>wind</strong> <strong>speed</strong> in an unobstructed<br />
area. Hold the anemometer or pitot gauge<br />
tube at arm’s length and read off the <strong>wind</strong><br />
<strong>speed</strong> in kilometres per hour.<br />
• Some gauges will give a number against the<br />
pith ball path that is converted on a table<br />
to kilometres per hour.<br />
• Daily statistics can be more easily<br />
obtained from an electronic anemometer<br />
wired to a meter/data logger.<br />
• Repeat at the same time each day.<br />
Beaufort Wind type<br />
Force<br />
0 Calm, no <strong>wind</strong><br />
1 Light air<br />
2 Light breeze<br />
3 Gentle breeze<br />
4 Moderate breeze<br />
5 Fresh breeze<br />
6 Strong breeze<br />
7 Moderate gale<br />
8 Fresh gale<br />
9 Severe gale<br />
10 Whole gale<br />
11 Storm<br />
12 Hurricane<br />
Anemometer<br />
Wind<br />
Anemometer<br />
taped to post<br />
Post<br />
P robable terrestrial features<br />
Sock<br />
Pole<br />
The Beaufort (Wind Force) Scale: approximate <strong>wind</strong> <strong>speed</strong> using visual cues<br />
90–120 cm<br />
Smoke rises vertically<br />
Smoke drifts down<strong>wind</strong>; <strong>wind</strong> vane static<br />
Wind felt on face; leaves rustle; <strong>wind</strong> vane<br />
moves<br />
Leaves and twigs in constant motion; <strong>wind</strong><br />
extends light flag<br />
Dust and loose paper raised; small branches<br />
move<br />
Small trees in leaf begin to sway; white crests<br />
form on inland water<br />
Large branches in motion; telephone lines<br />
whistle<br />
Whole trees in motion; walking against <strong>wind</strong><br />
requires effort<br />
Twigs break off trees; progress on foot<br />
impeded<br />
Slight structural damage to buildings<br />
(slates/tiles removed)<br />
Trees uprooted; considerable structural<br />
damage to buildings<br />
Rarely experienced; widespread destruction<br />
Very rare and dangerous<br />
Chapter 5 E N V I R O N M E N TA L PA R A M E T E R S I. Grant<br />
Open<br />
end<br />
Wind-sock<br />
Cups<br />
Cable to<br />
data logger<br />
Knots Metres per<br />
second<br />
0 0<br />
1–3 1–5<br />
4–6 7–10<br />
7–10 12–18<br />
11–16 20–29<br />
17–21 31–38<br />
22–27 40–49<br />
28–33 51–60<br />
34–40 62–73<br />
41–47 74–85<br />
48–55 87–100<br />
57–65 104–116<br />
68+ 118+
P hy s i c o - c h e m i c a l m e a s u re m e n t s i n w a t e r<br />
DON’T FORGET<br />
EQUIPMENT: Oxygen, pH and conductivity meters; distilled water; pH standards and<br />
p apers; thermometer; spare battery; pencil; notebook.<br />
The electrodes, especially pH, a re easily damaged or broken. Carry spare membranes and<br />
electrolyte. Calibrate meters before going into the field.<br />
DISSOLVED OXYGEN<br />
Method<br />
• At the water’s edge, re-check the calibration of the electrode<br />
and meter. Set the barometric pressure and water <strong>temperature</strong><br />
(if not automatic). Switch the meter to percentage saturation<br />
and place the end of the electrode in a tube containing<br />
saturated (with water) cotton wool and leave for 30 s to<br />
equilibrate.The reading should be about 100%.<br />
• Take a dissolved oxygen reading by waving the electrode slowly<br />
in the water for 30 s. Note the <strong>temperature</strong>, oxygen<br />
concentration in mg O 2 l -1 and/or percentage saturation.<br />
• Rinse the electrode and replace the electrode tip into distilled<br />
or clean water.<br />
• Now note the time and light conditions, e.g. sunny, overcast, etc.<br />
• Take two readings at each site. In standing water, take surface<br />
and depth readings at intervals of 0.5 m (limited by electrode<br />
cable length). Oxygen readings are at their highest about mid<br />
afternoon.<br />
Tip: The solubility of oxygen in water varies with ambient <strong>temperature</strong> and pre sure. Some oxygen meters<br />
compensate for this.The table below provides for the co rection of oxygen at <strong>temperature</strong>s between 5 and 30 ºC<br />
and enables the Winkler determinations to be corrected and also percentage saturation of water with oxygen to<br />
be calculated.<br />
If the barometric pressure is known at the time of reading then a correction for pressure (negligible in<br />
terms of ecological work) can also be made:<br />
Solubility at pressure x = Solubility at 760 mm x observed pressure<br />
760<br />
Temperature (ºC) Oxygen solubility (mg/l)<br />
5 12.77<br />
6 12.45<br />
7 12.13<br />
8 11.84<br />
9 11.55<br />
10 11.28<br />
11 11.02<br />
12 10.77<br />
13 10.53<br />
14 10.29<br />
15 10.07<br />
16 9.86<br />
17 9.65<br />
Glass/plastic<br />
tube<br />
Electrode<br />
Chapter 5 E N V I R O N M E N TA L PA R A M E T E R S I. Grant<br />
Cable<br />
Dissolved oxygen probe<br />
Foam<br />
rubber<br />
seal<br />
Wet<br />
cotton<br />
wool<br />
providing<br />
watersaturated<br />
air<br />
Temperature (ºC) Oxygen solubility (mg/l)<br />
18 9.46<br />
19 9.27<br />
20 9.08<br />
21 8.91<br />
22 8.74<br />
23 8.57<br />
24 8.42<br />
25 8.26<br />
26 8.12<br />
27 7.97<br />
28 7.84<br />
29 7.70<br />
30 7.57
% Saturation of water with oxygen<br />
If the measured oxygen concentration at 17 ºC was 10.6 mg O2 l-1 , and using the table showing<br />
solubility of oxygen at 17 ºC to be 9.65 mg l-1 at 760 mm, then:<br />
% saturation = 10.6/9.65 x 100<br />
= 110% saturation of water with oxygen.<br />
pH<br />
Method<br />
• Check the calibration of the pH meter again before use – the calibration knob can get moved during<br />
transportation. Remove the electrode from its protective housing, rinse with distilled water and<br />
place in pH buffer to check calibration, rinse again.<br />
• Follow the same procedure for oxygen measurement (second bullet point) and note the<br />
<strong>temperature</strong> if not a compensating electrode.<br />
• For pH papers, take a sample of water in a jar and immerse the end of the paper for 30 s; remove<br />
paper and compare after a further 30-s delay with the colour comparator provided.<br />
CONDUCTIVITY<br />
Method<br />
• The electrodes are more robust and calibration is usually unnecessary in the field.<br />
• Follow the same procedure for oxygen measurement in water, and note the <strong>temperature</strong> if not a<br />
compensating electrode. Report as Siemens cm -1 (or mhos cm -1 ).<br />
• Rinse electrode and dry before storing.<br />
DEPTH<br />
Method<br />
• Measure depth with a pole in shallow water or with a rope, weighted at the end and knotted or<br />
marked at 0.5 m intervals, in deeper water. Suspend the rope from a boat and read the markers. If<br />
the water is moving, it may be difficult to suspend the rope vertically. Also, if waves are lapping the<br />
boat, take several readings and calculate the average.<br />
WATER TEMPERATURE<br />
Method<br />
• Water <strong>temperature</strong>s can be measured by glass thermometer, and most oxygen, pH and conductivity<br />
meters.<br />
OTHER CONSIDERATIONS<br />
In slow flowing rivers and lakes, pH, oxygen and (to a lesser extent) conductivity, vary quite widely with<br />
the time of day and biological activity. Standardize the times of measurement if possible and always record<br />
time and weather conditions.<br />
Always maintain the electrodes and meters as instructed by manufacturers – especially if they are stored<br />
for long periods.<br />
A GPS is useful to record positions of measurements.<br />
Chapter 5 E N V I R O N M E N TA L PA R A M E T E R S I. Grant
Turbidity<br />
DON’T FORGET<br />
EQUIPMENT: SUSPENDED SOLIDS: Bucket; plastic graduated cylinder; pre-weighed filter<br />
p apers to fit Buchner; Buchner funnel; side-arm flask; hand vacuum pump (optional);<br />
portable balance; permanent marker pens.<br />
UNDERWATER LIGHT/TURBIDITY: Secchi disk and line.<br />
SUSPENDED SOLIDS<br />
Method<br />
• Take a sample of water in a bucket and quickly pour<br />
500 ml–1litre into a bottle or other clean container<br />
that can be sealed.<br />
• Weigh a dry filter paper and put it in a Buchner or<br />
Hartley funnel attached to a side-arm flask. Tip: Glass<br />
fibre papers are best because they do not absorb moisture<br />
and can be weighed before going to the field on a<br />
milligram balance; Whatman GF/C filter papers, 7 cm<br />
diameter are ideal.<br />
• If a hand or bench vacuum pump is available, pull a<br />
vacuum on the flask after pouring a shaken sample of<br />
known volume into the funnel. If the sample is very<br />
turbid, reduce the volume or it will take hours to filter<br />
through.<br />
• Remove the filter paper when the surface no longer<br />
glistens and place on a drying rack in an oven (105 ºC)<br />
for 1 h. Cool in a desiccator before weighing. If in the<br />
field, dry in direct sun to constant weight (repeat<br />
weighing until no significant change in weight).<br />
• Calculate the concentration of suspended solids from<br />
the following:<br />
concentration of suspended solids in sample = weight of dried filter paper and solids less the weight<br />
of filter paper, divided by the volume of water poured through (in ml). Multiply by 1000 (ml) for ppm.<br />
UNDERWATER LIGHT/TURBIDITY<br />
Method<br />
• Clean Secchi disc with a wet rag and check the security of line<br />
before lowering it into the water. Let the disc sink slowly<br />
under its own weight until it just disappears from sight. Note<br />
this depth either by pinching the line at the water surface and<br />
hauling up to measure between pinch and disc, or from knots<br />
tied in the line (e.g. at 0.25 m intervals from disc) that are<br />
counted while hauling up.<br />
• Repeat the measurements several times to obtain and average<br />
extinction depth for each site.<br />
• Dry the disk and line before stowage.<br />
Weight<br />
Chapter 5 E N V I R O N M E N TA L PA R A M E T E R S I. Grant<br />
Filter<br />
paper<br />
Bung<br />
Suction<br />
Side-arm<br />
flask<br />
Buchner funnel<br />
Line<br />
Eye<br />
20 cm<br />
Secchi disc
M e a s u rement of curre n t<br />
DON’T FORGET<br />
EQUIPMENT: Gessner tube; spare plastic bags and rubber bands; plastic measuring<br />
cylinder (250 ml) or flow meter; orange; two stakes (2 m length); h a m m e r; 25 m tap e<br />
measure.<br />
Measurement of flow using a floating object is imprecise by comparison with the other<br />
<strong>methods</strong>.<br />
CURRENT SPEED BY FLOATING OBJECT<br />
Method<br />
• Place two stakes in the river and measure the distance between them. Throw in an orange or other<br />
heavy, floating object and time its unimpeded travel between the two points. Repeat 2–3 times to<br />
obtain an average surface flow rate in m s -1<br />
flow rate (m s -1 ) = distance travelled by float (m)/time to cover distance (s).<br />
• Estimate river velocity (slower than surface velocity) by multiplying the average time by 0.8 before<br />
applying the equation above.This compensates for the drag caused by the river bed.<br />
CURRENT SPEED BY METER<br />
Method<br />
• Measure the depth of the water using a pole and then set the propeller depth on the shaft at a<br />
distance of one-third of the depth – measuring from the foot of the shaft. Point the propeller of a<br />
current meter upstream and record the number of turns logged after 30 s. Repeat several times,<br />
read off the current <strong>speed</strong> from the supplied calibration graph or a factor provided with the<br />
instrument, and average the result. Repeat at various depths if the river is deep enough to warrant<br />
a velocity profile.<br />
• For estimating flow rate through a drift net, place the propeller at the mouth of the net.Take readings<br />
at the beginning and end of the drift sampling period, e.g. at time zero and 4 h. Calculate the average<br />
current through the net. (Custom-built meters that fit<br />
into the mouth of a drift net will integrate the variable<br />
flow through the net as the latter clogs up and impedes<br />
flow. This method is the preferred but expensive<br />
option.)<br />
Flow meter<br />
Pole or shaft<br />
CURRENT SPEED/VOLUME BY GESSNER TUBE<br />
Method<br />
• Close the funnel aperture with a finger and place the<br />
tube, funnel upstream, into the water. Remove finger<br />
for a few seconds to allow the water to flow into the<br />
tube before closing the aperture again. Remove the<br />
tube and measure the volume of water in the bag by<br />
pouring into a measuring cylinder. Repeat twice and<br />
at various depths if feasible. Calculate the flow rate<br />
from the formula:<br />
flow (cm-2 s-1 ) = volume of water trapped (ml)/time (s)<br />
x cross-sectional area of opening (π r2 )<br />
flow volume (cm3 cm-2 s -1 (r<br />
) = (volume in ml/π ) x<br />
2 )/time (s).<br />
Cable to meter<br />
Depth<br />
Current<br />
Propeller<br />
Chapter 5 E N V I R O N M E N TA L PA R A M E T E R S I. Grant<br />
2 ⁄3 from surface<br />
Bed<br />
Foot
Gessner tube<br />
0.5 cm<br />
Water flow<br />
Nozzle cut from washing-up<br />
liquid dispenser<br />
Plastic bag or condom<br />
Chapter 5 E N V I R O N M E N TA L PA R A M E T E R S I. Grant<br />
2–3 cm plastic<br />
or glass tubing
Classification of aquatic substrates<br />
DON’T FORGET<br />
EQUIPMENT: Cylinder sampler; scoop; set of sieves; bucket; spring balance; notebook;<br />
pencil.<br />
The substrates of river and stream beds range from fine particles of clay to boulders.<br />
Substrate analysis can be rapid and crude or lengthy but more exacting depending on the<br />
goal. For the siting of sampling stations for monitoring work, a rapid analysis should suffice.<br />
This is normally done by eye in the first instance.The test of reasonably matched sites is to<br />
find reasonably matched biota.<br />
RAPID ANALYSIS<br />
Method<br />
• If the water is clear or very shallow, just note the main characteristics of the sampling station, e.g.<br />
percentage bedrock or pebble, gravel or sand, silt and clay.<br />
• Water flowing over solid rock just needs noting: as very few invertebrates can inhabit this substrate<br />
– algae and vegetation are more successful – the medium does not lend itself to meaningful analyses<br />
of populations.<br />
PARTICLE SIZE ANALYSIS<br />
Method<br />
• Examine the substrate type in a delimited area – perhaps 1–5 m 2 . Estimate the size range and<br />
number of rocks.<br />
• In substrates comprising smaller categories of material, use a cylinder sampler (see method sheet<br />
from chapter 9), turning the meshed opening away from the flow, lift the pebbles out and measure<br />
their lengths.<br />
• Using a trowel or tin can, scoop up the underlying gravel, sand and sediment and place in a sieve<br />
series, shaking them in a bucket of water or nearby pool, to separate the particulate sizes.<br />
• Let the materials drain for 5 min and weigh each sieve separately on a spring balance to estimate the<br />
material retained – subtracting the sieve weight.<br />
• Repeat two more times in the same delimited area to characterize and then tabulate the result as,<br />
for example, lengths of largest parameter (stones/pebbles) or weights of materials from sieves.<br />
Substrate categories<br />
N a m e S i ze range Lengths/weight<br />
Clay 256 mm<br />
OTHER CONSIDERATIONS<br />
Substrate type at Site 12<br />
% by weight<br />
A sieve series with mesh apertures of 16 mm, 2 mm, 500 µm, 250 µm, and 100 µm should suffice.<br />
Narrower aperture sieves quickly clog and so silt/clay analyses are normally determined gravimetrically<br />
in a laboratory.<br />
Chapter 5 E N V I R O N M E N TA L PA R A M E T E R S I. Grant<br />
Silt<br />
Fine sand<br />
Medium sand<br />
Coarse sand<br />
Gravel
Ve ge t a t i ve cover and shade<br />
DON’T FORGET<br />
EQUIPMENT: Notebook; pencil; m aps; keys to ve getation; light meter; G P S .<br />
The survey team must have a good knowledge of ve getation types. Undertake an initial<br />
field visit to decide on number and location of sites and where estimates of cover will be<br />
m a d e.<br />
Method<br />
• Demarcate on a map the areas where pesticide interventions are to be made. Identify promising<br />
roads or tracks giving access to areas in sprayed and unsprayed terrain and ground-truth what<br />
appears on vegetation maps (if available) for accuracy, in terms of dominant species, e.g.<br />
Julbernardia/Combretum woodland, shrub savanna, grass steppe, etc.<br />
• Members of the survey team should agree on the definitions and use of the ranks and scales for<br />
cover estimation (see suggestions in table).<br />
Scales for estimating vegetative cover<br />
Rank Braun-Blanquet (% cover)<br />
Bare ground < 1<br />
Rare 1–5<br />
Occasional 6–25<br />
Frequent 26–50<br />
Abundant 51–75<br />
Dominant 76–100<br />
• Estimate the percentage cover in several areas of a potential sampling site using the Braun-Blanquet<br />
scale above. A site might be anything from 100 m 2 to 1 ha (100 x 100 m) depending upon cover,<br />
season and the techniques to be employed for the fauna (which may need to cover extensive ground<br />
as in bird or mammal monitoring).<br />
• Survey to one side of the road (or vehicle) and then the other. Get a second surveyor to do the<br />
same and compare the results. Discuss any gross discrepancies and the means to ensure better<br />
objectivity in estimation.<br />
• Make a sketch map of the area if it helps and record all the species identified and rankings made.<br />
• Repeat the surveys at other potential sites (similar appearance) along the road or within the defined<br />
sprayed area. Mark the grid reference (or take a GPS waypoint) and number the sites in case you<br />
want to adopt them as monitoring stations.<br />
• Repeat the whole operation in the unsprayed area until the recommended number of sites have<br />
been matched and identified.<br />
OTHER CONSIDERATIONS<br />
It is possible to record over 100% cover in this method because there may be several layers of<br />
vegetation. For example, there may be algae, grasses, shrubs and trees occupying different layers.<br />
Visual observation on tree canopy height and under-canopy shade may also be useful descriptors.<br />
Bear in mind that it will not be possible to discriminate between very small percentages of cover if you<br />
create more classes of scale than those shown below.<br />
Make sure that the unsprayed area is at least 10–20 km from the sprayed area, to minimize the possibility<br />
of contamination from spray drift.<br />
Chapter 5 E N V I R O N M E N TA L PA R A M E T E R S I. Grant
Soil tex t u re<br />
DON’T FORGET<br />
EQUIPMENT: Wash bottle; trowel; hand lens; p aper labels; notebook; pencil; plastic bags;<br />
permanent marker pen.<br />
Method<br />
• Dig soil to a depth of 5–10 cm and collect a sample in a plastic bag containing a label (pencil on paper)<br />
in case a laboratory particle size analysis is later desired. Note how hard the soil was to dig: in the dry<br />
season, clay soil will be hard and of smooth appearance; sand grains will be noticeable on the surface<br />
of sandy soils. In the wet season, clay soils will be sticky, glistening, or plastic; sandy soils will be well<br />
drained, leaving grains on the surface that are visible to the naked eye (certainly with a hand lens).<br />
• Take a handful of soil and wet it. Clay soils will absorb a lot of water compared with sandy ones.Wet<br />
almost to saturation point and then, using the thumb and forefinger, determine the amount of clay<br />
from its degree of stickiness and plasticity as follows.<br />
– Squeeze the soil by pressing it with a sideways/slightly forward motion of the thumb and try to form<br />
a long, thin ribbon or try to roll the soil into a thin, long ‘worm’ (±10 cm). If either is possible, then<br />
a clay soil is indicated. If the wet clay will take your fingerprint then a clay or silty clay is indicated. If<br />
sand grains are felt at the surface of the clay then a sandy clay is indicated<br />
– If a short ribbon or ‘worm’ can be produced (2–4 cm) or perhaps a longer one for a short period<br />
of time, then a clay loam is indicated.<br />
• Determine the sand and silt content by rewetting the soil and see if the soil feels like flour when<br />
rubbed between the forefinger and thumb or whether sand grains can be felt. If the soil formed short<br />
ribbons or ‘worms’ and then felt floury, a silty clay loam is indicated, or if gritty, a sandy clay loam is<br />
probable.The latter soil will not allow the ‘worm’ to be bent into a ring. Equal amounts of flouryness<br />
and grittyness indicate a clay loam.<br />
• A soapy feel without stickiness and an inability to bend ‘worms’ into a ring indicates a silt loam.<br />
• Sandy loams and loamy sands will not form a ribbon or ‘worm’ but will just stay together if rolled<br />
into a ball.<br />
• A sandy soil will not form a ribbon or a ball.<br />
Chapter 5 E N V I R O N M E N TA L PA R A M E T E R S I. Grant
S o i l m o i s t u re , w a t e r-holding cap a c i t y, soil pH<br />
DON’T FORGET<br />
EQUIPMENT: Plastic Petri dish; aluminium foil; portable balance; 10 cm filter papers; soil<br />
corer or tin can; distilled water; p aper tissues; spatula; pH paper; pH sensitive electrode; p H<br />
meter.<br />
Remember to calibrate the pH meter with buffers beforehand and set the slurry<br />
<strong>temperature</strong> if the meter does not automatically compensate for it.<br />
SOIL MOISTURE<br />
Method<br />
• Mix a few spade-fulls of freshly dug surface soil (0–20 cm) from a sampling site and place 1–2 kg<br />
immediately into thick polythene bags and label. Double bag if the polythene or plastic bags are too<br />
thin to prevent water loss during transportation and storage.<br />
• Pass a small sample, e.g. 500 g, through a 2 mm sieve to remove vegetation/roots before placing small<br />
amounts of soil (25–50 g) on to shallow, weighed containers (Petri dishes, tin cans, or aluminium<br />
foil).Weigh wet soils and record weight.<br />
• Spread soils out and, if sun-drying, protect from gusts of <strong>wind</strong>.<br />
• Air-dry the soil samples in direct sunlight to constant weight, i.e. reweigh the containers of soil<br />
periodically until there is no discernible weight change.<br />
• Subtract the weight of the soil container from the total weight to obtain wet and dry soil weights<br />
and then calculate the moisture content from the formula:<br />
% soil moisture = weight of wet soil - weight of dry soil x 100<br />
weight of dry soil<br />
• Keep the air-dried soil in plastic bags to oven-dry later.<br />
• On return to the laboratory, check the dry weight of the soil by placing the air-dried sample in an<br />
oven at 105 ºC overnight and re-weighing.<br />
WATER-HOLDING CAPACITY (1) Use for soils prepared for nitrification estimates.<br />
Method<br />
• Fold three weighed filter papers and place each in a funnel. Put 25 g of soil (collected as described<br />
in soil moisture method) in each paper and saturate the soil with water. Cover the funnel with<br />
aluminium foil and allow the soils to drain by gravity for 1 h in the shade and then reweigh.<br />
• Sun-dry the soil to constant weight (as at fourth bullet point above).<br />
• To estimate the water-holding capacity in grams water, use the formula:<br />
field capacity (g water) = weight of gravity drained soil - weight of sun-dried soil<br />
or expressed as % water at field capacity = weight of gravity drained soil - air-dried weight of soil x 100<br />
air-dried weight of soil<br />
WATER-HOLDING CAPACITY (2) Use for comparison of field capacities between soils.<br />
Method<br />
• Take a soil core using a corer or tin can with one end removed and the other perforated with a few<br />
small nail holes. Weigh the corer or can, push into the soil and remove the core. Note: Use of a<br />
soil corer will minimize disturbance of the soil.<br />
• Saturate the soil in the corer or can with water and let the water drain away under gravity for 1 h<br />
in the shade before re-weighing.<br />
• Extract the soil from the corer/can and sun-dry to constant weight and apply the formulae from<br />
Water-Holding Capacity (1) at fifth bullet point to obtain an estimate of field capacity.<br />
Chapter 5 E N V I R O N M E N TA L PA R A M E T E R S I. Grant
SOIL pH BY PAPER<br />
Method<br />
• Shake or stir equal volumes of soil (collected as described in ‘Soil Moisture’ method) and distilled<br />
water (e.g. 50 ml each) in a container and settle for 2–3 min until the supernatant clears.<br />
• Momentarily dip a pH paper (range pH 4–8) into the water and compare the colour after it has<br />
developed (1 min) with the colour chart provided and read off the pH. Tip: Na row range paper (two<br />
pH units) can provide greater accuracy.<br />
SOIL pH BY METER<br />
Method<br />
• For more accuracy (preferable), suspend a pH-sensitive electrode and its reference electrode (often<br />
combined) in the soil mixture produced in the step above and swirl the soil into a slurry, reading the<br />
pH when it is stable (15 s).<br />
• Rinse the electrode(s) with distilled water between measurement of further samples.<br />
OTHER CONSIDERATIONS<br />
All these <strong>methods</strong> are adapted for use in the field and will not provide the accuracy or precision of<br />
laboratory standard <strong>methods</strong>.<br />
Chapter 5 E N V I R O N M E N TA L PA R A M E T E R S I. Grant