PCCPwww - Inorganic Chemistry and Catalysis
PCCPwww - Inorganic Chemistry and Catalysis
PCCPwww - Inorganic Chemistry and Catalysis

Create successful ePaper yourself
Turn your PDF publications into a flip-book with our unique Google optimized e-Paper software.
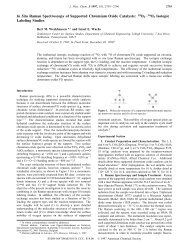
RESEARCH PAPER<br />
Pd L 3 edge XANES investigation of the electronic <strong>and</strong> geometric<br />
structure of Pd/Ag–H membranes<br />
Laurens C. Witjens, J. H. Bitter, A. J. van Dillen, K. P. de Jong <strong>and</strong> F. M. F. de Groot*<br />
PCCP<br />
www.rsc.org/pccp<br />
<strong>Inorganic</strong> <strong>Chemistry</strong> <strong>and</strong> <strong>Catalysis</strong>, Debye Institute, Utrecht University, P.O. Box 80083,<br />
Utrecht 3508 TB, the Netherl<strong>and</strong>s. E-mail: f.m.f.degroot@chem.uu.nl; Fax: þ31 30 2511027;<br />
Tel: þ31 30 2536763<br />
Received 11th February 2004, Accepted 19th May 2004<br />
First published as an Advance Article on the web 26th May 2004<br />
The electronic <strong>and</strong> geometric structure of the Pd/Ag–H system, an important hydrogen membrane structure, has<br />
been studied with x-ray absorption spectroscopy. Palladium L 3 XANES measurements in both vacuum <strong>and</strong> in<br />
situ under hydrogen atmosphere were performed at room temperature on an ideally mixed Pd 0.8 Ag 0.2 system<br />
obtained with bi-sputtering, <strong>and</strong> on a pure Pd system obtained with electroless plating. A model of fcc-Pd/Ag<br />
with the Ag atoms evenly distributed through the system <strong>and</strong> the hydrogen atoms placed in the octahedral holes<br />
was able to explain the observed XANES in great detail. FEFF calculations show that the Pd/Ag–H system<br />
generates an anti-bonding Pd–H b<strong>and</strong>, in close agreement with the experimental results. In addition the<br />
calculations show that the hydrogen content of the system strongly influences the XANES, especially the intensity<br />
of the white-line <strong>and</strong> the anti-bonding peak. In contrast the influence of the Ag atoms is limited to relatively<br />
small changes in the white-line intensity. However change of the Ag distribution within the Pd/Ag fcc lattice from<br />
well-mixed to clustered was found to have a significant influence on the Pd L 3 edge white-line intensity.<br />
DOI: 10.1039/b402540g<br />
1. Introduction<br />
Thin Pd 0.77 Ag 0.23 films on inert, porous supports such as<br />
a-alumina, Vycor glass or porous stainless steel are very<br />
important membrane materials. 1–4 Applications vary from<br />
separating H 2 from gas streams to use in a membrane reactor<br />
in hydrogenation or dehydrogenation reactions. 3,5–7<br />
Hydrogen permeates through solid metals via the solution–<br />
diffusion mechanism; 3 hydrogen is dissociatively chemisorbed<br />
on the surface of the metal, absorbed into the bulk metal as<br />
atoms <strong>and</strong> diffuses through the metal to recombine at <strong>and</strong><br />
desorb from the opposite surface. Within the bulk of both Pd<br />
<strong>and</strong> Pd/Ag alloys the hydrogen atoms prefer to be located in<br />
the octahedral interstices of the face-centered cubic (fcc)<br />
lattice, 3,8 most likely travelling from one octahedral site to<br />
the next via a tetrahedral site. 3,9<br />
It is well documented 1,10,11 that the optimal Pd/Ag membrane<br />
composition, based on both maximum hydrogen permeability<br />
<strong>and</strong> lifetime considerations, is 23 at% Ag. The lifetime<br />
of pure Pd membranes is largely limited by the so-called<br />
hydrogen embrittlement. This phenomenon is caused by transition<br />
between two different palladium hydride phases (a <strong>and</strong><br />
b) <strong>and</strong> induces strong local tensions in the metal film resulting<br />
in microcracking <strong>and</strong> finally mechanical failure. Alloying Pd<br />
with 23 at% Ag lowers the critical temperature, T c (a,b), for the<br />
coexistence of the a <strong>and</strong> b phases so that only a single Pd/<br />
Ag–H phase is formed above ambient temperature 3,11,12 <strong>and</strong><br />
hydrogen embrittlement is prevented.<br />
The Pd–H system has been investigated extensively in the<br />
past, including studies on the electronic structure with X-ray<br />
absorption. 13,14 Pd/Ag alloys have also received ample attention.<br />
15,17 Despite its important applications in the hydrogen<br />
purification field the Pd/Ag–H system has been largely neglected.<br />
Only recently some papers 9,18 have been published on<br />
this subject, however these articles are purely theoretical<br />
works. One of the findings of our experimental work, as was<br />
shown with some prelimenary results at the XAFS-12 meeting<br />
in Malmo¨ , 19 is the deviation of the Pd L 3 edge XANES of the<br />
Pd/Ag–H system from the expectations raised by the Pd–H <strong>and</strong><br />
Pd/Ag XANES. Differences in the local geometry of Pd–H <strong>and</strong><br />
Pd/Ag–H are a likely cause of the observed changes. Clarification<br />
of this phenomenon could be a major step for improving<br />
membrane performance.<br />
In this full paper the experimental XANES results are<br />
analyzed in detail <strong>and</strong> modelled with the FEFF 8.2 program, 20<br />
an ab initio self-consistent real space multiple-scattering code<br />
for simultaneous calculations of x-ray absorption spectra <strong>and</strong><br />
the electronic structure, to determine the origin of the electronic<br />
structure of the Pd/Ag–H system. For the modelling work<br />
fcc crystal structures were used <strong>and</strong> it was assumed that the<br />
hydrogen atoms occupy the octahedral holes both in pure Pd<br />
<strong>and</strong> in Pd/Ag alloys. Although there is a small barrier 9 of<br />
81.4 meV atom 1 between octahedral <strong>and</strong> tetrahedral hole<br />
occupation, Boltzmann’s distribution law states that at ambient<br />
temperature only 4% of the hydrogen atoms will be located<br />
in the tetrahedral holes.<br />
It was investigated whether such models could satisfactorily<br />
explain the observed Pd/Ag–H Pd L 3 edge XANES or whether<br />
significant changes to the structure were needed. Secondly, the<br />
influence of the Ag distribution within the Pd/Ag fcc lattice on<br />
the XANES was considered, since the Ag distribution is of<br />
major importance to the membrane performance. If locally<br />
areas are enriched or impoverished in Ag the hydrogen permeability<br />
in those areas, <strong>and</strong> as a consequence the overall hydrogen<br />
permeability, will be decreased. Furthermore it is likely<br />
that Ag poor areas can act as crystallization points where<br />
hydrogen embrittlement <strong>and</strong> subsequent microcracking can<br />
occur, potentially resulting in mechanical failure. Inadequate<br />
mixing is therefore expected to seriously limit the performance<br />
<strong>and</strong> lifetime of the membranes. Therefore calculations were not<br />
only performed on systems with homogeneously distributed Ag<br />
atoms, but also on a system with all Ag atoms concentrated in<br />
one cluster.<br />
2. Materials <strong>and</strong> methods<br />
A 3–4 mm thick Pd film deposited on an a-alumina tube with<br />
the electroless plating method, 1,5 was obtained from ECN<br />
This journal is & The Owner Societies 2004<br />
Phys. Chem. Chem. Phys., 2004, 6 , 3903–3906 3903
(Petten, the Netherl<strong>and</strong>s). A cross-section of the sample was<br />
studied with SEM.<br />
A 750 nm Pd 0.8 Ag 0.2 sample on a SiO 2 /Si wafer (with 25 nm<br />
Ti adhesion layer) obtained with bi-sputtering was received<br />
from the MESA 1 institute of the University Twente (Enschede,<br />
the Netherl<strong>and</strong>s). The surface of the sample was<br />
studied with SEM. XPS depth-profiling of this sample was<br />
performed in our laboratory to check the homogeneity of the<br />
Ag distribution. XPS measurements were alternated with<br />
sputtering with an Ar 1 ion beam until the support material<br />
was detected. The XPS data were obtained with a Vacuum<br />
Generators XPS system, using a CLAM-2 hemispherical analyser<br />
for electron detection. Non-monochromatic Al(K a ) X-ray<br />
radiation was used for exciting the photo electron spectra using<br />
an anode current of 20 mA at 10 keV. The pass energy of the<br />
analyser was set at 50 eV. The survey scan was taken with a<br />
pass energy of 100 eV.<br />
At the E4 beamline of the HASYLAB facility (Hamburg,<br />
Germany) the Pd L 3 -edge XANES of the pure Pd <strong>and</strong> Pd/Ag<br />
alloy samples were determined in vacuum <strong>and</strong> under a H 2<br />
atmosphere of 1.5 bar. The measurements were performed at<br />
ambient temperature using a Ge single channel fluorescence<br />
detector with a diameter of 2.5 cm. At least two scans were<br />
averaged for each measurement. The pre-edges <strong>and</strong> backgrounds<br />
were subtracted <strong>and</strong> the measurements were normalised<br />
at 50 eV beyond the edge. Some saturation effects due to<br />
self-absorption were visible when comparing our fluorescence<br />
results to transmission results from Coulthard <strong>and</strong> Sham. 16 A<br />
numerical correction was determined based on the vacuum<br />
measurements of the two samples <strong>and</strong> applied to the hydrogen<br />
measurements. The correction was based on work by Schroeder;<br />
21 for a 901 scattering angle the intensity of the fluorescence<br />
yield (I F ) is given as a function of the absorption cross section<br />
(m x ) <strong>and</strong> the background absorption (m B ):<br />
I F <br />
ð1Þ<br />
m x þ m B<br />
The value of m B was determined by steering the relative<br />
intensity of the white-line (compared to the baseline) to the<br />
values for pure Pd respectively Pd 0.8 Ag 0.2 as determined by<br />
Coulthard <strong>and</strong> Sham, 16 while the baseline was kept at 1 with<br />
the aid of a normalization factor. The energy scales of the<br />
spectra were calibrated on the point of inflection of the Pd L 3<br />
edge, 3173.3 eV, 22 of the pure Pd sample in vacuum. During<br />
the course of the experiments the energy scale shifted 0.3 eV.<br />
FEFF 8.2 calculations 20 were performed with clusters of 121<br />
or 139 atoms. The clusters were centered round a single Pd<br />
atom, the FEFF target. First a model was created for the Pd–H<br />
system, in the second step this model was applied to the Pd/<br />
Ag–H system <strong>and</strong> finally the hydrogen content of the model<br />
was optimized <strong>and</strong> the influence of the Ag distribution on the<br />
XANES was studied. The models were based on the fcc lattice<br />
structure with the Pd <strong>and</strong> Ag atoms placed in the fcc locations<br />
<strong>and</strong> the hydrogen atoms evenly distributed over the octahedral<br />
holes. Similarly the Ag atoms were evenly distributed over the<br />
fcc positions in the Pd/Ag models, except for the Pd/Ag H 2<br />
cluster model. In this case all Ag atoms were clustered within<br />
one unit cell (Fig. 1), to determine the effect of the Ag<br />
distribution on the XANES.<br />
The lattice constant was set to 4.025 A˚ for all models (Pd <strong>and</strong><br />
Pd/Ag), as found for PdH 0.6 , 23 based on the strong influence of<br />
the hydrogen atoms on the lattice constant compared to the<br />
relative weak effect of alloying Pd with 20 at% Ag. The lattice<br />
constant only increases from 3.894 A˚ 23 for pure Pd to 3.924 A˚<br />
for Pd 0.8 Ag 0.2 ,w while introducing 0.6 H into pure Pd increases<br />
the lattice constant to 4.025 A˚ . Maintaining the same lattice<br />
{ A linear relation between the lattice constant <strong>and</strong> the Ag content<br />
(Vegard’s law) was derived for Pd/Ag alloys from XRD lattice constant<br />
data 33,34 <strong>and</strong> was used to determine this lattice constant.<br />
m x<br />
Fig. 1 The Pd 0.8 Ag 0.2 H 0.4 cluster (model #4) minus the hydrogen<br />
atoms; note the central Pd atom <strong>and</strong> FEFF target (black sphere), the<br />
other Pd atoms (white spheres) <strong>and</strong> the Ag cluster (grey spheres).<br />
Table 1<br />
Characteristics of the FEFF 8.2 models<br />
Number of atoms in model<br />
Model (#) Description Ag distribution Pd Ag H<br />
1 PdH 0.6 — 87 — 52<br />
2 Pd 0.8 Ag 0.2 H 0.6 R<strong>and</strong>om 69 18 52<br />
3 Pd 0.8 Ag 0.2 H 0.4 R<strong>and</strong>om 69 18 34<br />
4 Pd 0.8 Ag 0.2 H 0.4 Clustered 69 18 34<br />
constant for all models was a reasonable assumption <strong>and</strong><br />
facilitated the comparison of the models. All models had five<br />
metal shells <strong>and</strong> five hydrogen shells. In Table 1 the characteristics<br />
of the models are listed.<br />
For all FEFF 8.2 calculations the core hole parameter has<br />
been included. 24 The SCF parameter was set to 4.1 A˚ , which<br />
corresponds to two metal <strong>and</strong> two hydrogen shells. The FMS<br />
parameter was set to 7.0 A˚ <strong>and</strong> includes the complete models as<br />
given in Table 1. Corrections of the Fermi level were necessary<br />
to compensate for the value determined by the FEFF 8.2 code.<br />
The size of the correction was determined by matching the<br />
intensity of the white-line absorption of the FEFF calculations<br />
with the experimental results. For all models a correction of<br />
2.2 eV was used.<br />
3. Results <strong>and</strong> discussion<br />
3.1 Sample characterisation<br />
Inspection of the pure Pd on a-alumina sample with SEM<br />
confirmed the Pd layer to be 3–4 mm thick. Both the pure Pd<br />
<strong>and</strong> the Pd/Ag bi-sputtered sample were found to have dense<br />
metal layers with a smooth surface.<br />
The XPS depth profile of the bi-sputtered sample showed a<br />
constant Ag content in the bulk of approximately 20 at%, but<br />
the surface showed a small Ag enrichment (25 at%). Thermodynamics<br />
25,26 indeed dictate complete mixing of Pd <strong>and</strong> Ag in<br />
the bulk <strong>and</strong> Ag enrichment of the surface (caused by the lower<br />
surface energy of Ag). The homogeneity of the sample is thus<br />
as good as can be expected.<br />
3.2 XANES <strong>and</strong> FEFF 8.2<br />
In Fig. 2 the experimental XANES results are plotted. Fig. 2(a)<br />
exhibits the separate influences of dissolving hydrogen <strong>and</strong><br />
alloying with Ag on the Pd L 3 edge XANES, whereas in<br />
Fig. 2(b) the Pd/Ag–H system is compared with the Pd–H<br />
system. The most prominent feature of the Pd vacuum XANES<br />
is the white-line at 3173 eV, caused by excitation of electrons<br />
from the 2p to the 4d b<strong>and</strong>. 27 Although the atomic configuration<br />
of Pd is 4d 10 5s 0 hybridisation in the solid gives rise to<br />
3904 Phys. Chem. Chem. Phys., 2004, 6 , 3903–3906 This journal is & The Owner Societies 2004
Fig. 2 Experimental results of (a) Pd in vacuum (black), Pd/Ag in<br />
vacuum (grey) <strong>and</strong> Pd in H 2 (thinner line), <strong>and</strong> (b) Pd in H 2 (black) <strong>and</strong><br />
Pd/Ag in H 2 (grey).<br />
Fig. 3 Comparison of (a) Pd in H 2 exp. (black) <strong>and</strong> PdH 0.6 , model #1<br />
(grey), <strong>and</strong> (b) PdH 0.6 , model #1(black) <strong>and</strong> Pd 0.8 Ag 0.2 H 0.6 , model #2<br />
(grey).<br />
0.36 hole per atom in the 4d b<strong>and</strong> as determined by Vuillemin<br />
<strong>and</strong> Priestly 28,29 using the de Haas van Alphen effect. This<br />
value was later confirmed by Mueller et al. 30 using ab initio<br />
calculations.<br />
Fig. 2(a) shows that the addition of Ag to Pd gives a lower<br />
intensity of the white-line, which is in agreement with results in<br />
the literature. 16 This can be attributed to a decrease of the<br />
number of 4d holes in Pd, i.e., to a shift of electron density<br />
from the Ag to the Pd metal. The peak at approximately<br />
3204 eV (indicated with arrows) is shifted to lower energy for<br />
Pd/Ag. According to the 1/R 2 rule 31 this indicates lattice<br />
expansion, in full agreement with the lattice constant data in<br />
the materials <strong>and</strong> methods section.<br />
In addition, it can be concluded from Fig. 2(a) that dissolving<br />
hydrogen in Pd causes a similar shift in peak position of<br />
the 3204 eV peak (a stronger shift because of the larger lattice<br />
expansion) as well as a decrease in white-line intensity, a blue<br />
shift of the entire spectrum <strong>and</strong> a new feature at þ7 eV from<br />
the white-line. This new peak has been attributed to the unfilled<br />
Pd 4d–H 1s anti-bonding orbital 13 formed due to the bonding<br />
of hydrogen. From here on this peak will be labelled ‘‘the<br />
hydrogen anti-bonding peak’’. The decrease of the white-line<br />
intensity, stronger than for the Ag case, is again caused by a<br />
decrease in the number of 4d holes as a result of a shift of<br />
electron density towards the Pd atoms. Finally, the blue shift is<br />
also a consequence of the strong shift in electron density. The<br />
energy required for the excitation of electrons from the 2p to<br />
the 4d b<strong>and</strong> has increased due to the filling of the holes of<br />
lowest energy in the 4d b<strong>and</strong>.<br />
Fig. 2(b), seems to indicate that the Pd/Ag–H system is not a<br />
simple combination of the separate effects of Ag <strong>and</strong> H as<br />
described above. First of all, the decrease in white-line intensity<br />
between the two plots in Fig. 2(b) is smaller than the difference<br />
between Pd <strong>and</strong> Pd/Ag in Fig. 2(a). Secondly, the intensity of<br />
the hydrogen anti-bonding peak at 3181 eV has also significantly<br />
changed with respect to pure Pd.<br />
The first FEFF results, Fig. 3(a), show that the Pd–H<br />
XANES is well reproduced with the PdH 0.6 model (#1) described<br />
in the materials <strong>and</strong> methods section. All experimental<br />
features are present with reasonable correct intensity <strong>and</strong><br />
position, even the shoulder at 3194 eV is visible in the model<br />
results. This proves that the FEFF 8.2 program is suited to<br />
calculate the XANES of this kind of metal hydrides.<br />
Application of the Pd–H model to the Pd/Ag–H system, by<br />
replacing 20% of the Pd atoms with Ag, did not result in a<br />
satisfactorily simulation of the experimental result. Fig. 3(b)<br />
shows that the intensity of the white-line of the Pd 0.8 Ag 0.2 H 0.6<br />
model is much smaller than found experimentally (Fig. 2(b)).<br />
Furthermore, the FEFF calculations show the same intensity<br />
of the hydrogen anti-bonding peak for the Pd–H <strong>and</strong> Pd/Ag–H<br />
systems, while experimentally the peak is significantly weaker<br />
for the Pd/Ag–H system.<br />
In the second Pd/Ag model (#3) the amount of dissolved<br />
hydrogen is, in line with the H 2 partial pressure/solubility<br />
relation at the experimental conditions, 32 reduced from 0.6 to<br />
0.4 per metal atom. In Fig. 4 the calculated XANES of this<br />
model is plotted together with the PdH 0.6 model.<br />
When this figure is compared with Fig. 2(b) it is clear that the<br />
experimental results are reproduced in great detail. Note that<br />
the Pd/Ag model result replicates the experimental decrease in<br />
white-line <strong>and</strong> hydrogen anti-bonding peak intensity. Though<br />
the amplitudes of the waves in the calculated spectra are<br />
stronger <strong>and</strong> the hydrogen anti-bonding peak is moved to<br />
slightly higher energy than found experimentally, all the experimental<br />
features are present <strong>and</strong> have correct relative<br />
intensities. Clearly the Pd/Ag–H XANES can be described as<br />
a combination of the separate effects of Ag <strong>and</strong> H described<br />
above <strong>and</strong> no other influences on the XANES have been<br />
detected. The large differences between Fig. 3(b) <strong>and</strong> Fig. 4<br />
demonstrate the strong influence of the hydrogen content on<br />
the Pd/Ag–H XANES.<br />
Fig. 5 demonstrates the influence of Ag clustering on the<br />
XANES. It can be seen that the intensity of the white-line of<br />
the Ag cluster model is significantly stronger compared to the<br />
evenly distributed Ag model. In our opinion this is a direct<br />
consequence of the fact that there are now fewer Ag atoms in<br />
close vicinity to the central Pd atom than in the evenly<br />
distributed model. This effect could be somewhat stronger<br />
experimentally since the XANES is an average of all Pd atoms<br />
<strong>and</strong> not just the ones adjacent to an Ag cluster. It is expected<br />
that Ag clustering will be observable with XANES, especially<br />
when the metals form sufficiently large pure Pd <strong>and</strong> pure Ag<br />
domains to influence the observed lattice constants. As<br />
This journal is & The Owner Societies 2004<br />
Phys. Chem. Chem. Phys., 2004, 6 , 3903–3906 3905
Klementiev <strong>and</strong> Edmund Welter) is gratefully acknowledged.<br />
This research was carried out under a grant from NWO-CW<br />
(Netherl<strong>and</strong>s Organization for Scientific Research, Chemical<br />
Sciences) with financial contributions of Shell Global Solutions<br />
International, Senter <strong>and</strong> the Dutch Ministry of Environmental<br />
Affairs. The research of FMFdG is supported by the<br />
Netherl<strong>and</strong>s Research School Combination on <strong>Catalysis</strong><br />
(NRSCC) <strong>and</strong> by a Science-Renewal Fund of NWO-CW. D.<br />
C. Koningsberger <strong>and</strong> D. Ramaker are acknowledged for<br />
valuable discussions.<br />
Fig. 4 Comparison of PdH 0.6 , model #1 (black) <strong>and</strong> Pd 0.8 Ag 0.2 H 0.4 ,<br />
model #3 (grey).<br />
Fig. 5 Comparison of Pd 0.8 Ag 0.2 H 0.4 octahedral Ag r<strong>and</strong>omly<br />
distributed, model #3 (black) <strong>and</strong> Ag clustered in one cube, model<br />
#4 (grey).<br />
discussed for Fig. 2(a) lattice constant changes lead to shifts in<br />
peak positions.<br />
4. Conclusions<br />
For the first time the Pd/Ag–H XANES has been determined<br />
experimentally <strong>and</strong> modelled theoretically. A model of fcc-Pd/<br />
Ag with the Ag atoms evenly distributed through the system<br />
<strong>and</strong> the hydrogen atoms placed in the octahedral holes was<br />
able to explain the observed XANES in great detail. The Pd/Ag<br />
–H Pd L 3 edge XANES can be considered to be a combination<br />
of the separate effects of Ag <strong>and</strong> H on Pd.<br />
The FEFF calculations show that the Pd/Ag–H system<br />
generates an anti-bonding Pd–H b<strong>and</strong>, in close agreement with<br />
the experimental results. In addition the calculations show that<br />
the hydrogen content of the system strongly influences the<br />
XANES, especially the intensity of the white-line <strong>and</strong> the antibonding<br />
peak. In contrast the influence of the Ag atoms is<br />
limited to relatively small changes in the white-line intensity.<br />
However simulations showed that a change of the Ag distribution<br />
within the Pd/Ag fcc lattice from well-mixed to clustered<br />
has a significant influence on the Pd L 3 edge white-line<br />
intensity. The experiments show that, under the present conditions,<br />
the Pd/Ag–H system can be described as Pd/AgH 0.4<br />
versus PdH 0.6 for the pure palladium system.<br />
Acknowledgements<br />
We thank Luci Correia of ECN for supplying the Pd sample,<br />
Hien Duy Tong of the MESA 1 Institute of Twente University<br />
for supplying the Pd/Ag sample <strong>and</strong> A. J. M. Mens of the U.U.<br />
for the XPS depth-profiling. The XANES work was supported<br />
by the IHP-Contract HPRI-CT-2001-00140 of the European<br />
Commission. The staff of HASYLAB beam line E4 (Kontantin<br />
References<br />
1 S. Uemiya, Sep. Purif. Methods, 1999, 28, 51.<br />
2 S. Uemiya, T. Matsuda <strong>and</strong> E. Kikuchi, J. Membrane Sci., 1991,<br />
56, 315.<br />
3 S. N. Paglieri <strong>and</strong> J. D. Way, Sep. Purif. Method., 2002, 31, 1.<br />
4 Y. S. Cheng <strong>and</strong> K. L. Yeung, J. Membrane Sci., 1999, 158, 127.<br />
5 R. Dittmeyer, V. Ho¨ llein <strong>and</strong> K. Daub, J. Mol. Catal. A, 2001,<br />
173, 135.<br />
6 S. Tosti, A. Basile, G. Chiappetta, C. Rizello <strong>and</strong> V. Violante,<br />
Chem. Eng. J., 2003, 93, 23.<br />
7 J. N. Keuler <strong>and</strong> L. Lorenzen, Ind. Eng. Chem. Res., 2002, 41,<br />
1960.<br />
8 G. L. Holleck, J. Phys. Chem., 1970, 74, 503.<br />
9 X. Ke <strong>and</strong> G. J. Kramer, Phys. Rev. B, 2002, 66, 184304.<br />
10 J. N. Keuler <strong>and</strong> L. Lorenzen, J. Membrane Sci., 2002, 195, 203.<br />
11 A. G. Knapton, Platinum Metals Rev., 1977, 21, 44.<br />
12 D. Fort, J. P. G. Farr <strong>and</strong> I. R. Harris, J. Less-Common Met.,<br />
1975, 39, 293.<br />
13 A. V. Soldatov, S. D. Longa <strong>and</strong> A. Biancconi, Solid State<br />
Commun., 1993, 85, 863.<br />
14 K. Ohtani, T. Fujikawa, T. Kubota, K. Asakura <strong>and</strong> Y. Iwasawa,<br />
Jpn. J. Appl. Phys., 1998, 37, 4134.<br />
15 K. Kokko, R. Laithia, M. Alatalo, P. T. Salo, M. P. J. Punkkinen,<br />
I. J. Väyrynen, W. Hergert <strong>and</strong> D. Ködderitzsch, Phys. Rev. B,<br />
1999, 60, 4659.<br />
16 I. Coulthard <strong>and</strong> T. K. Sham, Phys. Rev. Lett., 1996, 77, 4824.<br />
17 I. A. Abrikosov, W. Olovsson <strong>and</strong> B. Johansson, Phys. Rev. Lett.,<br />
2001, 87, 1764031.<br />
18 O. M. Løvvik <strong>and</strong> R. A. Olsen, J. Alloy. Compd., 2002,<br />
330–332, 332.<br />
19 L. C. Witjens, J. H. Bitter, A. J. van Dillen, F. M. F. de Groot, D.<br />
C. Koningsberger <strong>and</strong> K. P. de Jong, Phys. Scr., 2004, accepted.<br />
20 A. L. Ankudinov, B. Ravel, J. J. Rehr <strong>and</strong> S. D. Conradson, Phys.<br />
Rev. B, 1998, 58, 7565.<br />
21 S. L. M. Schroeder, G. D. Moggridge, R. M. Lambert, T.<br />
Rayment, in Spectroscopy for Surface Science, ed. R. J. H. Clark<br />
<strong>and</strong> R. E. Hester, Wiley, New York, 1998, ch. 1.<br />
22 J. A. Bearden <strong>and</strong> A. F. Burr, Rev. Mod. Phys., 1967, 39, 125.<br />
23 H. C. Jamieson, G. C. Weatherly <strong>and</strong> F. D. Manchester, J. Less-<br />
Common Met., 1976, 50, 85.<br />
24 A. Ankudinov, B. Ravel, J. J. Rehr, FEFF 8.00 Manual, University<br />
of Washington: Seattle, 1999, p. 11.<br />
25 I. Karakaya, W. T. Thompson, in Binary Alloy Phase Diagrams,<br />
2nd edn., eds. T. B. Massalski, H. Okamoto, Metals Park: ASM<br />
International, 1991, vol. 3, p. 55–56.<br />
26 O. L. J. Gijzeman, Surf. Sci., 1985, 150, 1.<br />
27 T. K. Sham, Phys. Rev. B, 1985, 31, 1888.<br />
28 J. J. Vuillemin <strong>and</strong> M. G. Priestly, Phys. Rev. Lett., 1965, 14, 307.<br />
29 J. J. Vuillemin, Phys. Rev., 1966, 144, 396.<br />
30 F. M. Mueller, A. J. Freeman, J. O. Dimmock <strong>and</strong> A. M.<br />
Furdyna, Phys. Rev. B, 1970, 12, 4617.<br />
31 J. Stöhr, NEXAFS Spectroscopy, Springer Verlag, Berlin, 1992.<br />
32 E. Wicke, H. Brodowsky, in Topics in Applied Physics, Volume 29,<br />
Hydrogen in Metals II: Application-Oriented Properties, eds. G.<br />
Alefeld, J. Vo¨ lkl, Springer-Verlag, Berlin, 1978, Chapter 3, p. 118.<br />
33 S. D. Axelrod <strong>and</strong> A. C. Makrides, J. Phys. Chem., 1964, 68, 2154.<br />
34 P. Eckerlin, H. K<strong>and</strong>ler, in L<strong>and</strong>olt-Bo¨rnstein, Numerical Data <strong>and</strong><br />
Functional Relationships in Science <strong>and</strong> Technology, Group III:<br />
Crystal <strong>and</strong> Solid State Physics, ed. K.-H. Hellwege, Springer-<br />
Verlag, Berlin, 1971, vol. 6, p. 202.<br />
3906 Phys. Chem. Chem. Phys., 2004, 6 , 3903–3906 This journal is & The Owner Societies 2004