In Situ Spectroscopic Investigation of Molecular Structures of Highly ...
In Situ Spectroscopic Investigation of Molecular Structures of Highly ...
In Situ Spectroscopic Investigation of Molecular Structures of Highly ...

You also want an ePaper? Increase the reach of your titles
YUMPU automatically turns print PDFs into web optimized ePapers that Google loves.
10844 J. Phys. Chem. B, Vol. 102, No. 52, 1998 Gao et al.TABLE 1: Surface Areas and Compositions <strong>of</strong> V 2 O 5 /SiO 2Catalystscatalystsurface area(m 2 /g)wt %V 2O 5asurface density(V atom/nm 2 )SiO 2 332 0.0 0.01% V 2O 5/SiO 2 306 0.9 0.25% V 2O 5/SiO 2 274 4.3 0.910% V 2O 5/SiO 2 234 8.7 1.912% V 2O 5/SiO 2 254 11.7 2.615% V 2O 5/SiO 2 233 14.2 3.3aActual V 2O 5 concentration obtained by atomic absorption.the Kubelka-Munk function F(R ∞ ) from the absorbance. Theband-gap energy (E g ) for allowed transitions was determinedby finding the intercept <strong>of</strong> the straight line in the low-energyrise <strong>of</strong> a plot <strong>of</strong> [F(R ∞ ) × hν] 2 against hν, where hν is theincident photon energy. 22 Samples were loaded in a quartz flowcell with a Suprasil window. After each treatment, the quartzcell was quickly sealed <strong>of</strong>f and cooled to room temperature forDRS measurements. The hydrated spectra were obtained underambient conditions. The dehydrated spectra were obtained aftersamples were calcined at 500 °C in flowing O 2 /He for 1 h. TheDRS spectra for methanol chemisorption were recorded afterthe dehydrated samples were exposed to a gaseous mixture <strong>of</strong>CH 3 OH/O 2 /He (4 mol % CH 3 OH in the saturated gaseousmixture) at 120 or 230 °C for 30 min.4. X-ray Absorption Spectroscopy (XANES). The X-rayabsorption experiments at the V K edge were performed onbeam line X19A at the National Synchrotron Light Source,Brookhaven National Laboratory. The storage ring operatedat 2.5 GeV with a current between 200 and 300 mA. A quartzin situ XAFS cell with Kapton windows was used for XANESmeasurements. XANES spectra were initially acquired at roomtemperature in a He purge and after heating to 500 °C at10°C/min in O 2 /He (20/80), holding for 30 min at 500 °C, andthen cooling to room temperature. The experimental detailsare described elsewhere. 19The XANES spectra were processed using the BAN s<strong>of</strong>twarepackage. The energy scale for vanadium oxide was establishedby setting the first inflection point <strong>of</strong> the vanadium metal inthe derivative spectrum at 5465.0 eV to zero. The spectra werenormalized to unity absorption by dividing by a least-squaresfit <strong>of</strong> the absorption between 50 and 250 eV above theabsorption edge.Results1. Bulk Compositions and Surface Areas <strong>of</strong> the V 2 O 5 /SiO 2 Catalysts. The nominal and actual bulk compositions andsurface areas <strong>of</strong> V 2 O 5 /SiO 2 catalysts are presented in Table 1.The actual V 2 O 5 concentrations <strong>of</strong> the V 2 O 5 /SiO 2 samples areonly slightly in variance with the expected values. Unlessotherwise notified, all vanadia loadings mentioned in the paperare referred to the nominal values. The surface area <strong>of</strong> the V 2 O 5 /SiO 2 samples decreases systematically with increasing vanadialoading.2. Raman Spectroscopy. The Raman spectra <strong>of</strong> thedehydrated 0-15% V 2 O 5 /SiO 2 samples are shown in Figure 1.The silica support possesses Raman features at ∼410, ∼487,607, 802, and ∼976 cm -1 . The ∼976 cm -1 band, which isassociated with Si-OH stretching mode <strong>of</strong> the surface hydroxyls,23 decreases with increasing vanadia loading. The bandsat ∼802 and 410-430 cm -1 , which have been assigned to thesymmetrical Si-O-Si stretching mode and the Si-O-Sibending mode, respectively, 24 decrease with increasing vanadiaFigure 1. Raman spectra <strong>of</strong> the dehydrated V 2O 5/SiO 2 samples.loading, suggesting the breaking <strong>of</strong> Si-O-Si bridges. Thebroad bands at 607 and 487 cm -1 are assigned to D2 and D1defect modes, which have been attributed to tri- and tetracyclosiloxanerings produced via the condensation <strong>of</strong> surfacehydroxyls, respectively. 20,24 A sharp band at ∼1040 cm -1 wasobserved for all the dehydrated V 2 O 5 /SiO 2 samples, which hasbeen assigned to the VdO stretching vibration <strong>of</strong> isolated VO 4species. 12,13 The Raman band at 607 cm -1 due to the threememberedrings <strong>of</strong> the silica support significantly decreases withincreasing vanadia loading, suggesting that the number <strong>of</strong> threemembersiloxane rings decreases upon dispersion <strong>of</strong> the surfacevanadium oxide species. <strong>In</strong> addition, two broad Raman bandsappear at ∼1075 and ∼915 cm -1 , and their intensity does notchange noticeably with increasing vanadia loading. These twobands, which are also observed in the dehydrated, highlydispersed TiO 2 /SiO 2 system, 19 are characteristic <strong>of</strong> Si-O - andSi(-O - ) 2 functionalities 25 and can be assigned to perturbed silicavibrations that are indicative <strong>of</strong> the formation <strong>of</strong> V-O-Sibonds. These results reveal that in addition to the consumption<strong>of</strong> Si-OH hydroxyls, the deposition <strong>of</strong> the surface vanadiumoxide species also breaks some Si-O-Si siloxane bridges forthe formation <strong>of</strong> V-O-Si bridging bonds. When the loadingreaches 12% V 2 O 5 on silica, a very weak Raman band appearsat ∼144 cm -1 , which is due to the formation <strong>of</strong> a trace amount<strong>of</strong> crystalline V 2 O 5 . This result demonstrates that the maximumcoverage <strong>of</strong> surface vanadium oxide species on this SiO 2 supportis achieved at ∼2.6 V atoms/nm 2 (see Table 1). Even at thismaximum coverage, no extra Raman bands, which might berelated to V-O-V polymeric species, are observable. At 15%V 2 O 5 loading, strong Raman bands due to V 2 O 5 crystallites areshown at 994, 697, 518, 404, 303, 284, and 144 cm -1 .However, the broad bands between 400 and 600 cm -1 seemmuch stronger than the combined bands due to both silica andcrystalline V 2 O 5 vibrations, which suggest the possible coexistence<strong>of</strong> an additional unknown vanadium oxide species.The Raman spectra <strong>of</strong> the fully hydrated 1-12% V 2 O 5 /SiO 2samples are provided in Figure 2. These spectra are very similar
<strong>Molecular</strong> <strong>Structures</strong> <strong>of</strong> Dispersed V 2 O 5 /SiO 2 J. Phys. Chem. B, Vol. 102, No. 52, 1998 10845TABLE 2: Comparison <strong>of</strong> Raman Frequencies <strong>of</strong>VO x -H 2 O-Containing Samplessample Raman bands (cm -1 )10% V 2O 5/SiO 2 1020, 704, 652, 519, 273, 161(fully hydrated)aqueous VO x species a 1020, 883, 751, 706, 669, 512, 408, 341, 263,154, 129V 2O 5‚1.2 H 2O b 1020, 895, 707, 668, 510, 485, 400, 350, 325,(xerogel powder) 278, 265, 156, 135V 2O 5 crystallites 994, 697, 518, 477, 404, 303, 284, 144aAqueous VO x species extracted from the 9% V 2O 5/SiO 2 sample.bObtained from ref 27.Figure 2. Raman spectra <strong>of</strong> the hydrated V 2O 5/SiO 2 samples.Figure 4. <strong>In</strong> situ Raman spectra <strong>of</strong> the 5% V 2O 5/SiO 2 sample duringmethanol oxidation.Figure 3. Raman spectra <strong>of</strong> (a) the partially hydrated 10% V 2O 5/SiO 2sample and (b) the aqueous VO x species extracted from V 2O 5/SiO 2.regardless <strong>of</strong> the vanadia loading. Five broad bands areobserved at ∼1020, ∼704, ∼652, 506-523, 264-274, and155-164 cm -1 . These bands have been simply assigned tohydrated amorphous V 2 O 5 -like species because <strong>of</strong> their similarityto the Raman bands <strong>of</strong> V 2 O 5 crystallites. 12 It is interesting tonote that as the loading increases from 1% to 12% V 2 O 5 , thelast three bands blue shift from 506 to 523, 264 to 274, and155 to 164 cm -1 . These blue shifts may be related to theshortening <strong>of</strong> some V-O bond lengths with increasing vanadiaconcentration on the silica surface since the V-O bond lengthis inversely correlated with the Raman vibrational frequencyas established by Hardcastle and Wachs. 26The Raman spectrum <strong>of</strong> the partially hydrated 10% V 2 O 5 /SiO 2 sample that was slightly exposed to moisture for a shorttime is shown in Figure 3a. Partial hydration <strong>of</strong> the dehydratedsample changes the sample color from white to light yellow,and the sample becomes deep red when fully hydrated. Forthis partially hydrated sample, broad Raman bands are observedat 1035-1010, 915, 694, 647, 493, and ∼320 cm -1 , which arevery different from the bands observed for the fully hydratedand dehydrated samples. These results indicate that the molecularstructure <strong>of</strong> surface vanadium oxide species on silica isdependent on the degree <strong>of</strong> hydration.To fully understand the hydration effect on the molecularstructure <strong>of</strong> the V 2 O 5 /SiO 2 catalysts, liquid water was added tothe 9% V 2 O 5 /SiO 2 sample. It was found that the surfacevanadium oxide species are extractable from the silica surface,resulting in a deep red transparent solution and a SiO 2 solidwith ∼0.6% V 2 O 5 remaining on the surface. Once the VO xspecies leave the surface to the solution, they cannot beredispersed as surface species onto the silica surface again sincethe calcination <strong>of</strong> the mixture <strong>of</strong> the red transparent solutionand the silica support only results in V 2 O 5 crystallites. TheRaman spectrum <strong>of</strong> this deep red solution is provided in Figure3b, which is similar, but not identical, to the Raman spectra <strong>of</strong>the fully hydrated V 2 O 5 /SiO 2 samples shown in Figure 2 (alsosee Table 2). <strong>In</strong> addition, it is noted that concentrating ordiluting <strong>of</strong> the solution changes its Raman spectrum. <strong>In</strong>terestingly,the best match <strong>of</strong> the Raman spectra <strong>of</strong> the aqueous VO xspecies extracted from the V 2 O 5 /SiO 2 sample is the Ramanspectra <strong>of</strong> V 2 O 5 ‚nH 2 O xerogel 27 (see Table 2). Some spectraldifferences, such as the broadening <strong>of</strong> Raman bands for theaqueous VO x species, may be expected because <strong>of</strong> their differentphysical states. Therefore, the molecular structure <strong>of</strong> the fullyhydrated surface vanadium oxide species on silica closelyresembles V 2 O 5 ‚nH 2 O gels, rather than V 2 O 5 crystallites.The in situ Raman spectra <strong>of</strong> the 5% V 2 O 5 /SiO 2 sampleduring methanol oxidation are presented in Figure 4. <strong>In</strong> theC-H vibration region, Raman bands at ∼2953, ∼2930, 2854,and 2832 cm -1 , due to methanol chemisorption, are observedwhen methanol is introduced in the feed stream. The bands at
10846 J. Phys. Chem. B, Vol. 102, No. 52, 1998 Gao et al.TABLE 3: Band Maxima and Edge Energies <strong>of</strong> Hydratedand Dehydrated V 2 O 5 /SiO 2 Catalystscatalystsband max.(nm) (dehy.)E g (eV)(dehydrated)band max.(nm) (hydr.)E g (eV)(hydr.)1% V 2O 5/SiO 2 278 3.6 283, 426 2.55% V 2O 5/SiO 2 286 3.5 285, 433 2.410% V 2O 5/SiO 2 298 3.4 278, 436 2.412% V 2O 5/SiO 2 298 3.4 282, 417 2.515% V 2O 5/SiO 2 298, 410(sh),481(sh)3.3 280-440 2.4Figure 5. UV-vis DRS spectra <strong>of</strong> the dehydrated V 2O 5/SiO 2 samples.∼2953 and ∼2854 cm -1 are characteristic <strong>of</strong> the C-H stretchingvibrations <strong>of</strong> the surface methoxy species on the silica support(Si-OCH 3 ), 21 whereas the Raman bands at ∼2930 and ∼2832cm -1 are assigned to the C-H stretching vibrations <strong>of</strong> thesurface V-methoxy groups. 21 The surface V-methoxy specieson SiO 2 are less stable than the Si-methoxy species becausethe Raman band intensity <strong>of</strong> the V-methoxy species decreasessubstantially relative to the Si-methoxy species when methanolis removed from the feed stream, as shown in Figure 4B.<strong>In</strong> the lower wavenumber region (Figure 4A), three Ramanbands at ∼1069, ∼1029, and 665 cm -1 are observed whenmethanol is introduced. The assignment <strong>of</strong> these bands needsto be careful because both C-O and VdO stretching vibrationsmay occur in 1000-1080 cm -1 region. During methanoloxidation, the change <strong>of</strong> one <strong>of</strong> the Si(IV)-O - ligands aroundthe V cation by CH 3 O - may change the VdO stretchingfrequency. For example, the Raman VdO stretching frequency<strong>of</strong> the monomeric (CH 3 O) 2 VO 2- complex is observed at 926cm -1 , while the VdO stretching frequency <strong>of</strong> the monomeric(HO) 2 VO - 2 is9cm -1 higher. 28 <strong>In</strong> addition, the VdO stretchingfrequency <strong>of</strong> the [(ClCH 2 CH 2 O) 3 VO] 2 compound appears at1007 cm -1 . 28 Therefore, the formation <strong>of</strong> surface V-methoxyspecies on silica may result in a modest red shift <strong>of</strong> the VdOstretching frequency since the electronegativity <strong>of</strong> CH 3 O - isexpected to be relatively lower than that <strong>of</strong> Si(IV)-O - , 29 whichsuggests that the 1029 cm -1 band may be assigned to the VdOstretching vibration <strong>of</strong> the surface V-methoxy species. Thepossible effect <strong>of</strong> water on the VdO vibration can be excludedsince no spectral change was observed at 230 °C even in thepresence <strong>of</strong> water vapor. 30 Furthermore, it has been reportedthat the C-O and M-O stretching vibrations <strong>of</strong> some groupIVB and VB metal ethoxides occur at 1029-1072 cm -1 and550-625 cm -1 , respectively. 31 It is reasonable to assume thatthe Raman bands at ∼1069 and 665 cm -1 are associated withthe C-O and V-O stretching vibrations <strong>of</strong> the surfaceV-methoxy species, respectively. The Raman results suggestthat most <strong>of</strong> the V sites are involved in methanol chemisorptionduring the oxidation reaction.3. UV-Vis-NIR Diffuse Reflectance Spectroscopy. TheUV-vis DRS spectra <strong>of</strong> the dehydrated 1%-15% V 2 O 5 /SiO 2samples are presented in Figure 5, and their band maxima andedge energies are summarized in Table 3. No absorption wasobserved on pure silica. 19 For the 1%-12% V 2 O 5 /SiO 2 samples,only one LMCT band is observed, indicating that the vanadiumoxide species are well dispersed in these samples. The bandmaximum red shifts from 278 to 298 nm and the correspondingedge energy has a minor shift from 3.6 to 3.4 eV as the loadingincreases from 1% to 12%V 2 O 5 . At the 15% V 2 O 5 loading,two weak shoulders appear at ∼410 and 481 nm. The 481 nmTABLE 4: Band Maxima and Edge Energies <strong>of</strong>V-Reference Compoundscompoundsband max.(nm)E g(eV)molecular structure aV 2O 5 236, 334, 481 2.3 polymerized VO 5/VO 6MgV 2O 6250, 370 2.8 polymerized VO 6(meta-vanadate)NaVO 3281, 353 3.2 polymerized VO 4(meta-vanadate)NH 4VO 3288, 363 3.2 polymerized VO 4(meta-vanadate)Mg 2V 2O 7280 3.5 dimeric VO 4(pyro-vanadate)Mg 3V 2O 8260, 303 3.5 isolated VO 4(ortho-vanadate)Na 3VO 4(ortho-vanadate)253, 294 3.9 isolated VO 4a<strong>Molecular</strong> structures are assigned from references listed below:V 2O 5, ref 32 (the molecular structure <strong>of</strong> V 2O 5 consists <strong>of</strong> distortedtetragonal pyramids sharing edges and corners to form layers, whichcan be regarded as polymerized VO 5 units. However, each nonbridgingoxygen acts as a sixth neighbor to a V atom in an adjacent layer, whichcan also be considered as a highly distorted VO 6 configuration). NaVO 3,ref 33. NH 4VO 3, ref 34. Na 3VO 4, ref 35. MgV 2O 6, refs 36, 37. Mg 2V 2O 7,refs 37, 38 (the molecular structure <strong>of</strong> Mg 2V 2O 7 consists <strong>of</strong> chains <strong>of</strong>edge sharing V 2O 7 groups. These V 2O 7 groups are composed <strong>of</strong> cornersharingVO 4 tetrahedra, with a weak fifth V-O bond at either end.The vanadium cations are thus considered as 5-fold coordinated.However, 51 V NMR spectra <strong>of</strong> Mg 2V 2O 737ashow two V sites withtetrahedral environments: one is very similar to that <strong>of</strong> Mg 3V 2O 8, theother is a distorted VO 4 structure. The results suggest that the molecularstructure <strong>of</strong> Mg 2V 2O 7 is better represented by dimeric VO 4). Mg 3V 2O 8,refs 37, 39.Figure 6. (A) NIR DRS spectra <strong>of</strong> the dehydrated V 2O 5/SiO 2 samples;(B) the relative intensity <strong>of</strong> isolated surface Si-OH hydroxyls (7315cm -1 ) as a function <strong>of</strong> V surface density.band is due to the formation <strong>of</strong> a small amount <strong>of</strong> V 2 O 5crystallites that exhibit LMCT bands at 236, 334, and 481 nm(see Table 4). However, the 410 nm band is unknown and maybe associated with the vanadium oxide species unidentified byRaman spectroscopy.<strong>In</strong> the corresponding NIR region (Figure 6A), where theovertone and combination bands <strong>of</strong> hydroxyls are located, the
<strong>Molecular</strong> <strong>Structures</strong> <strong>of</strong> Dispersed V 2 O 5 /SiO 2 J. Phys. Chem. B, Vol. 102, No. 52, 1998 10847Figure 7. UV-vis DRS spectra <strong>of</strong> the hydrated V 2O 5/SiO 2 samples.7315 cm -1 band due to the surface isolated Si-OH groupsdecreases substantially with increasing vanadia loading anddisappears at loadings <strong>of</strong> 12% V 2 O 5 and above. A band at 7245cm -1 , which may previously be overlapped by the strong 7315cm -1 band, shows up and does not change noticeably up to the15% V 2 O 5 loading. The amount <strong>of</strong> the isolated Si-OHhydroxyls relative to the pure SiO 2 support is plotted as afunction <strong>of</strong> the V surface density in Figure 6B. As the vanadialoading increases from 1% to 12% V 2 O 5 , the sharp decrease inthe relative amount <strong>of</strong> the isolated Si-OH hydroxyls demonstratesthat deposition <strong>of</strong> the surface vanadium oxide speciessignificantly consumes the surface Si-OH hydroxyls and themaximum surface coverage <strong>of</strong> vanadium oxide is achieved ataround 12% V 2 O 5 , which is consistent with Raman results. Thehydroxyls contributing to the absorption at 7245 cm -1 mightbe the remaining inaccessible Si-OH hydroxyls. Among thesehydroxyls, only a small percentage can be exchanged bydeuterium through D 2 O adsorption experiments (
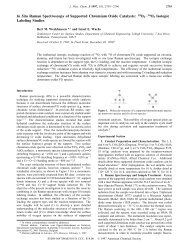
10848 J. Phys. Chem. B, Vol. 102, No. 52, 1998 Gao et al.Figure 8. UV-vis DRS spectra <strong>of</strong> the 1% V 2O 5/SiO 2 sample after(a) O 2/He, 500 °C; (b) CH 3OH/O 2/He, r.t.; (c) CH 3OH/O 2/He, 120 °C;(d) CH 3OH/O 2/He, 230 °C.TABLE 5: Band Maxima and Edge Energies <strong>of</strong> 1%V 2 O 5 /SiO 2 after Methanol Adsorption at VariousTemperaturesconditions band max. (nm) E g (eV)MeOH/O 2/He, r.t. 265, 370 2.7MeOH/O 2/He, 120 °C 252, 310(sh) 3.7MeOH/O 2/He, 230 °C 249, 306(sh) 3.8The UV-vis DRS spectra <strong>of</strong> the 1% V 2 O 5 /SiO 2 sampleduring methanol oxidation at various temperatures are shownin Figure 8, and the corresponding edge energies are providedin Table 5. Two LMCT bands at 265 and 370 nm are observedafter methanol adsorption at room temperature with an edgeenergy <strong>of</strong> 2.7 eV, suggesting that the surface vanadium oxidespecies saturated with methanol are highly polymerized VO 6species, similar to the fully hydrated vanadium oxide species.<strong>In</strong>creasing the temperature dramatically changes the spectralfeature as well as the edge energy. At 120 °C, the LMCTtransitions appear at 252 and 310 (shoulder) nm and the edgeenergy increases to 3.7 eV. A higher temperature <strong>of</strong> 230 °Ceven increases the edge energy further to 3.8 eV. As discussedabove for the V(V)-reference compounds, the ligand change aswell as the structural symmetry change may change the edgeenergy <strong>of</strong> the central V(V) cations. Nevertheless, these highvalues <strong>of</strong> edge energy (3.7-3.8 eV) strongly suggest that theV(V) cations on silica after methanol chemisorption at hightemperatures (>100 °C) are isolated VO 4 species. The significantlylower band intensity indicates that the absorptioncoefficient <strong>of</strong> the 4-fold coordinated V-methoxy species is muchlower than that <strong>of</strong> the 4-fold coordinated surface vanadium oxidespecies.<strong>In</strong> the corresponding NIR region shown in Figure 9, methanolchemisorption at 120 °C dramatically decreases the 7315 cm -1band owing to isolated Si-OH hydroxyls. A much less intenseband appears at 7231 cm -1 , together with a new, broad band at5898 cm -1 due to the 2ν overtone vibrations <strong>of</strong> surface V- andSi-methoxy species since both species are also detected by insitu Raman experiments. It has been reported 43 that the 2νovertone band <strong>of</strong> isolated silanol groups on the dehydrated silicasurface red shifts by 100-150 cm -1 owing to the formation <strong>of</strong>the Si-OH‚‚‚OH 2 adduct upon the adsorption <strong>of</strong> water. Thus,most <strong>of</strong> the hydroxyls exhibiting the band at 7231 cm -1 maybe associated with the methoxy perturbed Si-OH hydroxyls,together with a small amount being contributed from theinaccessible Si-OH hydroxyls (∼26%). <strong>In</strong>terestingly, almostall the isolated Si-OH hydroxyls on the 1% V 2 O 5 /SiO 2 sampleare affected by chemisorption <strong>of</strong> methanol, which is in contrastto the pure silica support, where only a very minor amount <strong>of</strong>Figure 9. NIR DRS spectra <strong>of</strong> the 1% V 2O 5/SiO 2 sample after (a)O 2/He, 500 °C; (b) CH 3OH/O 2/He, 120 °C; (c) CH 3OH/O 2/He, 230°C.Figure 10. The V K-edge XANES spectra <strong>of</strong> the 10% V 2O 5/SiO 2sample in hydrated and dehydrated states.Si-OH hydroxyls are affected under the same experimentalconditions. 19 Somehow the deposition <strong>of</strong> even a small amount(0.2 V atoms/nm 2 ) <strong>of</strong> surface vanadium oxide species on silicasignificantly modified the silica surface. This result alsoindicates that the surface vanadium oxide species are evenlydispersed over the entire silica surface. Methanol oxidation at230 °C gives basically the same spectral feature.4. X-ray Absorption Spectroscopy (XANES). The VK-edge XANES spectra <strong>of</strong> the 10% V 2 O 5 /SiO 2 sample inhydrated and dehydrated states are presented in Figure 10. Theupper panel shows the full 200 eV XANES, and the lower panelis an enlargement <strong>of</strong> the preedge region. For comparison andenergy calibration, the V K-edge XANES spectra <strong>of</strong> V 2 O 5 andNH 4 VO 3 reference compounds were also recorded (not shownhere), which are in excellent agreement with those previouslyreported by Wong et al. 44 and Yoshida et al. 15 The energypositions <strong>of</strong> the main spectral features are summarized in Table
<strong>Molecular</strong> <strong>Structures</strong> <strong>of</strong> Dispersed V 2 O 5 /SiO 2 J. Phys. Chem. B, Vol. 102, No. 52, 1998 10851Figure 12. Hydration process proposed for surface vanadium oxidespecies on silica.<strong>of</strong> the V cations is low and/or their coordination is less than 6.The Raman spectrum shown in Figure 3a is associated withsome partially hydrated surface vanadium oxide species. TheRaman bands above 1000 cm -1 , which are characteristic <strong>of</strong>VdO double bonds, are broad and range from 1010 to 1035cm -1 , suggesting that V(V) sites with different local environmentsare present after partial hydration. Another Raman bandobserved at 915 cm -1 is also high enough to be characteristic<strong>of</strong> VdO double bonds, which might be assigned to VdOstretching coordinated with the H 2 O molecule (H 2 O-VdO),as in the case <strong>of</strong> V 2 O 5 ‚nH 2 O gels. 27 Moreover, for V 2 O 5 ‚nH 2 Ogels, the Raman band at 350-325 cm -1 is due to both a ν(V-OH 2 ) stretching mode and a δ(VO) bending mode. Similarly,the broad 320 cm -1 band observed for the partially hydratedsurface vanadium oxide species on silica may also be partlyassociated with the ν(V-OH 2 ) stretching mode. Both the 915and 320 cm -1 bands strongly suggest that some V(V) cationsare bonded to H 2 O molecules. <strong>In</strong> addition, a low-degreepolymerization <strong>of</strong> the hydrolyzed V(V) sites also occurs asevidenced by the Raman bands at 694, 647, and 493 cm -1 owingto the V-O-V stretching modes. Thus, depending on thedegree <strong>of</strong> hydration, surface vanadium oxide species withdifferent local structures could be formed.On the present experimental results and the structuralsimilarity to V 2 O 5 ‚nH 2 O gels, the hydration process <strong>of</strong> thedehydrated surface vanadium oxide species on silica is proposedin Figure 12. The hydration appears to proceed throughchemisorption <strong>of</strong> water molecules and hydrolysis <strong>of</strong> V-O-Sibridging bonds. The formation <strong>of</strong> V-OH groups allows thepolymerization <strong>of</strong> surface V(V) cations via olation along theH 2 O-V-OH direction, in analogy to the condensation process<strong>of</strong> VO(OH) 3 . 50 Full hydration may break all the V-O-Sibridging bonds, resulting in the maximum polymerizationbetween VO 5 units. Consequently, a 2D layered structure, mostlikely bridged by OH groups, may be formed. The Si-OHgroups may serve as the binding sites to stabilize the 2D layeredstructure on the silica surface via hydrogen bonding. Up tothis step, the hydration induced polymerization process is stillreversible, and the isolated VO 4 structure can be obtained afterdehydration at elevated temperatures. However, with largequantities <strong>of</strong> water molecules around the surface, they cancompete and substitute for the Si-OH groups as the bindingsites on the 2D layered structure. Once the VO x species leavethe silica surface by breaking the V‚‚‚OH-Si hydrogen bonds,oxolation occurs to form V 2 O 5 ‚nH 2 O gels with V-O-Vconnections. The final process is irreversible.Figure 13. <strong>In</strong>teraction <strong>of</strong> methanol molecules with surface vanadiumoxide species on silica.<strong>Molecular</strong> <strong>Structures</strong> <strong>of</strong> Surface Vanadium Oxide Specieson SiO 2 under Methanol Chemisorption/Oxidation ReactionConditions. The studies <strong>of</strong> methanol chemisorption are morerelevant to the catalytic behavior <strong>of</strong> dispersed V 2 O 5 /SiO 2catalysts since the V(V) sites usually act as the active sites forvarious oxidation reactions. The interaction <strong>of</strong> methanolmolecules with the surface vanadium oxide species on silica atroom temperature is quite similar to that <strong>of</strong> water molecules.The surface vanadium oxide species on the 1% V 2 O 5 /SiO 2sample, when saturated with methanol at room temperature (seeFigure 8), exhibit very similar LMCT transitions as the fullyhydrated sample. Its edge energy is also very close to that <strong>of</strong>the fully hydrated sample. The results suggest that the surfacevanadium oxide species, when fully saturated with methanol,may possess a similar local structure as the fully hydratedvanadium oxide species. For pure vanadium methoxide,VO(OCH 3 ) 3 , the vanadium atom is in distorted octahedralcoordination and the octahedra are joined together into polymerchains by sharing edges. 52 Since the surface V-methoxycomplexes on silica are polymerized VO 6 units, the V(V) cationsmay be connected together into chain and/or 2D polymers bysharing an edge and/or corner <strong>of</strong> -OCH 3 - groups, dependingon the surface concentration <strong>of</strong> V(V) cations, as shown in Figure13F′. This structure is quite similar to the fully hydratedvanadium oxide species shown in Figure 12F. Higher loadingsamples (g5% V 2 O 5 ) provide essentially similar experimentalresults, but slight reduction occurs simultaneously during theformation <strong>of</strong> the surface V-methoxy species even at roomtemperature in the reaction feed stream.<strong>In</strong>creasing methanol chemisorption temperature to 120 °C andabove removes the physisorbed methanol molecules and changesthe molecular structure <strong>of</strong> the surface vanadium oxide species.<strong>In</strong> situ Raman results demonstrate that (CH 3 O)-VdO methoxyspecies are formed on the silica surface during methanoloxidation. <strong>In</strong> addition, UV-vis DRS results indicate that theV-methoxy species formed at 120 and 230 °C are an isolatedVO 4 structure, and some SiO - ligands in the coordination sphere<strong>of</strong> the V(V) cations are replaced by CH 3 O - ligands. Onepossible structure is illustrated in Figure 13B′, which is verylikely the intermediate structure for the production <strong>of</strong> formaldehydeat the reaction temperature <strong>of</strong> 230 °C and above sincedispersed V 2 O 5 /SiO 2 catalysts produce predominantly formaldehydeduring methanol oxidation. However, it is not clearfrom Raman and UV-vis DRS results how many SiO - ligandscan be substituted by CH 3 O - . It is possible that all three V-O-Si bridging bonds can be broken by methanol chemisorptionsince aggregation <strong>of</strong> surface V-methoxy species on silica wasobserved at high vanadia loadings (g5%) and some volatileV-methoxy species were produced during methanol oxidationat 230 °C.ConclusionsThe molecular structure <strong>of</strong> the surface vanadium oxide specieson silica is a strong function <strong>of</strong> environmental conditions. <strong>In</strong>
10852 J. Phys. Chem. B, Vol. 102, No. 52, 1998 Gao et al.the dehydrated state, the isolated VO 4 species are unique up tomonolayer coverage <strong>of</strong> ∼12 wt % V 2 O 5 (∼2.6 V atoms/nm 2 ).The deposition <strong>of</strong> surface vanadium oxide species consumesmost <strong>of</strong> the surface Si-OH hydroxyls and breaks some surfaceSi-O-Si siloxane bridges. The three-member rings on silicaappear to be the most favorable sites for anchoring the isolated,three-legged (SiO) 3 VdO units. Above monolayer coverage,V 2 O 5 crystallites are formed, possibly with some poorlycrystallized 2D V 2 O 5 patches that possess some interaction withthe silica surface. Hydration dramatically changes the molecularstructure <strong>of</strong> the surface vanadium oxide species, and the degree<strong>of</strong> hydration plays a critical role in determining the specificstructure <strong>of</strong> the vanadium oxide species on the silica surface.During the hydration process, hydrolysis <strong>of</strong> V-O-Si bondsoccurs and V(V) cations may form chain polymers via olation.Full hydration results in maximum polymerization to form chainand/or 2D polymers most likely through V-OH-V bridges.V 2 O 5 ‚nH 2 O gels with independent 2D layers can simply beobtained by adding liquid water to the dispersed V 2 O 5 /SiO 2samples.Upon saturation with methanol molecules at room temperature,the surface vanadium oxide species may form chain and/or 2D polymers through V-OCH 3 -V bridges on the silicasurface. Methanol chemisorption at high temperatures (g120°C) results in isolated, 4-fold coordinated V(V)-methoxy species,which may serve as an intermediate for methanol oxidation.Moreover, alcoholysis <strong>of</strong> the V-O-Si bonds destabilizes thesurface vanadium oxide species, which results in the aggregation<strong>of</strong> the surface vanadium oxide species on silica and production<strong>of</strong> some volatile V-methoxy species during methanol oxidationat high temperatures.Acknowledgment. This work was funded by the U.S.National Science Foundation Grant CTS-9417981. The UVvis-NIRDRS experiments were performed on a Varian Cary5UV-vis-NIR spectrometer that was supported by the U.S.Department <strong>of</strong> Energy, Basic Energy Sciences, Grant DE-FG02-93ER14350. Part <strong>of</strong> the research was carried out at the NationalSynchrotron Light Source, Brookhaven National Laboratory,which is supported by the U.S. Department <strong>of</strong> Energy, Division<strong>of</strong> Materials Sciences and Division <strong>of</strong> Chemical Sciences. Theauthors thank Dr. M. A. Banares for the help with BET surfacearea measurements and chemical analysis.References and Notes(1) Sun, Q.; Jehng, J. M.; Hu, H. H.; Herman, R. G.; Wachs, I. E.;Klier, K. J. Catal. 1997, 165, 91.(2) Irusta, S.; Cornaglia, L. M.; Miro, E. E.; Lombardo, E. A. J. Catal.1995, 156, 167.(3) Banares, M.; Gao, X.; Fierro, J. L. G.; and Wachs, I. E. Stud. Surf.Sci. Catal. 1997, 110, 295.(4) Tanaka, T.; Nishimura, S.; Kawasaki, S.; Ooe, M.; Funabiki, T.;Yoshida, S. J. Catal. 1989, 118, 327.(5) Kaliaguine, S. L.; Shelimov, B. N.; Kazansky, V. B. J. Catal. 1978,55, 384.(6) Anpo, M.; Sunamoto, M.; Che, M. J. Phys. Chem. 1989, 93, 1187.(7) Jonson, B.; Rebenstr<strong>of</strong>, B.; Larsson, R.; Andersson, S. L. J. Chem.Soc., Faraday Trans. 1 1988, 84, 1897.(8) Lische, G.; Hanke, W.; Jerschkewitz, H. G.; Ohlmann, J. J. Catal.1985, 91, 54.(9) Iwamoto, M.; Hirata, J.; Matsukami, K.; Kagawa, S. J. Phys. Chem.1983, 87, 903.(10) (a) Schraml-Marth, M.; Wokaun, A.; Pohl, M.; Krauss, H.-L. J.Chem. Soc., Faraday Trans. 1991, 87, 2635. (b) Scharf, U.; Schraml-Marth,M.; Wokaun, Baiker, A. J. Chem. Soc., Faraday Trans. 1991, 87, 3299.(11) (a) <strong>In</strong>umaru, K.; Okuhara, T.; Misono, M.; Matsubayashi, N.;Shimada, H.; Nishijima, A. J. Chem. Soc., Faraday Trans. 1992, 88, 625.(b) <strong>In</strong>umaru, K.; Okuhara, T.; Misono, M. J. Phys. Chem. 1991, 95, 4826.(c) <strong>In</strong>umaru, K.; Misono, M.; Okuhara, T. Appl. Catal. A,1997, 149, 133.(12) Das, N.; Eckert, H.; Hu, H.; Wachs, I. E.; Walzer, J. F.; Feher, F.J. J. Phys. Chem. 1993, 97, 8240.(13) Went, G. T.; Oyama, S. T.; Bell, A. T. J. Phys. Chem. 1990, 94,4240.(14) Roozeboom, F.; Mittelmeljer-Hazeleger, M. C.; Moulijn, J. A.;Medema, J.; de Beer, V. H. J.; Gellings, P. J. J. Phys. Chem. 1980, 84,2783.(15) (a) Yoshida, S.; Tanaka, T.; Nishimura, Y.; Mizutani, H.; Funabiki,T. the Proc. 9th <strong>In</strong>t. Congr. Catal. 1988, 3, 1473. (b) Yoshida, S.; Tanaka,T.; Hanada, T.; Hiraiwa, T.; Kanai, H.; Funabiki, T. Catal. Lett. 1992, 12,277. (c) Tanaka, T.; Yamashita, H.; Tsuchitani, R.; Funabiki, T.; Yoshida,S. J. Chem. Soc., Faraday Trans. 1 1988, 84, 2987.(16) Arena, F.; Frusteri, F.; Martra, G.; Coluccia, S.; Parmaliana, A. J.Chem. Soc., Faraday Trans. 1997, 93, 3849.(17) Hazenkamp, M. F.; Blasse, G. J. Phys. Chem. 1992, 96, 3442.(18) Deo, G.; Wachs, I. E. J. Phys. Chem. 1991, 95, 5889.(19) Gao, X.; Bare, R. S.; Fierro, J. L. G.; Banares, M.; Wachs, I. E. J.Phys. Chem. B 1998, 102, 5653.(20) Morrow, B. A.; Mcfarlan, A. J. J. Non-Cryst. Solids 1990, 120,61.(21) Jehng, J. M.; Hu, H.; Gao, X.; Wachs, I. E. Catal. Today 1996,28, 335.(22) Delgass, W. N.; Haller, G. L.; Kellerman, R.; Lunsford, J. H.Spectroscopy in Heterogeneous Catalysis; Academic Press: New York,1979.(23) (a) Tallant, D. R.; Bunker, B. C.; Brinker, C. J.; Balfe, C. A. Mater.Res. Soc. Symp. Proc. 1986, 73, 261. (b) Stolen, R. H.; Walrafen, G. E. J.Chem. Phys. 1976, 64, 2623. (c) Brinker, C. J.; Tallant, D. R.; Roth, E. P.;Ashley, C. S. Mater. Res. Soc. Symp. Proc. 1986, 61, 387.(24) Brinker, C. J.; Kirkpatrick, R. J.; Tallant, D. R.; Bunker, B. C.;Montez, B. J. Non-Cryst. Solids 1988, 99, 418.(25) MacMillan, P. Am. Mineral. 1986, 69, 622.(26) Hardcastle, F.; Wachs, I. E. J. Phys. Chem. 1991, 95, 5031.(27) (a) Abello, L.; Husson, E.; Repelin, Y.; Lucazeau, G. J. Solid StateChem. 1985, 56, 379. (b) Repelin, Y.; Husson, E.; Abello, L.; Lucazeau,G. Spectrochim. Acta, 1985, 41A, 993.(28) Ray, W. J.; Post, C. B. Biochemistry 1990, 29, 2779.(29) (a) Sanderson, R. T. J. Chem. Educ. 1988, 65, 113. (b) Sanderson,R. T. J. Chem. Educ. 1988, 65, 227. (c) Sanderson, R. T. Polar CoValence;Academic Press: New York, 1983.(30) Jehng, J. M.; Deo, G.; Weckhuysen, B. M.; Wachs, I. E. J. Mol.Catal. 1996, 110, 41.(31) Barraclough, C. G.; Bradley, D. C.; Lewis, J.; Thomas, I. M. J.Chem. Soc. 1961, 2601.(32) Wright, A. C. Philos. Mag. B 1984, 50, L23.(33) Marumo, F.; Isobe, M.; Iwai, S.; Kondo, Y. Acta Crystallogr. 1974,B30, 1628.(34) Evans, H. T. Z. Kristallogr. 1960, 114, 257.(35) Nabavi, M.; Taulelle, F.; Sanchez, C.; Verdaguer, M. J. Phys. Chem.Solids 1990, 51, 1375.(36) Ng, H. N.; Calvo, C. Can. J. Chem. 1972, 50, 3619.(37) (a) Sam, D. S. H.; Soenen, V.; Volta, J. C. J. Catal. 1990, 123,417. (b) Busca, G. Ricchiardi, G.; Sam, D. S. H.; Volta, J. C. J. Chem.Soc., Faraday Trans. 1994, 90, 1161.(38) Gopal, R.; Calvo, C. Acta Crystallogr. 1974, B30, 2491.(39) Krishnamachari, N.; Calvo, C. Can. J. Chem. 1971, 49, 1629.(40) Khan, G. A.; Hogarth, C. A. J. Mater. Sci. 1991, 26, 412.(41) Fiermans, L.; Vennik, J. Surf. Sci. 1971, 24, 541.(42) Karvaly, B.; Hevesi, I. Z. Naturforsch. Teil A 1971, 26, 245.(43) Klier, K.; Zettlemoyer, A. C. J. Colloid <strong>In</strong>terface Sci. 1977, 58,216.(44) Wong, J.; Lytle, F. W.; Messmer, R. P.; Maylotte, D. H. Phys.ReV. B1984, 30, 5596.(45) Deo, G. Ph.D. Thesis, Lehigh University, 1992.(46) Hazenkamp, M. F.; van Duijneveldt, F. B.; Blasse, G. Chem. Phys.1993, 169, 55.(47) Tran, K.; Hanning-Lee, M. A.; Biswas, A.; Stiegman, A. E.; Scott,G. W. J. Am. Chem. Soc. 1995, 117, 2618.(48) Brinker, C. J.; Brow, R. K.; Tallant, D. R.; Kirkpatrick, R. J. J.Non-Cryst. Solids 1990, 120, 26.(49) Vansant, E. F.; Voort, P. V. D.; Vrancken, K. C. Stud. Surf. Sci.Catal. 1995, 93.(50) Livage, J. Chem. Mater. 1991, 3, 578.(51) Stizza, S.; Mancini, G.; Benfatto, M.; Natoli, C. R.; Garcia, J.;Bianconi, A. Phys. ReV. B1989, 40, 12 229.(52) Charles, N.; Caughlan, N.; Smith, H. M.; Watenpaugh, K. <strong>In</strong>org.Chem. 1966, 12, 2131.