In Situ Spectroscopic Investigation of Molecular Structures of Highly ...
In Situ Spectroscopic Investigation of Molecular Structures of Highly ...
In Situ Spectroscopic Investigation of Molecular Structures of Highly ...

You also want an ePaper? Increase the reach of your titles
YUMPU automatically turns print PDFs into web optimized ePapers that Google loves.
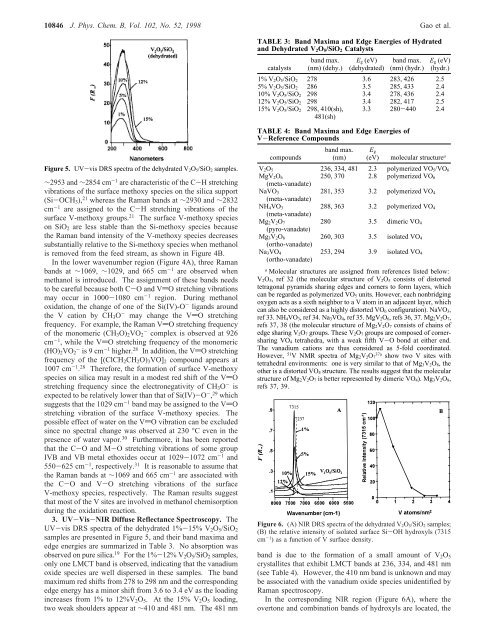
10846 J. Phys. Chem. B, Vol. 102, No. 52, 1998 Gao et al.TABLE 3: Band Maxima and Edge Energies <strong>of</strong> Hydratedand Dehydrated V 2 O 5 /SiO 2 Catalystscatalystsband max.(nm) (dehy.)E g (eV)(dehydrated)band max.(nm) (hydr.)E g (eV)(hydr.)1% V 2O 5/SiO 2 278 3.6 283, 426 2.55% V 2O 5/SiO 2 286 3.5 285, 433 2.410% V 2O 5/SiO 2 298 3.4 278, 436 2.412% V 2O 5/SiO 2 298 3.4 282, 417 2.515% V 2O 5/SiO 2 298, 410(sh),481(sh)3.3 280-440 2.4Figure 5. UV-vis DRS spectra <strong>of</strong> the dehydrated V 2O 5/SiO 2 samples.∼2953 and ∼2854 cm -1 are characteristic <strong>of</strong> the C-H stretchingvibrations <strong>of</strong> the surface methoxy species on the silica support(Si-OCH 3 ), 21 whereas the Raman bands at ∼2930 and ∼2832cm -1 are assigned to the C-H stretching vibrations <strong>of</strong> thesurface V-methoxy groups. 21 The surface V-methoxy specieson SiO 2 are less stable than the Si-methoxy species becausethe Raman band intensity <strong>of</strong> the V-methoxy species decreasessubstantially relative to the Si-methoxy species when methanolis removed from the feed stream, as shown in Figure 4B.<strong>In</strong> the lower wavenumber region (Figure 4A), three Ramanbands at ∼1069, ∼1029, and 665 cm -1 are observed whenmethanol is introduced. The assignment <strong>of</strong> these bands needsto be careful because both C-O and VdO stretching vibrationsmay occur in 1000-1080 cm -1 region. During methanoloxidation, the change <strong>of</strong> one <strong>of</strong> the Si(IV)-O - ligands aroundthe V cation by CH 3 O - may change the VdO stretchingfrequency. For example, the Raman VdO stretching frequency<strong>of</strong> the monomeric (CH 3 O) 2 VO 2- complex is observed at 926cm -1 , while the VdO stretching frequency <strong>of</strong> the monomeric(HO) 2 VO - 2 is9cm -1 higher. 28 <strong>In</strong> addition, the VdO stretchingfrequency <strong>of</strong> the [(ClCH 2 CH 2 O) 3 VO] 2 compound appears at1007 cm -1 . 28 Therefore, the formation <strong>of</strong> surface V-methoxyspecies on silica may result in a modest red shift <strong>of</strong> the VdOstretching frequency since the electronegativity <strong>of</strong> CH 3 O - isexpected to be relatively lower than that <strong>of</strong> Si(IV)-O - , 29 whichsuggests that the 1029 cm -1 band may be assigned to the VdOstretching vibration <strong>of</strong> the surface V-methoxy species. Thepossible effect <strong>of</strong> water on the VdO vibration can be excludedsince no spectral change was observed at 230 °C even in thepresence <strong>of</strong> water vapor. 30 Furthermore, it has been reportedthat the C-O and M-O stretching vibrations <strong>of</strong> some groupIVB and VB metal ethoxides occur at 1029-1072 cm -1 and550-625 cm -1 , respectively. 31 It is reasonable to assume thatthe Raman bands at ∼1069 and 665 cm -1 are associated withthe C-O and V-O stretching vibrations <strong>of</strong> the surfaceV-methoxy species, respectively. The Raman results suggestthat most <strong>of</strong> the V sites are involved in methanol chemisorptionduring the oxidation reaction.3. UV-Vis-NIR Diffuse Reflectance Spectroscopy. TheUV-vis DRS spectra <strong>of</strong> the dehydrated 1%-15% V 2 O 5 /SiO 2samples are presented in Figure 5, and their band maxima andedge energies are summarized in Table 3. No absorption wasobserved on pure silica. 19 For the 1%-12% V 2 O 5 /SiO 2 samples,only one LMCT band is observed, indicating that the vanadiumoxide species are well dispersed in these samples. The bandmaximum red shifts from 278 to 298 nm and the correspondingedge energy has a minor shift from 3.6 to 3.4 eV as the loadingincreases from 1% to 12%V 2 O 5 . At the 15% V 2 O 5 loading,two weak shoulders appear at ∼410 and 481 nm. The 481 nmTABLE 4: Band Maxima and Edge Energies <strong>of</strong>V-Reference Compoundscompoundsband max.(nm)E g(eV)molecular structure aV 2O 5 236, 334, 481 2.3 polymerized VO 5/VO 6MgV 2O 6250, 370 2.8 polymerized VO 6(meta-vanadate)NaVO 3281, 353 3.2 polymerized VO 4(meta-vanadate)NH 4VO 3288, 363 3.2 polymerized VO 4(meta-vanadate)Mg 2V 2O 7280 3.5 dimeric VO 4(pyro-vanadate)Mg 3V 2O 8260, 303 3.5 isolated VO 4(ortho-vanadate)Na 3VO 4(ortho-vanadate)253, 294 3.9 isolated VO 4a<strong>Molecular</strong> structures are assigned from references listed below:V 2O 5, ref 32 (the molecular structure <strong>of</strong> V 2O 5 consists <strong>of</strong> distortedtetragonal pyramids sharing edges and corners to form layers, whichcan be regarded as polymerized VO 5 units. However, each nonbridgingoxygen acts as a sixth neighbor to a V atom in an adjacent layer, whichcan also be considered as a highly distorted VO 6 configuration). NaVO 3,ref 33. NH 4VO 3, ref 34. Na 3VO 4, ref 35. MgV 2O 6, refs 36, 37. Mg 2V 2O 7,refs 37, 38 (the molecular structure <strong>of</strong> Mg 2V 2O 7 consists <strong>of</strong> chains <strong>of</strong>edge sharing V 2O 7 groups. These V 2O 7 groups are composed <strong>of</strong> cornersharingVO 4 tetrahedra, with a weak fifth V-O bond at either end.The vanadium cations are thus considered as 5-fold coordinated.However, 51 V NMR spectra <strong>of</strong> Mg 2V 2O 737ashow two V sites withtetrahedral environments: one is very similar to that <strong>of</strong> Mg 3V 2O 8, theother is a distorted VO 4 structure. The results suggest that the molecularstructure <strong>of</strong> Mg 2V 2O 7 is better represented by dimeric VO 4). Mg 3V 2O 8,refs 37, 39.Figure 6. (A) NIR DRS spectra <strong>of</strong> the dehydrated V 2O 5/SiO 2 samples;(B) the relative intensity <strong>of</strong> isolated surface Si-OH hydroxyls (7315cm -1 ) as a function <strong>of</strong> V surface density.band is due to the formation <strong>of</strong> a small amount <strong>of</strong> V 2 O 5crystallites that exhibit LMCT bands at 236, 334, and 481 nm(see Table 4). However, the 410 nm band is unknown and maybe associated with the vanadium oxide species unidentified byRaman spectroscopy.<strong>In</strong> the corresponding NIR region (Figure 6A), where theovertone and combination bands <strong>of</strong> hydroxyls are located, the