In Situ Spectroscopic Investigation of Molecular Structures of Highly ...
In Situ Spectroscopic Investigation of Molecular Structures of Highly ...
In Situ Spectroscopic Investigation of Molecular Structures of Highly ...

You also want an ePaper? Increase the reach of your titles
YUMPU automatically turns print PDFs into web optimized ePapers that Google loves.
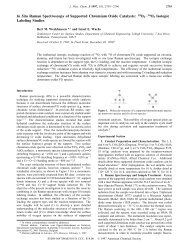
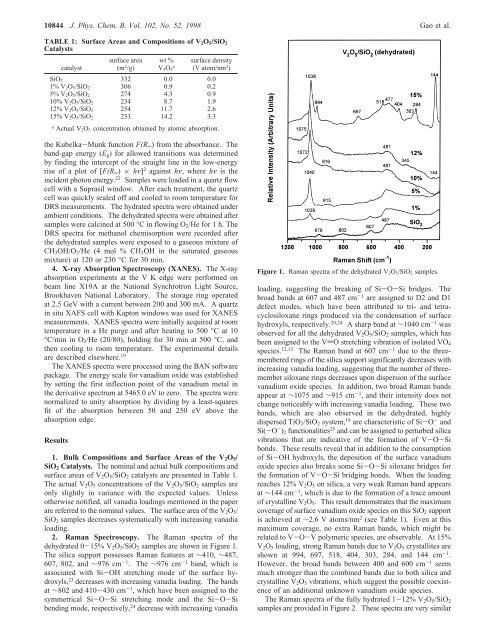
10844 J. Phys. Chem. B, Vol. 102, No. 52, 1998 Gao et al.TABLE 1: Surface Areas and Compositions <strong>of</strong> V 2 O 5 /SiO 2Catalystscatalystsurface area(m 2 /g)wt %V 2O 5asurface density(V atom/nm 2 )SiO 2 332 0.0 0.01% V 2O 5/SiO 2 306 0.9 0.25% V 2O 5/SiO 2 274 4.3 0.910% V 2O 5/SiO 2 234 8.7 1.912% V 2O 5/SiO 2 254 11.7 2.615% V 2O 5/SiO 2 233 14.2 3.3aActual V 2O 5 concentration obtained by atomic absorption.the Kubelka-Munk function F(R ∞ ) from the absorbance. Theband-gap energy (E g ) for allowed transitions was determinedby finding the intercept <strong>of</strong> the straight line in the low-energyrise <strong>of</strong> a plot <strong>of</strong> [F(R ∞ ) × hν] 2 against hν, where hν is theincident photon energy. 22 Samples were loaded in a quartz flowcell with a Suprasil window. After each treatment, the quartzcell was quickly sealed <strong>of</strong>f and cooled to room temperature forDRS measurements. The hydrated spectra were obtained underambient conditions. The dehydrated spectra were obtained aftersamples were calcined at 500 °C in flowing O 2 /He for 1 h. TheDRS spectra for methanol chemisorption were recorded afterthe dehydrated samples were exposed to a gaseous mixture <strong>of</strong>CH 3 OH/O 2 /He (4 mol % CH 3 OH in the saturated gaseousmixture) at 120 or 230 °C for 30 min.4. X-ray Absorption Spectroscopy (XANES). The X-rayabsorption experiments at the V K edge were performed onbeam line X19A at the National Synchrotron Light Source,Brookhaven National Laboratory. The storage ring operatedat 2.5 GeV with a current between 200 and 300 mA. A quartzin situ XAFS cell with Kapton windows was used for XANESmeasurements. XANES spectra were initially acquired at roomtemperature in a He purge and after heating to 500 °C at10°C/min in O 2 /He (20/80), holding for 30 min at 500 °C, andthen cooling to room temperature. The experimental detailsare described elsewhere. 19The XANES spectra were processed using the BAN s<strong>of</strong>twarepackage. The energy scale for vanadium oxide was establishedby setting the first inflection point <strong>of</strong> the vanadium metal inthe derivative spectrum at 5465.0 eV to zero. The spectra werenormalized to unity absorption by dividing by a least-squaresfit <strong>of</strong> the absorption between 50 and 250 eV above theabsorption edge.Results1. Bulk Compositions and Surface Areas <strong>of</strong> the V 2 O 5 /SiO 2 Catalysts. The nominal and actual bulk compositions andsurface areas <strong>of</strong> V 2 O 5 /SiO 2 catalysts are presented in Table 1.The actual V 2 O 5 concentrations <strong>of</strong> the V 2 O 5 /SiO 2 samples areonly slightly in variance with the expected values. Unlessotherwise notified, all vanadia loadings mentioned in the paperare referred to the nominal values. The surface area <strong>of</strong> the V 2 O 5 /SiO 2 samples decreases systematically with increasing vanadialoading.2. Raman Spectroscopy. The Raman spectra <strong>of</strong> thedehydrated 0-15% V 2 O 5 /SiO 2 samples are shown in Figure 1.The silica support possesses Raman features at ∼410, ∼487,607, 802, and ∼976 cm -1 . The ∼976 cm -1 band, which isassociated with Si-OH stretching mode <strong>of</strong> the surface hydroxyls,23 decreases with increasing vanadia loading. The bandsat ∼802 and 410-430 cm -1 , which have been assigned to thesymmetrical Si-O-Si stretching mode and the Si-O-Sibending mode, respectively, 24 decrease with increasing vanadiaFigure 1. Raman spectra <strong>of</strong> the dehydrated V 2O 5/SiO 2 samples.loading, suggesting the breaking <strong>of</strong> Si-O-Si bridges. Thebroad bands at 607 and 487 cm -1 are assigned to D2 and D1defect modes, which have been attributed to tri- and tetracyclosiloxanerings produced via the condensation <strong>of</strong> surfacehydroxyls, respectively. 20,24 A sharp band at ∼1040 cm -1 wasobserved for all the dehydrated V 2 O 5 /SiO 2 samples, which hasbeen assigned to the VdO stretching vibration <strong>of</strong> isolated VO 4species. 12,13 The Raman band at 607 cm -1 due to the threememberedrings <strong>of</strong> the silica support significantly decreases withincreasing vanadia loading, suggesting that the number <strong>of</strong> threemembersiloxane rings decreases upon dispersion <strong>of</strong> the surfacevanadium oxide species. <strong>In</strong> addition, two broad Raman bandsappear at ∼1075 and ∼915 cm -1 , and their intensity does notchange noticeably with increasing vanadia loading. These twobands, which are also observed in the dehydrated, highlydispersed TiO 2 /SiO 2 system, 19 are characteristic <strong>of</strong> Si-O - andSi(-O - ) 2 functionalities 25 and can be assigned to perturbed silicavibrations that are indicative <strong>of</strong> the formation <strong>of</strong> V-O-Sibonds. These results reveal that in addition to the consumption<strong>of</strong> Si-OH hydroxyls, the deposition <strong>of</strong> the surface vanadiumoxide species also breaks some Si-O-Si siloxane bridges forthe formation <strong>of</strong> V-O-Si bridging bonds. When the loadingreaches 12% V 2 O 5 on silica, a very weak Raman band appearsat ∼144 cm -1 , which is due to the formation <strong>of</strong> a trace amount<strong>of</strong> crystalline V 2 O 5 . This result demonstrates that the maximumcoverage <strong>of</strong> surface vanadium oxide species on this SiO 2 supportis achieved at ∼2.6 V atoms/nm 2 (see Table 1). Even at thismaximum coverage, no extra Raman bands, which might berelated to V-O-V polymeric species, are observable. At 15%V 2 O 5 loading, strong Raman bands due to V 2 O 5 crystallites areshown at 994, 697, 518, 404, 303, 284, and 144 cm -1 .However, the broad bands between 400 and 600 cm -1 seemmuch stronger than the combined bands due to both silica andcrystalline V 2 O 5 vibrations, which suggest the possible coexistence<strong>of</strong> an additional unknown vanadium oxide species.The Raman spectra <strong>of</strong> the fully hydrated 1-12% V 2 O 5 /SiO 2samples are provided in Figure 2. These spectra are very similar