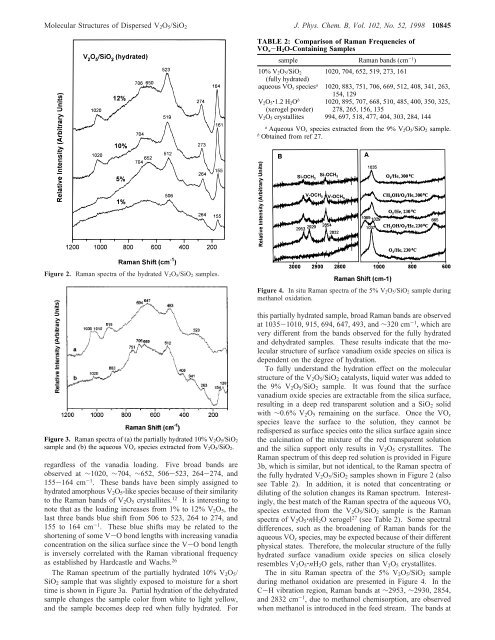
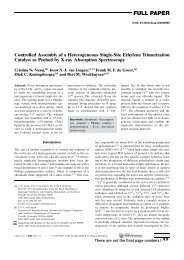
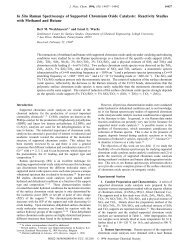
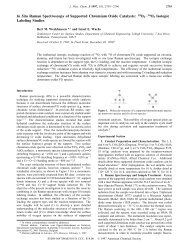
<strong>Molecular</strong> <strong>Structures</strong> <strong>of</strong> Dispersed V 2 O 5 /SiO 2 J. Phys. Chem. B, Vol. 102, No. 52, 1998 10845TABLE 2: Comparison <strong>of</strong> Raman Frequencies <strong>of</strong>VO x -H 2 O-Containing Samplessample Raman bands (cm -1 )10% V 2O 5/SiO 2 1020, 704, 652, 519, 273, 161(fully hydrated)aqueous VO x species a 1020, 883, 751, 706, 669, 512, 408, 341, 263,154, 129V 2O 5‚1.2 H 2O b 1020, 895, 707, 668, 510, 485, 400, 350, 325,(xerogel powder) 278, 265, 156, 135V 2O 5 crystallites 994, 697, 518, 477, 404, 303, 284, 144aAqueous VO x species extracted from the 9% V 2O 5/SiO 2 sample.bObtained from ref 27.Figure 2. Raman spectra <strong>of</strong> the hydrated V 2O 5/SiO 2 samples.Figure 4. <strong>In</strong> situ Raman spectra <strong>of</strong> the 5% V 2O 5/SiO 2 sample duringmethanol oxidation.Figure 3. Raman spectra <strong>of</strong> (a) the partially hydrated 10% V 2O 5/SiO 2sample and (b) the aqueous VO x species extracted from V 2O 5/SiO 2.regardless <strong>of</strong> the vanadia loading. Five broad bands areobserved at ∼1020, ∼704, ∼652, 506-523, 264-274, and155-164 cm -1 . These bands have been simply assigned tohydrated amorphous V 2 O 5 -like species because <strong>of</strong> their similarityto the Raman bands <strong>of</strong> V 2 O 5 crystallites. 12 It is interesting tonote that as the loading increases from 1% to 12% V 2 O 5 , thelast three bands blue shift from 506 to 523, 264 to 274, and155 to 164 cm -1 . These blue shifts may be related to theshortening <strong>of</strong> some V-O bond lengths with increasing vanadiaconcentration on the silica surface since the V-O bond lengthis inversely correlated with the Raman vibrational frequencyas established by Hardcastle and Wachs. 26The Raman spectrum <strong>of</strong> the partially hydrated 10% V 2 O 5 /SiO 2 sample that was slightly exposed to moisture for a shorttime is shown in Figure 3a. Partial hydration <strong>of</strong> the dehydratedsample changes the sample color from white to light yellow,and the sample becomes deep red when fully hydrated. Forthis partially hydrated sample, broad Raman bands are observedat 1035-1010, 915, 694, 647, 493, and ∼320 cm -1 , which arevery different from the bands observed for the fully hydratedand dehydrated samples. These results indicate that the molecularstructure <strong>of</strong> surface vanadium oxide species on silica isdependent on the degree <strong>of</strong> hydration.To fully understand the hydration effect on the molecularstructure <strong>of</strong> the V 2 O 5 /SiO 2 catalysts, liquid water was added tothe 9% V 2 O 5 /SiO 2 sample. It was found that the surfacevanadium oxide species are extractable from the silica surface,resulting in a deep red transparent solution and a SiO 2 solidwith ∼0.6% V 2 O 5 remaining on the surface. Once the VO xspecies leave the surface to the solution, they cannot beredispersed as surface species onto the silica surface again sincethe calcination <strong>of</strong> the mixture <strong>of</strong> the red transparent solutionand the silica support only results in V 2 O 5 crystallites. TheRaman spectrum <strong>of</strong> this deep red solution is provided in Figure3b, which is similar, but not identical, to the Raman spectra <strong>of</strong>the fully hydrated V 2 O 5 /SiO 2 samples shown in Figure 2 (alsosee Table 2). <strong>In</strong> addition, it is noted that concentrating ordiluting <strong>of</strong> the solution changes its Raman spectrum. <strong>In</strong>terestingly,the best match <strong>of</strong> the Raman spectra <strong>of</strong> the aqueous VO xspecies extracted from the V 2 O 5 /SiO 2 sample is the Ramanspectra <strong>of</strong> V 2 O 5 ‚nH 2 O xerogel 27 (see Table 2). Some spectraldifferences, such as the broadening <strong>of</strong> Raman bands for theaqueous VO x species, may be expected because <strong>of</strong> their differentphysical states. Therefore, the molecular structure <strong>of</strong> the fullyhydrated surface vanadium oxide species on silica closelyresembles V 2 O 5 ‚nH 2 O gels, rather than V 2 O 5 crystallites.The in situ Raman spectra <strong>of</strong> the 5% V 2 O 5 /SiO 2 sampleduring methanol oxidation are presented in Figure 4. <strong>In</strong> theC-H vibration region, Raman bands at ∼2953, ∼2930, 2854,and 2832 cm -1 , due to methanol chemisorption, are observedwhen methanol is introduced in the feed stream. The bands at
10846 J. Phys. Chem. B, Vol. 102, No. 52, 1998 Gao et al.TABLE 3: Band Maxima and Edge Energies <strong>of</strong> Hydratedand Dehydrated V 2 O 5 /SiO 2 Catalystscatalystsband max.(nm) (dehy.)E g (eV)(dehydrated)band max.(nm) (hydr.)E g (eV)(hydr.)1% V 2O 5/SiO 2 278 3.6 283, 426 2.55% V 2O 5/SiO 2 286 3.5 285, 433 2.410% V 2O 5/SiO 2 298 3.4 278, 436 2.412% V 2O 5/SiO 2 298 3.4 282, 417 2.515% V 2O 5/SiO 2 298, 410(sh),481(sh)3.3 280-440 2.4Figure 5. UV-vis DRS spectra <strong>of</strong> the dehydrated V 2O 5/SiO 2 samples.∼2953 and ∼2854 cm -1 are characteristic <strong>of</strong> the C-H stretchingvibrations <strong>of</strong> the surface methoxy species on the silica support(Si-OCH 3 ), 21 whereas the Raman bands at ∼2930 and ∼2832cm -1 are assigned to the C-H stretching vibrations <strong>of</strong> thesurface V-methoxy groups. 21 The surface V-methoxy specieson SiO 2 are less stable than the Si-methoxy species becausethe Raman band intensity <strong>of</strong> the V-methoxy species decreasessubstantially relative to the Si-methoxy species when methanolis removed from the feed stream, as shown in Figure 4B.<strong>In</strong> the lower wavenumber region (Figure 4A), three Ramanbands at ∼1069, ∼1029, and 665 cm -1 are observed whenmethanol is introduced. The assignment <strong>of</strong> these bands needsto be careful because both C-O and VdO stretching vibrationsmay occur in 1000-1080 cm -1 region. During methanoloxidation, the change <strong>of</strong> one <strong>of</strong> the Si(IV)-O - ligands aroundthe V cation by CH 3 O - may change the VdO stretchingfrequency. For example, the Raman VdO stretching frequency<strong>of</strong> the monomeric (CH 3 O) 2 VO 2- complex is observed at 926cm -1 , while the VdO stretching frequency <strong>of</strong> the monomeric(HO) 2 VO - 2 is9cm -1 higher. 28 <strong>In</strong> addition, the VdO stretchingfrequency <strong>of</strong> the [(ClCH 2 CH 2 O) 3 VO] 2 compound appears at1007 cm -1 . 28 Therefore, the formation <strong>of</strong> surface V-methoxyspecies on silica may result in a modest red shift <strong>of</strong> the VdOstretching frequency since the electronegativity <strong>of</strong> CH 3 O - isexpected to be relatively lower than that <strong>of</strong> Si(IV)-O - , 29 whichsuggests that the 1029 cm -1 band may be assigned to the VdOstretching vibration <strong>of</strong> the surface V-methoxy species. Thepossible effect <strong>of</strong> water on the VdO vibration can be excludedsince no spectral change was observed at 230 °C even in thepresence <strong>of</strong> water vapor. 30 Furthermore, it has been reportedthat the C-O and M-O stretching vibrations <strong>of</strong> some groupIVB and VB metal ethoxides occur at 1029-1072 cm -1 and550-625 cm -1 , respectively. 31 It is reasonable to assume thatthe Raman bands at ∼1069 and 665 cm -1 are associated withthe C-O and V-O stretching vibrations <strong>of</strong> the surfaceV-methoxy species, respectively. The Raman results suggestthat most <strong>of</strong> the V sites are involved in methanol chemisorptionduring the oxidation reaction.3. UV-Vis-NIR Diffuse Reflectance Spectroscopy. TheUV-vis DRS spectra <strong>of</strong> the dehydrated 1%-15% V 2 O 5 /SiO 2samples are presented in Figure 5, and their band maxima andedge energies are summarized in Table 3. No absorption wasobserved on pure silica. 19 For the 1%-12% V 2 O 5 /SiO 2 samples,only one LMCT band is observed, indicating that the vanadiumoxide species are well dispersed in these samples. The bandmaximum red shifts from 278 to 298 nm and the correspondingedge energy has a minor shift from 3.6 to 3.4 eV as the loadingincreases from 1% to 12%V 2 O 5 . At the 15% V 2 O 5 loading,two weak shoulders appear at ∼410 and 481 nm. The 481 nmTABLE 4: Band Maxima and Edge Energies <strong>of</strong>V-Reference Compoundscompoundsband max.(nm)E g(eV)molecular structure aV 2O 5 236, 334, 481 2.3 polymerized VO 5/VO 6MgV 2O 6250, 370 2.8 polymerized VO 6(meta-vanadate)NaVO 3281, 353 3.2 polymerized VO 4(meta-vanadate)NH 4VO 3288, 363 3.2 polymerized VO 4(meta-vanadate)Mg 2V 2O 7280 3.5 dimeric VO 4(pyro-vanadate)Mg 3V 2O 8260, 303 3.5 isolated VO 4(ortho-vanadate)Na 3VO 4(ortho-vanadate)253, 294 3.9 isolated VO 4a<strong>Molecular</strong> structures are assigned from references listed below:V 2O 5, ref 32 (the molecular structure <strong>of</strong> V 2O 5 consists <strong>of</strong> distortedtetragonal pyramids sharing edges and corners to form layers, whichcan be regarded as polymerized VO 5 units. However, each nonbridgingoxygen acts as a sixth neighbor to a V atom in an adjacent layer, whichcan also be considered as a highly distorted VO 6 configuration). NaVO 3,ref 33. NH 4VO 3, ref 34. Na 3VO 4, ref 35. MgV 2O 6, refs 36, 37. Mg 2V 2O 7,refs 37, 38 (the molecular structure <strong>of</strong> Mg 2V 2O 7 consists <strong>of</strong> chains <strong>of</strong>edge sharing V 2O 7 groups. These V 2O 7 groups are composed <strong>of</strong> cornersharingVO 4 tetrahedra, with a weak fifth V-O bond at either end.The vanadium cations are thus considered as 5-fold coordinated.However, 51 V NMR spectra <strong>of</strong> Mg 2V 2O 737ashow two V sites withtetrahedral environments: one is very similar to that <strong>of</strong> Mg 3V 2O 8, theother is a distorted VO 4 structure. The results suggest that the molecularstructure <strong>of</strong> Mg 2V 2O 7 is better represented by dimeric VO 4). Mg 3V 2O 8,refs 37, 39.Figure 6. (A) NIR DRS spectra <strong>of</strong> the dehydrated V 2O 5/SiO 2 samples;(B) the relative intensity <strong>of</strong> isolated surface Si-OH hydroxyls (7315cm -1 ) as a function <strong>of</strong> V surface density.band is due to the formation <strong>of</strong> a small amount <strong>of</strong> V 2 O 5crystallites that exhibit LMCT bands at 236, 334, and 481 nm(see Table 4). However, the 410 nm band is unknown and maybe associated with the vanadium oxide species unidentified byRaman spectroscopy.<strong>In</strong> the corresponding NIR region (Figure 6A), where theovertone and combination bands <strong>of</strong> hydroxyls are located, the