In Situ Spectroscopic Investigation of Molecular Structures of Highly ...
In Situ Spectroscopic Investigation of Molecular Structures of Highly ...
In Situ Spectroscopic Investigation of Molecular Structures of Highly ...

Create successful ePaper yourself
Turn your PDF publications into a flip-book with our unique Google optimized e-Paper software.
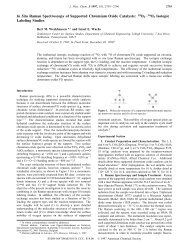
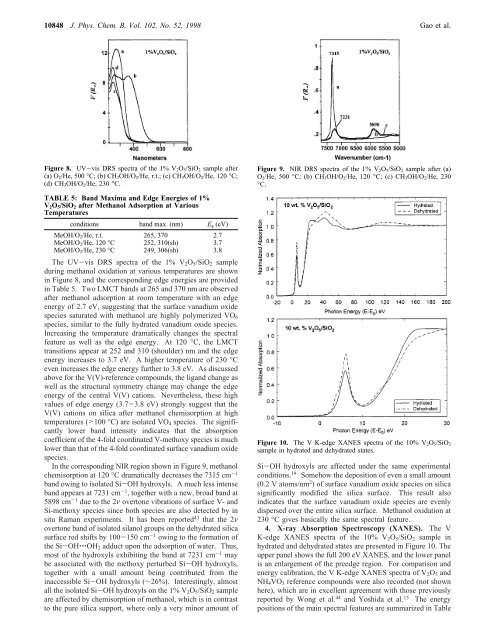
10848 J. Phys. Chem. B, Vol. 102, No. 52, 1998 Gao et al.Figure 8. UV-vis DRS spectra <strong>of</strong> the 1% V 2O 5/SiO 2 sample after(a) O 2/He, 500 °C; (b) CH 3OH/O 2/He, r.t.; (c) CH 3OH/O 2/He, 120 °C;(d) CH 3OH/O 2/He, 230 °C.TABLE 5: Band Maxima and Edge Energies <strong>of</strong> 1%V 2 O 5 /SiO 2 after Methanol Adsorption at VariousTemperaturesconditions band max. (nm) E g (eV)MeOH/O 2/He, r.t. 265, 370 2.7MeOH/O 2/He, 120 °C 252, 310(sh) 3.7MeOH/O 2/He, 230 °C 249, 306(sh) 3.8The UV-vis DRS spectra <strong>of</strong> the 1% V 2 O 5 /SiO 2 sampleduring methanol oxidation at various temperatures are shownin Figure 8, and the corresponding edge energies are providedin Table 5. Two LMCT bands at 265 and 370 nm are observedafter methanol adsorption at room temperature with an edgeenergy <strong>of</strong> 2.7 eV, suggesting that the surface vanadium oxidespecies saturated with methanol are highly polymerized VO 6species, similar to the fully hydrated vanadium oxide species.<strong>In</strong>creasing the temperature dramatically changes the spectralfeature as well as the edge energy. At 120 °C, the LMCTtransitions appear at 252 and 310 (shoulder) nm and the edgeenergy increases to 3.7 eV. A higher temperature <strong>of</strong> 230 °Ceven increases the edge energy further to 3.8 eV. As discussedabove for the V(V)-reference compounds, the ligand change aswell as the structural symmetry change may change the edgeenergy <strong>of</strong> the central V(V) cations. Nevertheless, these highvalues <strong>of</strong> edge energy (3.7-3.8 eV) strongly suggest that theV(V) cations on silica after methanol chemisorption at hightemperatures (>100 °C) are isolated VO 4 species. The significantlylower band intensity indicates that the absorptioncoefficient <strong>of</strong> the 4-fold coordinated V-methoxy species is muchlower than that <strong>of</strong> the 4-fold coordinated surface vanadium oxidespecies.<strong>In</strong> the corresponding NIR region shown in Figure 9, methanolchemisorption at 120 °C dramatically decreases the 7315 cm -1band owing to isolated Si-OH hydroxyls. A much less intenseband appears at 7231 cm -1 , together with a new, broad band at5898 cm -1 due to the 2ν overtone vibrations <strong>of</strong> surface V- andSi-methoxy species since both species are also detected by insitu Raman experiments. It has been reported 43 that the 2νovertone band <strong>of</strong> isolated silanol groups on the dehydrated silicasurface red shifts by 100-150 cm -1 owing to the formation <strong>of</strong>the Si-OH‚‚‚OH 2 adduct upon the adsorption <strong>of</strong> water. Thus,most <strong>of</strong> the hydroxyls exhibiting the band at 7231 cm -1 maybe associated with the methoxy perturbed Si-OH hydroxyls,together with a small amount being contributed from theinaccessible Si-OH hydroxyls (∼26%). <strong>In</strong>terestingly, almostall the isolated Si-OH hydroxyls on the 1% V 2 O 5 /SiO 2 sampleare affected by chemisorption <strong>of</strong> methanol, which is in contrastto the pure silica support, where only a very minor amount <strong>of</strong>Figure 9. NIR DRS spectra <strong>of</strong> the 1% V 2O 5/SiO 2 sample after (a)O 2/He, 500 °C; (b) CH 3OH/O 2/He, 120 °C; (c) CH 3OH/O 2/He, 230°C.Figure 10. The V K-edge XANES spectra <strong>of</strong> the 10% V 2O 5/SiO 2sample in hydrated and dehydrated states.Si-OH hydroxyls are affected under the same experimentalconditions. 19 Somehow the deposition <strong>of</strong> even a small amount(0.2 V atoms/nm 2 ) <strong>of</strong> surface vanadium oxide species on silicasignificantly modified the silica surface. This result alsoindicates that the surface vanadium oxide species are evenlydispersed over the entire silica surface. Methanol oxidation at230 °C gives basically the same spectral feature.4. X-ray Absorption Spectroscopy (XANES). The VK-edge XANES spectra <strong>of</strong> the 10% V 2 O 5 /SiO 2 sample inhydrated and dehydrated states are presented in Figure 10. Theupper panel shows the full 200 eV XANES, and the lower panelis an enlargement <strong>of</strong> the preedge region. For comparison andenergy calibration, the V K-edge XANES spectra <strong>of</strong> V 2 O 5 andNH 4 VO 3 reference compounds were also recorded (not shownhere), which are in excellent agreement with those previouslyreported by Wong et al. 44 and Yoshida et al. 15 The energypositions <strong>of</strong> the main spectral features are summarized in Table