posudzovanie vplyvu automobilovej dopravy na - Žilinská univerzita
posudzovanie vplyvu automobilovej dopravy na - Žilinská univerzita
posudzovanie vplyvu automobilovej dopravy na - Žilinská univerzita

Create successful ePaper yourself
Turn your PDF publications into a flip-book with our unique Google optimized e-Paper software.
C O M M U N I C A T II O N SS<br />
5<br />
Daniela Ďurčanská – Milan Moravčík<br />
POSUDZOVANIE VPLYVU AUTOMOBILOVEJ<br />
DOPRAVY NA ZNEČISTENIE OVZDUŠIA<br />
ASSESMENT OF THE IMPACT OF ROAD<br />
TRAFFIC ON AIR POLLUTION<br />
16<br />
Vladimír Hlavňa – Rastislav Isteník<br />
NIEKTORÉ PROBLÉMY KONŠTRUKCIE<br />
A PREVÁDZKY AUTOMOBILU VO VZŤAHU<br />
K ŽIVOTNÉMU PROSTREDIU<br />
POSSIBILITIES OF SOLUTION OF AN<br />
AUTOMOBILE DESIGNING AND OPERATION<br />
IN RELATION TO THE ENVIRONMENT<br />
26<br />
Zygmunt Szlachta – Jerzy Cisek<br />
DODATOČNÉ VSTREKOVANIE PALIVA<br />
DO VALCA VZNETOVÉHO MOTORA AKO<br />
METÓDA ZNIŽOVANIA NO x<br />
THE DIESEL FUEL POST-INJECTION INTO<br />
ENGINE CYLINDER AS METHOD OF NO x<br />
REDUCTION<br />
36<br />
Oldřich Polách<br />
O KONŠTRUKCII POJAZDOV S RADIÁLNE<br />
NATÁČANÝMI DVOJKOLESIAMI<br />
ON THE DESIGN OF RUNNING GEARS WITH<br />
RADIAL STEERING WHEEL SETS<br />
43<br />
Juraj Gerlici – Tomáš Lack<br />
ANALÝZA GEOMETRIE ŽELEZNIČNEJ<br />
KOĽAJE (Z POHĽADU JEJ OPOTREBENIA<br />
V PREVÁDZKE)<br />
RAIL GEOMETRY ANALYSIS (FROM THE<br />
POINT OF VIEW OF WEARING IN THE<br />
OPERATION)<br />
52<br />
Jozef G<strong>na</strong>p – Vladimír Konečný<br />
DOPRAVNÁ POLITIKA VO VZŤAHU<br />
K CESTNEJ DOPRAVE A TRVALO<br />
UDRŽATEĽNÝ ROZVOJ<br />
TRANSPORT POLICY RELATED TO ROAD<br />
TRANSPORT AND SUSTAINABLE<br />
DEVELOPMENT<br />
62<br />
Peter Patek – Jaroslav Borský – Ivan Kotvan<br />
PLAVIDLO PRE KOMPLEXNÉ ZÁSOBOVANIE<br />
A ZBER ODPADOV LODÍ NA DUNAJI<br />
A VESSEL FOR THE COMPLEX SUPPLYING<br />
AND WASTES COLLECTION OF INLAND<br />
SHIPS ON THE DANUBE<br />
70<br />
Blahoslav Harman – Viktor Ferencey<br />
VYUŽITIE PSEUDO-STOCHASTICKÉHO<br />
MODELU TERÉNU PRE SIMULÁCIU VIBRÁCIÍ<br />
A OTRASOV CESTNÝCH DOPRAVNÝCH<br />
PROSTRIEDKOV<br />
UTILIZATION OF A PSEUDO-STOCHASTIC<br />
MODEL OF TERRAIN IN SIMULATION<br />
OF VIBRATIONS AND SNUBBING IN ROAD<br />
MEANS OF TRANSPORT<br />
76<br />
Roman Marcinkowski<br />
POSUDZOVANIE KVALITY ČASOVÝCH<br />
PLÁNOV STAVIEB<br />
QUALITY ASSESSMENT OF CONSTRUCTION<br />
SCHEDULES
C O M M U N I C A T I O N S<br />
I S<br />
Vážení čitatelia,<br />
stalo sa už dobrým zvykom, že s určitou periodicitou sa jedno číslo Komunikácií venuje doprave a dopravným<br />
prostriedkom vo vzťahu k životnému prostrediu. Tento fenomén je v centre pozornosti záujmov Žilinskej univerzity,<br />
ktorá to dáva <strong>na</strong>javo aj tým, že prvé číslo Komunikácií v jubilejnom roku svojej päťdesiatročnej histórie venuje práve<br />
tejto téme.<br />
Skupi<strong>na</strong> Európskeho spoločenstva „Doprava 2000 plus” konštatovala v správe „Doprava v rýchle sa meniacej<br />
Európe”, že sektor <strong>dopravy</strong> je jeden z hlavných činiteľov problémov energetických a problémov životného prostredia,<br />
pretože patrí k <strong>na</strong>jväčším spotrebiteľom fosílnych energetických zdrojov a je zodpovedný za podstatné ovplyvňovanie<br />
a zaťažovanie životného prostredia.<br />
Otázky hodnôt životného štýlu, spôsobu života a hospodárenia určujú ďalší vývoj <strong>dopravy</strong>. Dopravná politika musí<br />
preto zohľadňovať globálne a regionálne podmienky. Perspektívu majú tie stratégie, ktoré uvažujú so zmenou dopravných<br />
systémov a s obmedzením neefektívnej <strong>dopravy</strong>. Škodlivé účinky <strong>dopravy</strong> <strong>na</strong> životné prostredie musia byť obmedzované<br />
presadzovaním rýchlejších, bezpečnejších a pohodlnejších dopravných prostriedkov verejnej <strong>dopravy</strong>, ako aj obmedzovaním<br />
individuálnej <strong>dopravy</strong> hlavne vo veľkých mestách.<br />
Prudký vývoj takmer všetkých hospodárskych odvetví okamžite ovplyvňuje oblasť <strong>dopravy</strong>. Automobilový priemysel<br />
produkuje vozidlá vybavené novými technológiami a prevádzkovatelia <strong>dopravy</strong> túto oblasť fi<strong>na</strong>ncujú prostredníctvom<br />
nákupu nových dopravných prostriedkov. V súčasnej „modernej priemyselnej spoločnosti” sa cíti podstatná časť obyvateľstva<br />
obťažovaná <strong>na</strong>jmä emisiou hluku a výfukových plynov. Aj preto si riešenie problému rastúcej hustoty <strong>dopravy</strong><br />
vyžaduje výstavbu nových rýchlostných ciest a obchvatov miest. Ak produkcia emisií v ustálených stavoch prevádzky<br />
vozidla je viac-menej úspešne riešená, tak neustálené režimy prevádzky spôsobujú podstatne väčšie zaťaženie životného<br />
prostredia. O simulácii neustálených režimov prevádzky vozidiel sa možno dozvedieť z príspevku pracovníkov SjF<br />
Žilinskej univerzity. Dodatočné vstrekovanie paliva do valca vznetového motora je jednou z metód znižovania produkcie<br />
NO x . O výsledkoch použitia tejto metódy sa píše v príspevku prof. Szlachta.<br />
Zníženie hlučnosti koľajových vozidiel môže byť dosiahnuté vhodnou konštrukciou ich podvozkov a pojazdov.<br />
Dvojkolesia <strong>na</strong>táčané do radiálnej polohy zamedzujú pískanie v oblúkoch koľaje. A<strong>na</strong>lýza geometrie železničnej koľaje<br />
z pohľadu jej opotrebenia v prevádzke je otázkou súčasnej prevádzky koľajových vozidiel. Dôsledky negatívneho pôsobenia<br />
sa odrážajú aj <strong>na</strong> stave životného prostredia.<br />
Ďalším nepríjemným fenoménom prevádzky dopravných prostriedkov sú vibrácie a otrasy. Na riešenie tohto problému<br />
je možné využiť aj pseudostochastický model terénu, o ktorom sa píše v príspevku pánov Harma<strong>na</strong> a Ferenceya.<br />
Bezpečné a spoľahlivé zásobovanie palivami a zber odpadov je dôležité pre nepretržitú plavbu a ochranu životného<br />
prostredia. Na tieto účely bolo <strong>na</strong>vrhnuté a postavené zásobovacie plavidlo. Projekt bol vyhotovený <strong>na</strong> Katedre automobilov,<br />
lodí a motorov Slovenskej technickej univerzity v Bratislave.<br />
Dear Reader<br />
It has become good practice that one volume of the university scientific letters is periodically devoted to transport<br />
and means of transport and their relation to the environment. This fact clearly shows that the topic is not on the periphery<br />
of the university interests. On the contrary, the fact that the very first volume published in the year when the university<br />
celebrates 50 years of its existence focuses on the above mentioned issues clearly shows that they are given<br />
appropriate attention.<br />
The EU Group”Transport 2000 plus” in its report “Transport in the rapidly changing Europe” mentiones that the<br />
branch of transport is one the main domains responsible for problems with energetic sources and impacts on the environment<br />
as it ranks among the greatest consumers of fossile sources of energy and those that substantially negatively<br />
influence the environment.<br />
Prevailing values of lifestyles and economy are decisive for further development of transport. Transport policy has,<br />
therefore, to take into account global and regio<strong>na</strong>l conditions. Those strategies which will implement changes in transportation<br />
systems and reduce ineffective traffic will have a good chance of success in the future. Negative impacts of<br />
transport on the environment will have to be reduced by introducing faster, safer and more comfortable means of public<br />
transport and by reducing individual transport mostly in large towns.<br />
Huge development of almost all industrial branches immediately affects transport. Automobile industry produces<br />
vehicles equipped with new technologies and transport operators fi<strong>na</strong>nce the sector by purchasing new vehicles. In the<br />
present “modern industrial society” a considerable part of population complains mostly of noise and emissions. This<br />
may be one reason why to solve the issue of ever-growing transport by building new fast highways avoiding centers of<br />
towns. While the production of emissions in steady-state operations has been more or less successfully solved, unsteady<br />
regimes of operations are to be solved as they result in a considerably significant impact on the environment. The topic<br />
of simulation of unsteady regimes of vehicle operation is approached in the paper of colleagues from the Faculty of<br />
Mechanical Engineering of the University of Žili<strong>na</strong>. Additio<strong>na</strong>l injection of fuel into the diesel engine cylinder is one<br />
of the methods leading to reduction of NO x production. Professor Szlachta writes about some results from the implementation<br />
of this method in his article.<br />
Reduction of noise from operation of railways vehicles can be achieved by a suitable desing of their bogies and<br />
running gears. Radial steering wheel sets avoid curve squeal. Geometry a<strong>na</strong>lysis of rails from the point of view of their<br />
wear in operation is another topical issue of railway vehicle operation. The results of negative impacts can again be<br />
noticed on the environment.<br />
Another unplesant phenomenon connected with the operation of means of transport are vibrations. A pseudo-stochastic<br />
model of terrain described by Mr Harman and Mr Ferencey offers a solution to the problem.<br />
Safe and reliable supply of fuels and waste collection are vital for continuous <strong>na</strong>vigation and environmental protection.<br />
In order to meet this objective a supply vessel was constructed. The design was made in the Department of<br />
Cars, Ships and Engines of the Slovak University of Technology in Bratislava.<br />
Vladimír Hlavňa
C O M M U N I C A T I O N S<br />
I S<br />
Daniela Ďurčanská – Milan Moravčík *<br />
POSUDZOVANIE VPLYVU AUTOMOBILOVEJ DOPRAVY<br />
NA ZNEČISTENIE OVZDUŠIA<br />
ASSESMENT OF THE IMPACT OF ROAD TRAFFIC ON AIR POLLUTION<br />
Negatívny vplyv <strong>dopravy</strong> <strong>na</strong> znečistenie ovzdušia je všeobecne<br />
známy. Automobilová doprava má veľký podiel <strong>na</strong> znečisťovaní prízemnej<br />
vrstvy atmosféry, v ktorej sa rozvíja život, špeciálne imisií, t. j.<br />
koncentrácie emitovaných znečisťujúcich látok. Dôvodom je emisia<br />
hlavných znečisťujúcich látok z <strong>automobilovej</strong> <strong>dopravy</strong> tesne <strong>na</strong>d povrchom<br />
zeme (CO – oxid uhličitý, NO x – suma oxidov dusíka a VOC –<br />
prchavé organické zlúčeniny).<br />
Príspevok sa zaoberá vplyvmi <strong>automobilovej</strong> <strong>dopravy</strong> <strong>na</strong> znečisťovanie<br />
ovzdušia a metodikou <strong>na</strong> výpočet množstva produkovaných<br />
znečisťujúcich látok, ktorá sa pre tento účel používa.<br />
The negative impact of traffic on air pollution is a generally known<br />
fact. Automobile traffic has a great share in polluting the ground layer<br />
of the atmosphere where life develops and this applies especially to<br />
emissions, i. e. concentrations of polluting substances being emitted.<br />
This is the result of emissions of the main polluting substances produced<br />
by automobile traffic (CO – carbon monoxide, NO x – sum of<br />
nitrogen oxides and VOC – volatile organic compounds) just above the<br />
surface of the earth.<br />
The article deals with the influence of automobile traffic on air<br />
pollution using the methodology of calculating the volume of generated<br />
pollutants applied for this purpose.<br />
1. Úvod<br />
Problém znečistenia ovzdušia od <strong>automobilovej</strong> <strong>dopravy</strong> nie je<br />
možné riešiť zvýšením výšky vypúšťania znečisťujúcich látok, ako sa<br />
to rieši pri priemyselných zdrojoch, kde sa dosiahnutie prípustných<br />
imisných limitov rieši stanovením tzv. minimálnej výšky komí<strong>na</strong>.<br />
Znížiť dopad <strong>automobilovej</strong> <strong>dopravy</strong> <strong>na</strong> znečistenie ovzdušia prízemnej<br />
vrstvy atmosféry z<strong>na</strong>mená znížiť emisie znečisťujúcich látok<br />
automobilov technickým zdoko<strong>na</strong>lením spaľovania, zachytením,<br />
poprípade transformáciou znečisťujúcich látok katalyzátormi. Ďalším<br />
riešením môže byť odklonenie alebo presmerovanie <strong>automobilovej</strong><br />
<strong>dopravy</strong> v oblasti s <strong>na</strong>jviac znečisteným ovzduším.<br />
1. Introduction<br />
The problem of air pollution caused by traffic cannot be solved<br />
by increasing the volumes of air polluting substances release as it<br />
is solved in industrial sectors, where permitted emission limits are<br />
secured by specifying the minimum chimney height. To reduce the<br />
impact of automobile traffic on pollution of the ground layer of the<br />
atmosphere, it means to reduce the emissions of pollutants coming<br />
from vehicles by means of technical enhancement of the combustion<br />
process, by means of interception or transformation of the polluting<br />
substances with catalysts. Another solution can be to deflect<br />
or redirect traffic from the areas with the most polluted air.<br />
2. Vplyv <strong>dopravy</strong> <strong>na</strong> znečistenie ovzdušia<br />
Zaťaženie životného prostredia ľudskou činnosťou – dopravou –<br />
– vzniká vnášaním chemických, fyzikálnych a biologických prvkov.<br />
Dôležité je neprekročiť mieru únosnosti územia, nepoškodiť ho.<br />
Doprava zaťažuje životné prostredie počas výstavby a prevádzky,<br />
<strong>na</strong>jviac hlukom a emisiami. V súčasnosti však už existujú také technologické<br />
postupy a technické vybavenie cestných komunikácií,<br />
ktoré dokážu zabezpečiť neprekročenie predpísaných hygienických<br />
limitov.<br />
Doprava a dopravný priemysel v Európe spotrebováva 20 %<br />
celkovej energie, z tohto množstva až 83 % spotrebováva cestná<br />
2. Impact of Traffic on Air Pollution<br />
The burden laid on the environment by human activity – by<br />
the traffic – is the result of bringing chemical, physical, and biological<br />
components into the environment. It is important not to<br />
exceed the rate of sustai<strong>na</strong>bility of a territory and not damage it.<br />
The traffic has had a bad impact on the environment already when<br />
new roads are constructed and exploited, mostly due to noise and<br />
emissions. Nowadays, technological methods and technical equipment<br />
have been developed that can ensure that the specified<br />
hygienic limits will not be exceeded.<br />
Traffic and traffic industry in Europe consumes up 20 % of the<br />
overall energy, and 83 % out of this amount is consumed by road<br />
* Assoc. Prof., MSc., Daniela Ďurčanská, Ph.D., MSc. prof. Ing. Milan Moravčík, Ph.D.<br />
University of Žili<strong>na</strong>, Faculty of Civil Engineering, Department of Highway Engineering, Komenského 52, Žili<strong>na</strong>, E-mail: durcan@fstav.utc.sk<br />
University of Žili<strong>na</strong>, Faculty of Civil Engineering, Department of Construction Ma<strong>na</strong>gement, Komenského 52, Žili<strong>na</strong>, E-mail: milanm@fstav.utc.sk<br />
KOMUNIKÁCIE / COMMUNICATIONS<br />
1/2003 ●<br />
5
C O M M U N I C A T I O N S<br />
I S<br />
doprava, ktorá však tiež vyprodukuje 81 % oxidu uhoľ<strong>na</strong>tého CO<br />
a 51 % oxidov dusíka NO x . Diaľnice dokážu tento priemer znížiť<br />
približne o 25 % [1].<br />
Na znečisťovaní ovzdušia <strong>na</strong> Slovensku sa doprava podieľa asi<br />
23 %, <strong>na</strong>jväčším znečisťovateľom je energetika so svojimi cca 42 %.<br />
Podiel mobilných zdrojov <strong>na</strong> tvorbe základných znečisťujúcich<br />
látok v ostatnom období je uvedený v tab. č. 1 [2].<br />
traffic, which also produces 81 % of CO and 51 % of NO x nitrogen<br />
oxides. Highways can decrease this amount by about 25 %. [1]<br />
In Slovakia, the share of traffic in air pollution is about 23%,<br />
while the main polluter, power engineering has a 42% share in air<br />
pollution. The share of mobile sources in production of basic polluting<br />
elements in the last years is shown in Table 1 [2].<br />
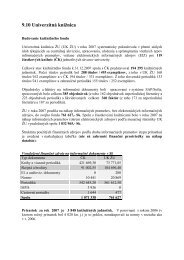
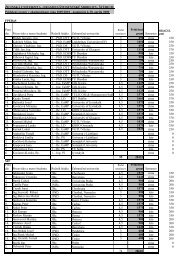
Emisie základných znečisťujúcich látok od mobilných Tab. 1<br />
zdrojov za obdobie 1995 – 1999<br />
Roky<br />
Znečisťujúce látky [tis.t/rok]<br />
oxid uhoľ<strong>na</strong>tý oxid dusíka oxid siričitý tuhé emisie<br />
CO NO x SO 2<br />
1995 181,1 52,9 2,4 3,2<br />
1996 154,3 43,4 2,3 2,5<br />
1997 144,2 44,5 2,4 2,7<br />
1998 144,6 46,3 2,7 2,9<br />
1999 132,5 42,9 1,1 2,7<br />
Emissions of basic polluting substances coming Table 1<br />
from mobile sources in 1995-1999<br />
Year<br />
Polluting substances [1000.t/year]<br />
carbon nitrogen sulphur<br />
monoxide oxides dioxid particles<br />
CO NO x SO 2<br />
1995 181.1 52.9 2.4 3.2<br />
1996 154.3 43.4 2.3 2.5<br />
1997 144.2 44.5 2.4 2.7<br />
1998 144.6 46.3 2.7 2.9<br />
1999 132.5 42.9 1.1 2.7<br />
Na znečisťovaní ovzdušia v okolí cestných komunikácií sa<br />
podieľajú hlavne škodliviny z výfukových plynov vozidiel a zvýšená<br />
prašnosť spôsobená vírením usadených častíc <strong>na</strong> povrchu vozovky<br />
a v jej blízkosti.<br />
Air pollution in the vicinity of roads is the result of pollutants<br />
coming from vehicle exhaust gases and the increased amount of<br />
dust caused by whirling of sedimentary particles on the surface of<br />
pavements and around the pavements.<br />
3. Možnosti minimalizácie vplyvov <strong>automobilovej</strong><br />
<strong>dopravy</strong> <strong>na</strong> životné prostredie<br />
Ďalší vývoj <strong>dopravy</strong> je neoddeliteľne spojený s otázkami hodnôt<br />
životného štýlu, spôsobu života a hospodárstva. Verejným záujmom<br />
určený rámec, v ktorom sa môžu dopravné koncepcie pohybovať,<br />
závisí od meniaceho sa postoja spoločnosti k týmto otázkam.<br />
Dopravná politika musí preto zohľadňovať globálne aj regionálne<br />
podmienky. Perspektívu majú tie stratégie, ktoré uvažujú so zmenou<br />
dopravných systémov a s obmedzením neefektívnej <strong>dopravy</strong>. Škodlivé<br />
účinky <strong>dopravy</strong> <strong>na</strong> životné prostredie musia byť obmedzované<br />
presadzovaním rýchlejších, bezpečnejších a pohodlnejších dopravných<br />
prostriedkov verejnej <strong>dopravy</strong>, ako aj obmedzovaním individuálnej<br />
<strong>dopravy</strong> hlavne vo veľkých mestách.<br />
Vplyv trasovania <strong>na</strong> rozptyl emisií<br />
Kvalita a čistota ovzdušia sa stali vážnym problémom pri <strong>na</strong>vrhovaní<br />
dopravných sietí v mestách i mimo nich, pri organizovaní<br />
<strong>dopravy</strong> a územnom plánovaní. Dopravné kolapsy v mestách z<strong>na</strong>me<strong>na</strong>jú<br />
zvýšenie koncentrácie škodlivín.<br />
Oxidy dusíka patria ku škodlivinám, ktoré pri súčasnom zložení<br />
pohonných hmôt predstavujú jednu z <strong>na</strong>jzávažnejších zložiek výfukových<br />
plynov, pretože dosahujú pomerne vysoké koncentrácie<br />
škodlivých látok produkovaných do ovzdušia, sú dobre zistiteľné<br />
monitorovaním a dajú sa určovať výpočtom. Preto sa spravidla<br />
používajú ako indikátor znečistenia ovzdušia výfukovými plynmi<br />
od <strong>dopravy</strong>.<br />
3. Possibilities of Minimizing the Impact of Traffic<br />
on the Environment<br />
Further traffic development is inseparably connected with the<br />
issue of life style values, living conditions and the level of economy.<br />
The framework defined by the public interest within which traffic<br />
concepts can be developed, depends on changing the attitude of<br />
the society towards these issues. A traffic policy must therefore<br />
consider global and regio<strong>na</strong>l conditions. Such strategies that involve<br />
changes in traffic systems and some reduction of ineffective traffic<br />
seem to be perspective. Harmful effects of the traffic on the environment<br />
must be reduced by implementation of faster, safer and<br />
more comfortable public traffic service, as well as by limitation of<br />
individual traffic, in large cities in particular.<br />
Influence of Layout on Emissions Dispersion<br />
The quality and cleanness of the atmosphere has become<br />
a serious problem in traffic network planning in and outside cities,<br />
in traffic organization and regio<strong>na</strong>l planning. Traffic collapses in<br />
cities lead to higher concentration of pollutants.<br />
Nitrogen oxides belong to such pollutants that represent one of<br />
the crucial components of exhaust gases coming from the current<br />
fuels, because they reach relatively high concentrations of pollutants<br />
produced into the atmosphere. They are also easy to monitor<br />
and can be estimated by calculation. Therefore they can be used<br />
as an indicator of air pollution caused by emissions coming from<br />
the traffic exhaust gases.<br />
6<br />
● KOMUNIKÁCIE / COMMUNICATIONS 1/2003
C O M M U N I C A T I O N S<br />
I S<br />
Poloha komunikácie je po výstavbe nemenná, preto jej treba<br />
venovať pozornosť pri riešení komunikačných systémov sídiel.<br />
Podľa [3] bol sledovaný rozptyl škodlivín v závislosti od polohy<br />
nivelety komunikácie (v záreze, <strong>na</strong> teréne, v násype) a výsledky<br />
poukazujú <strong>na</strong> fakt, že táto závislosť sa prejavuje len pri rýchlosti<br />
vetra menšej ako 3 m/s, kedy sa zemné teleso v násype javí ako<br />
vhodnejšie pre rozptyl emisií. Koncentrácie NO x <strong>na</strong>merané pri<br />
komunikácii v násype boli 2-krát menšie ako pri komunikácii<br />
vedenej v úrovni terénu.<br />
The position of the road is permanent after it is constructed,<br />
so it is necessary to pay attention to the design of communication<br />
systems. According to [3], dispersion of pollutants dependent on<br />
the vertical alignment position (in the cut, in the field, on the<br />
embankment) was monitored and the results show that this dependence<br />
is seen only when the wind velocity is under 3 m/s, and in<br />
this case the formation level seems to be more suitable for emission<br />
dispersion. NO x concentrations monitored near a road on the<br />
embankment were twice lower than the concentrations near a road<br />
located at the ground level.<br />
Obr. 1 Vplyv rýchlosti vetra <strong>na</strong> rozptyl emisií<br />
(p – pozdĺžny sklon nivelety, v – rýchlosť vozidla)<br />
Fig. 1 The influence of the wind velocity on the emission dispersion<br />
(p – longitudi<strong>na</strong>l gradient of the vertical alignment, v – vehicle velocity)<br />
Obr. 2 Vplyv polohy zemného telesa [3]<br />
Fig. 2 The influence of the construction limits position [3]<br />
Na obr. 1 a 2 sú uvedené porovnávacie údaje vypočítané pre<br />
rov<strong>na</strong>ko smerovo orientovaný úsek komunikácie dlhý jeden km,<br />
šírkové usporiadanie MS 21,5 pre mestský režim jazdy vozidiel, čo<br />
zodpovedá zbernej komunikácii (MS) a R 22,5 pre mimomestský<br />
(plynulý) režim jazdy <strong>na</strong> rýchlostnej komunikácii (R). Uvažovaný<br />
počet osobných vozidiel bol 10 000 / 24 h, nákladných 1000 / 24 h,<br />
špičková polhodinová doprava bola uvažovaná hodnotou 5 % z celodennej<br />
24-hodinovej <strong>dopravy</strong>.<br />
Cestná zeleň<br />
Účelné použitie cestnej zelene môže veľkou mierou zmierniť<br />
negatívne vplyvy <strong>automobilovej</strong> <strong>dopravy</strong>. V minulosti sa účinok<br />
zelene nevyužíval dostatočne. V súčasnosti sa ochra<strong>na</strong> a tvorba<br />
životného prostredia i jeho skvalitňovanie dávajú do súvislosti<br />
s problémom rovnováhy medzi civilizačnou a biologickou zložkou<br />
človeka. Jed<strong>na</strong> z mnohých funkcií zelene je aj filtračná a v súvislosti<br />
s tým sa uplatňuje výsadba zelene pozdĺž komunikácie<br />
Nie každá forma výsadby vedie k zlepšeniu situácie. Dôležitá<br />
je hĺbka výsadby a jej filtračná účinnosť. Výsadba môže zachytávať<br />
prašnosť a rovnomerne rozptyľovať plynné emisie.<br />
Regulovanie rýchlosti prúdenia vetra hustou výsadbou vedie<br />
k zvýšeniu prašnosti v tesnej blízkosti komunikácie. Lepšie účinky<br />
sa dosiahnu výsadbou drevín, cez ktoré vietor prechádza.<br />
Figures 1 and 2 show comparative data calculated for a 1 km<br />
long road section with the same directio<strong>na</strong>l orientation with the<br />
wideness category of MS 21.5 for urban driving mode, which corresponds<br />
to a local distributor road and R22.5 for rural (fluent)<br />
driving mode on an expressway (R) . The assumed number of passenger<br />
cars was 10,000 / 24 hours, trucks 1,000 / 24 hours, the<br />
peak traffic in half an hour was assumed to be 5% out of the total<br />
all-day long 24 hours traffic.<br />
Road Greenery<br />
Effective usage of the road greenery can considerably reduce<br />
the negative impact of automobile traffic. In the past, the effect of<br />
greenery was not utilized sufficiently. Nowadays, the protection<br />
and creation of the environment and its enhancement is associated<br />
with the problem of balance between the civilization and biological<br />
aspects of a man. One of the various functions of the greenery<br />
is filtration, so greenery is planted along roads.<br />
However, not every form of planting results in improved situation.<br />
Depth of the planting and its filtering efficiency are very<br />
important. The greenery can capture dust and equally disperse<br />
gaseous emissions.<br />
Regulation of wind velocity by dense planting increases the<br />
volume of dust in the vicinity of the road. The species that allow<br />
the wind to blow through are more effective.<br />
KOMUNIKÁCIE / COMMUNICATIONS 1/2003 ●<br />
7
C O M M U N I C A T I O N S<br />
I S<br />
Obr. 3 Hustý porast<br />
Fig. 3 Dense greenery<br />
Obr. 4 List<strong>na</strong>tý porast<br />
Fig. 4 Deciduous greenery<br />
Obr. 5 Zmiešaný porast<br />
Fig. 5 Mixed greenery<br />
Krovitý list<strong>na</strong>tý hustý porast šírky 5 m (obr. 3) spôsobuje<br />
redukciu rozptylu škodlivín do okolia asi 20 %. Porast šírky 10 m<br />
(obr. 4) spôsobuje v lete redukciu rozptylu škodlivín až 60 %. Najvhodnejšia<br />
je kombinácia list<strong>na</strong>tých a ihlič<strong>na</strong>tých stromov. Nie sú<br />
výkyvy v účinnosti výsadby v lete a v zime (obr. 5) [3].<br />
Pri list<strong>na</strong>tých a ihlič<strong>na</strong>tých stromoch sa prejavuje zachytávanie<br />
prachu produkciou kyslíka a spotrebou kysličníka uhličitého. Pri<br />
plynných exhalátoch je účinok zelene len pri malých koncentráciách.<br />
V opačnom prípade dochádza k vysýchaniu hlavne ihlič<strong>na</strong>tých<br />
stromov.<br />
Z uvedených porov<strong>na</strong>ní vyplýva, že problematiku dopadu<br />
<strong>dopravy</strong> <strong>na</strong> znečistenie ovzdušia v mestách je potrebné riešiť už<br />
<strong>na</strong> úrovni územnoplánovacej dokumentácie, kde sa rozhoduje<br />
o umiestnení komunikácií.<br />
Potreba rovnováhy civilizačnej<br />
a biologickej zložky človeka<br />
sa výraznejšie prejavuje v mestskom<br />
intraviláne, kde sa <strong>na</strong> zhoršovaní<br />
životného prostredia podieľa<br />
aj automobilová doprava.<br />
V intraviláne miest je citlivo<br />
vnímaný aj hluk od <strong>dopravy</strong>.<br />
Zeleň popri komunikácii tlmí<br />
hluk od <strong>dopravy</strong> v závislosti od<br />
Obr. 6 Vplyv šírky zelene <strong>na</strong> redukciu imisií<br />
Fig. 6 The influence of the green belt on emission reduction<br />
A bushy, dense deciduous greenery with the width of 5 m (see<br />
Fig. 3) reduces the dispersion of the pollutants to the surrounding<br />
by approximately 20 %. The greenery with the width of 10 m (see<br />
Fig. 4) reduces the dispersion of the pollutants by up to 60 % in<br />
the summer. The most proper is the combi<strong>na</strong>tion of deciduous<br />
and coniferous species. There is no oscillation in the efficiency of<br />
the planting between summer and winter (see Fig. 5) [3].<br />
The effect of capturing the dust by oxygen production and<br />
carbon dioxide consumption can be seen in deciduous and coniferous<br />
trees. Considering gaseous pollutants, greenery is effective<br />
only in case of low concentrations, otherwise coniferous trees in<br />
particular dry up.<br />
It can be seen from the presented comparisons that the question<br />
of the impact of traffic on air pollution in urban agglomerations<br />
should be solved already at the stage of land planning<br />
documentation, where the location<br />
of the roads is determined.<br />
The need of the balance between<br />
civilization and biological aspects of<br />
man is manifested especially in urban<br />
agglomerations, where automobile<br />
traffic makes the environment worse.<br />
The noise from the traffic is felt<br />
as a sensitive issue in urban agglomerations.<br />
The greenery mutes this<br />
noise depending on the width of the<br />
green belt. More significant muting<br />
8<br />
● KOMUNIKÁCIE / COMMUNICATIONS 1/2003
C O M M U N I C A T I O N S<br />
I S<br />
šírky zeleného pásu. Výraznejšie tlmenie sa prejavuje od šírky 15 –<br />
– 20 m. V zelenom páse je vhodná kombinácia stromov a kríkov,<br />
aby hluk prenikal čo <strong>na</strong>jmenej. Odporúča sa kombinácia list<strong>na</strong>tých<br />
a ihlič<strong>na</strong>tých drevín, <strong>na</strong>koľko list<strong>na</strong>té vo vegetačnom kľude nemajú<br />
vplyv <strong>na</strong> zníženie hluku. Zníženie hlukovej energie spočíva vo veľkom<br />
množstve odrazov od listov, konárov a ihličia, teda nie v pohlcovaní.<br />
Protihlukové clony<br />
Osadenie protihlukových clôn, stien a valov pozitívne pôsobí<br />
aj <strong>na</strong> rozptyl emisií. Ste<strong>na</strong> síce tvorí bariéru, ktorá ovplyvní koncentráciu<br />
plynných látok v blízkosti komunikácie, ale pri jej vhodnom<br />
umiestnení redukuje túto hodnotu v oblasti za stenou, kde dochádza<br />
k zníženiu koncentrácie. Pokiaľ je teda vybudovaný chodník<br />
pre peších za protihlukovou stenou, sú dosahované koncentrácie<br />
v ovzduší nižšie.<br />
can be seen starting from the width of 15 – 20 m. In the green belt<br />
it is appropriate to combine trees and bushes, so that as little noise<br />
passes through as possible. It is recommended to combine deciduous<br />
and coniferous species, because the deciduous species have<br />
no effect on noise protection during their vegetative standstill. The<br />
reduction of noise energy is the result of the large amount of noise<br />
reflected on the leaves, branches and needles, not of absorption.<br />
Noise Barriers<br />
Construction of noise barriers has got positive influence also<br />
on the emission dispersion. A wall makes a barrier that affects the<br />
concentration of gaseous substances near the road, however, if it<br />
is properly situated, it reduces this value in the area behind the<br />
wall. Therefore, if footpaths are constructed behind noise barriers,<br />
the concentrations in the air are lower.<br />
Obr. 7 Vplyv protihlukovej steny <strong>na</strong> redukciu imisií<br />
(rýchlosť vetra 2m.s 1 )<br />
Fig. 7 Effect of the noise barrier on the emission reduction<br />
(wind velocity 2m.s 1 )<br />
Obr. 8 Porov<strong>na</strong>nie účinku zelene, protihlukovej steny<br />
a zemného valu [3] (š – šírka, h – výška)<br />
Fig. 8 Comparison of the effect of greenery, noise wall<br />
and embankment [3]<br />
Z uvedených porov<strong>na</strong>ní vyplýva, že problematiku dopadu<br />
<strong>dopravy</strong> <strong>na</strong> znečistenie ovzdušia v mestách je potrebné riešiť už<br />
<strong>na</strong> úrovni územnoplánovacej dokumentácie, kde sa rozhoduje<br />
o umiestnení komunikácií, pričom je nevyhnutné porovnávanie<br />
variantných riešení.<br />
4. Možnosti ovplyvnenia produkcie emisií<br />
Redukovanie zdroja škodlivín predstavuje ovplyvňovanie intenzity<br />
<strong>dopravy</strong> zmenou dopravných tokov, znižovaním podielu nákladných<br />
vozidiel, obmedzovaním rýchlosti, čo možno dosiahnuť dopravným<br />
z<strong>na</strong>čením a zosúladením režimu <strong>dopravy</strong> v rámci komunikačného<br />
systému (zelené vlny).<br />
V grafoch <strong>na</strong> obr. 10 a 11 sú uvedené porovnávacie údaje vypočítané<br />
pre rov<strong>na</strong>ko smerovo orientovaný úsek komunikácie dlhý<br />
jeden km, šírkové usporiadanie MS 21,5 pre mestský režim jazdy vozidiel,<br />
čo zodpovedá zbernej komunikácii (MS) a rýchlostnej komunikácii<br />
R 22,5 pre mimomestský (plynulý) režim jazdy. Uvažovaný<br />
počet osobných vozidiel bol 10 000/24 h, nákladných 1000/24 h,<br />
špičková polhodinová doprava bola uvažovaná hodnotou 5 % z celodennej<br />
24-hodinovej <strong>dopravy</strong>. Výpočet je uskutočnený podľa metodiky<br />
SAV [4].<br />
It can be seen from the presented comparisons that it is necessary<br />
to solve the impact of the traffic on air pollution already at<br />
the stage of land planning documentation, where the location of<br />
the roads is determined.<br />
4. Possibilities of the Influencing the Production<br />
of Emissions<br />
To reduce sources of pollutants means to influence traffic<br />
intensity by changing traffic flows, reducing the number of trucks,<br />
limiting speed, which can be achieved by road signs and synchronization<br />
of the traffic mode in terms of the communication system<br />
(green waves).<br />
Figures 9 and 10 show comparative data calculated for a 1 km<br />
long road section with the same directio<strong>na</strong>l orientation with the<br />
wideness category of MS 21.5 for urban driving mode, which corresponds<br />
to a local distributor road (MS) and a R22.5 expressway<br />
for rural (fluent) driving mode. The assumed number of passenger<br />
cars was 10,000/24 hours, trucks 1,000/24 hours, the peak traffic<br />
in half an hour was assumed to be 5 % from the total all-day 24 hours<br />
traffic. The calculation was done according to the SAV (Slovak<br />
Science Academy) methodology. [4]<br />
KOMUNIKÁCIE / COMMUNICATIONS 1/2003 ●<br />
9
C O M M U N I C A T I O N S<br />
I S<br />
Obr. 9 Vplyv rýchlosti jazdy vozidiel<br />
Fig. 9 Effect of the driving speed<br />
Obr. 10 Vplyv pozdĺžneho sklonu komunikácie<br />
Fig. 10 Effect of the slope<br />
Vplyv regulácie <strong>dopravy</strong> <strong>na</strong> produkciu emisií<br />
Pri skvalitňovaní životného prostredia v mestách zohráva výz<strong>na</strong>mnú<br />
úlohu preventívny prístup k riešeniu problémov. Doprava<br />
ako taká je v súčasnosti problémom každého mesta. Jedným z príkladov,<br />
ako možno riešiť problém z hľadiska znečisťovania ovzdušia<br />
z <strong>dopravy</strong>, je rozsiahla štúdia pracovníkov Technickej univerzity<br />
v Grazi [5].<br />
Pracovníci Technickej univerzity v Grazi vypracovali <strong>na</strong> základe<br />
testovania <strong>dopravy</strong> vo vopred zvolenej oblasti mesta štúdiu, v ktorej<br />
vyhodnotili spotrebu pohonných hmôt a vznik plynných emisií od<br />
<strong>dopravy</strong> v neregulovanej oblasti, pri zavedení obmedzenej rýchlosti<br />
<strong>na</strong> 30 km.h 1 a pri rýchlosti 50 km.h 1 v tej istej oblasti.<br />
Sledované boli emisie oxidov dusíka NO x , oxid uhoľ<strong>na</strong>tý CO,<br />
produkcia nespálených uhľovodíkov C x H y (resp. HC), spotreba<br />
pohonných hmôt a cestovná rýchlosť. Uvedené faktory boli sledované<br />
a prepočítavané <strong>na</strong> tzv. jednotkové osobné vozidlo, ktoré<br />
vychádza zo zloženia dopravného prúdu zo 67 % vozidiel s benzínovým<br />
motorom (zážihovým) bez katalyzátora, 21 % vozidiel s benzínovým<br />
motorom s katalyzátorom a 12 % vozidiel s dieselovým<br />
motorom (vznetovým).<br />
Effect of Traffic Regulation on Emission Production<br />
When enhancing the environment in urban agglomerations,<br />
preventive approach to problem solving plays a significant role.<br />
Traffic is a problem of every city nowadays. One of the examples<br />
how to solve this problem in terms of air pollution caused by traffic<br />
is a large study of the Technical University of Graz. [5]<br />
Research workers from the TU Graz worked out a study based<br />
on testing the traffic in previously selected parts of the town, where<br />
they evaluated fuel consumption and emissions coming from traffic<br />
in an uncontrolled zone, when the speed was limited to 30 km/h<br />
and 50 km/h within the same zone.<br />
Emissions of NO x nitrogen oxides, carbon monoxide CO, production<br />
of non-combusted hydrocarbons C x H x (or HC), fuel consumption<br />
and traveling speed were monitored. These factors were<br />
calculated per passenger car unit (PCU), which is based on the<br />
traffic flow composition, where 67 % are the vehicles with gasoline<br />
engines (petrol engine) without catalyst, 21 % the gasoline engines<br />
with catalyst and 12 % are the vehicles with diesel engine (oil<br />
engine).<br />
Obr. 11 Produkcia oxidu uhoľ<strong>na</strong>tého CO<br />
pre uvažované jednotkové vozidlo<br />
Fig. 11 CO production per PCU<br />
Obr. 12 Produkcia oxidov dusíka NO x<br />
pre uvažované jednotkové vozidlo<br />
Fig. 12 NO x production per PCU<br />
Vzhľadom k závislosti <strong>na</strong> práci motora, ktorá úzko súvisí s profilom<br />
komunikácie, s miestom pred a za križovatkou resp. medzi<br />
Because engine work depends on road profile, location in<br />
a place in front of or behind or between crossroads, where con-<br />
10 ● KOMUNIKÁCIE / COMMUNICATIONS 1/2003
C O M M U N I C A T I O N S<br />
I S<br />
križovatkami, kde možno hovoriť o konštantnej rýchlosti jazdy,<br />
bola vyhodnotená tvorba emisií jednotkového vozidla (pozri obr.<br />
11 – 14).<br />
Tvorba emisií oxidu uhoľ<strong>na</strong>tého je silne závislá od cestovnej<br />
rýchlosti, produkcia uhľovodíkov je tiež závislá od rýchlosti, ale pri<br />
oxidoch dusíka sa cestovná rýchlosť pri ich tvorbe neprejavuje.<br />
stant driving speed can be presumed, production of the emissions<br />
per a passenger car unit was evaluated (see Figs. 11 – 14).<br />
Production of the carbon monoxide emissions strongly depends<br />
on the traveling speed, production of hydrocarbons depends on<br />
the speed, too, however, the driving speed is not significant for the<br />
production of nitrogen oxides.<br />
Obr. 13 Produkcia uhľovodíkov HC<br />
pre uvažované jednotkové vozidlo<br />
Fig. 13 HC production per PCU<br />
Obr. 14 Spotreba pohonných hmôt<br />
pre uvažované jednotkové vozidlo<br />
Fig. 14 Fuel consumption per PCU<br />
5. Matematické modelovanie znečistenia ovzdušia<br />
V prvom priblížení môžeme považovať cestu za lineárny zdroj<br />
znečisťujúcich látok, <strong>na</strong> ktorom sú produkované znečisťujúce látky<br />
rozdelené rovnomerne. Existuje niekoľko principiálne odlišných<br />
metód matematického modelovania znečistenia ovzdušia z <strong>automobilovej</strong><br />
<strong>dopravy</strong> [4, 9, 10]. Stručne popíšeme a<strong>na</strong>lytický model.<br />
A<strong>na</strong>lytický model – lineárny zdroj<br />
Najjednoduchší model automobilového znečistenia ovzdušia<br />
je založený <strong>na</strong> jednoduchom poloempirickom gaussovskom vzťahu<br />
pre distribúciu znečisťujúcich látok v dymovej vlečke z lineárneho<br />
zdroja. Pre prízemnú koncentráciu znečisťujúcej látky bude platiť:<br />
2q<br />
C(x, y, 0) E(y 2 U sin 1 , y 2 ), (1)<br />
z<br />
kde q je emisia lineárneho zdroja v mg.m 1 .s 1 , U je rýchlosť<br />
vetra v m.s 1 , je uhol medzi smerom vetra a osou komunikácie,<br />
z je empirický parameter, charakterizujúci rozptyl znečisťujúcich<br />
látok vo vertikálnom smere. Funkcia E(y 1 , y 2 ) vyjadruje vplyv konečnosti<br />
lineárneho zdroja <strong>na</strong> distribúciu koncentrácie znečisťujúcich<br />
látok v okolí koncov komunikácie<br />
E(y 1 , y 2 ) p 2<br />
p 1<br />
<br />
1<br />
2<br />
2 exp p <br />
2 <br />
dp erf(p 2 ) erf(p 1 ) , (2)<br />
kde p 1 y 1 / y , p 2 y 2 / y , y je parameter, charakterizujúci<br />
rozptyl znečisťujúcich látok v horizontálnom smere.<br />
Pre nekonečný zdroj, pre ktorý y 1 , y 2 bude E(y 1 ,<br />
y 2 ) 1.<br />
Uvedený model je veľmi jednoduchý, spoľahlivý a používa sa<br />
<strong>na</strong> výpočet znečistenia ovzdušia z <strong>automobilovej</strong> <strong>dopravy</strong> <strong>na</strong>d rozsiahlou<br />
oblasťou. Podrobne bol popísaný v [6].<br />
5. Mathematical Modeling of Air Pollution<br />
In the first approximation, a street may be taken as a linear<br />
source of pollutants, where the produced pollutants are distributed<br />
equally. There are several principally different methods of mathematical<br />
modeling of air pollution caused by traffic [4, 9, 10]. The<br />
a<strong>na</strong>lytical model will be described briefly.<br />
A<strong>na</strong>lytical Model – Linear Source<br />
The easiest model of the air pollution caused by traffic is based<br />
on the elementary semi- empirical Gauss relationship for pollutant<br />
distribution in a smoke tow coming from a linear source. The<br />
following will apply for the ground concentration of a pollutant:<br />
2q<br />
C(x, y, 0) E(y 2 U sin 1 , y 2 ), (1)<br />
z<br />
where q is emission from the linear source (mg.m 1 .s 1 ), U is<br />
wind velocity (m.s 1 ), is the angle between the wind direction<br />
and the road axis, z is the empirical parameter characterizing vertical<br />
dispersion of the pollutants. The E(y 1 , y 2 ) function expresses<br />
the effect of the linear source fi<strong>na</strong>lity on the distribution of the<br />
pollutants near the ends of the road.<br />
E(y 1 , y 2 ) p 2<br />
p 1<br />
<br />
1<br />
2<br />
2 exp p <br />
2 <br />
dp erf(p 2 ) erf(p 1 ) , (2)<br />
where p 1 y 1 / y , p 2 y 2 / y , y is the parameter characterizing<br />
horizontal dispersion of the pollutants.<br />
For an unlimited source, where y 1 , y 2 , the E(y 1 ,<br />
y 2 ) function will be E(y 1 , y 2 ) 1.<br />
The presented model is a simple and reliable one and is used<br />
to compute air pollution caused by traffic over large areas. A detailed<br />
description of this model is in [6].<br />
KOMUNIKÁCIE / COMMUNICATIONS 1/2003 ●<br />
11
C O M M U N I C A T I O N S<br />
I S<br />
Popis programu pre modelovanie produkcie emisií<br />
Matematické modelovanie sa vykonáva <strong>na</strong> základe dopravnej<br />
prognózy. Trasa komunikácie musí byť umiestnená do súradnicového<br />
systému. Študované územie okolo trasy alebo objektu sa rozdelí<br />
<strong>na</strong> sieť bodov so vzájomnou vzdialenosťou 10 až 100 m, podľa veľkosti<br />
územia pre ktoré sa vypočítava produkcia emisií a koncentrácie<br />
oxidov dusíka.<br />
Predpoklady a neurčitosti modelového výpočtu<br />
●<br />
●<br />
●<br />
●<br />
odhadovaná priemerná rýchlosť dopravného prúdu,<br />
špecifické emisie automobilov sú uvažované pre všeobecné zloženie<br />
dopravného prúdu pre súčasnú intenzitu <strong>dopravy</strong> a výhľad<br />
<strong>na</strong> ďalšie roky,<br />
veterné pomery o prevládajúcom smere vetra vychádzajú z priemerných<br />
údajov podľa dlhodobého sledovania SHMÚ, priemerná<br />
rýchlosť vetra je určená zo všetkých meraní vrátane bezvetria,<br />
uvažuje sa s <strong>na</strong>jnepriaznivejšou stabilitou ovzdušia, kedy dochádza<br />
k <strong>na</strong>jsilnejšej záťaži dýchacej zóny.<br />
Vstupné údaje modelovania<br />
V numerickom modeli pre modelovanie emisií od mobilných<br />
zdrojov sú zohľadnené:<br />
– emisné faktory pre súčasný a budúci vozidlový park,<br />
– objem <strong>dopravy</strong> a jej zloženie podľa druhov vozidiel,<br />
– pozdĺžny sklon komunikácie,<br />
– mestský resp. mimomestský režim <strong>dopravy</strong> (plynulosť jazdy vozidla,<br />
zástavba v okolí cesty),<br />
– časový interval hodnotenia produkcie emisií,<br />
– rýchlosť jazdy vozidla,<br />
– poveternostné podmienky (smer a rýchlosť vetra),<br />
– klimatické podmienky (podľa Pasquill-Giffordovských kategórií<br />
stability).<br />
Výstupy programového riešenia<br />
● výpočet celkovej produkcie škodlivín do voľnej atmosféry (kg/<br />
deň),<br />
● výpočet koncentrácie škodliviny v ovzduší (g.m 3 ).<br />
Najvýz<strong>na</strong>mnejším vstupným údajom všetkých matematických<br />
modelov znečistenia ovzdušia je emisia zdroja Q. Ako je vidieť,<br />
<strong>na</strong>pr. zo vzťahu (1) je koncentrácia znečisťujúcej látky priamoúmerná<br />
emisii zdroja. Emisiu komunikácie nie je možno merať<br />
priamo, ako je to <strong>na</strong>príklad pri stacionárnych zdrojoch. Počítame<br />
ju <strong>na</strong> základe z<strong>na</strong>losti emisie automobilov, ktoré prejdú komunikáciou,<br />
podľa vzťahu<br />
Description of the Program for the Emission<br />
Production Modeling<br />
Mathematical modeling is done on the basis of a traffic prognosis.<br />
Horizontal alignment of the road must be placed into a system<br />
of coordi<strong>na</strong>tes. The studied area around the road or the object is<br />
fit into the grid of the size of 10 or 100 meters between the points,<br />
according to the size of the area, for which the emission production<br />
and nitrogen oxides concentration are calculated.<br />
Assumptions and Indefinite Aspects of the Model Calculation<br />
●<br />
●<br />
●<br />
●<br />
Estimated average speed of the traffic flow,<br />
Specific emissions are considered for general composition of the<br />
traffic flow, for the current traffic volume and the prospective<br />
for the next years,<br />
Windy conditions related to the domi<strong>na</strong>nt wind direction are<br />
based on the average data from long-term monitoring of SHMU<br />
(Slovak Institute of Hydro-Meteorology), the average wind velocity<br />
is determined from all the measurements, including doldrums,<br />
The most unfavorable air stability is assumed, when there are<br />
the highest demands on the breathing zone.<br />
Modeling Input Data<br />
In a numerical model for modeling the emissions coming from<br />
mobile sources, the following is considered:<br />
– Emission factors for the current and future fleet,<br />
– Traffic volume and its composition according to a vehicle type,<br />
– Longitudi<strong>na</strong>l gradient of the road,<br />
– Urban or rural traffic mode (driving fluency, buildings along<br />
the road),<br />
– Period of the evaluation of emission production,<br />
– Driving speed,<br />
– Meteorological conditions (direction and velocity of the wind),<br />
– Climatic conditions (according to Pasquill-Gifford categories of<br />
stability).<br />
Modeling Output Data<br />
●<br />
●<br />
Calculation of the overall production of the pollutants into the<br />
atmosphere (kg/day),<br />
Calculation of the concentration of the pollutants in the atmosphere<br />
(g.m 3 ).<br />
The most significant input data for any mathematical model of<br />
air pollution is the source of an emission. For example, in formula<br />
(1) the concentration of the pollutant is directly proportio<strong>na</strong>l to<br />
the source of the emission. Emission of the road cannot be measured<br />
directly as it is in the case of a statio<strong>na</strong>ry source. The calculation<br />
is based on knowing the emissions coming from the vehicles running<br />
through the road according to the following relationship:<br />
PO EMO PN EMN<br />
Q , (3)<br />
3600 T S<br />
Q , (3)<br />
PO EMO PN EMN<br />
<br />
3600 T S<br />
12 ● KOMUNIKÁCIE / COMMUNICATIONS 1/2003
C O M M U N I C A T I O N S<br />
I S<br />
kde PO, PN – počet osobných, resp. nákladných vozidiel za čas T,<br />
EMO, EMN sú emisné faktory pre osobné, resp. nákladné automobily<br />
v mg.m 1 , S je šírka komunikácie v m.<br />
I keď vieme stanoviť PO, PN s vysokou presnosťou, je prakticky<br />
nemožné stanoviť presne emisné faktory EMO a EMN. Môžeme<br />
predpokladať, že prakticky každé vozidlo má inú emisiu znečisťujúcich<br />
látok i v prípade, ak ide o ten istý typ vozidla. Vozidlá sa<br />
môžu <strong>na</strong>vzájom líšiť zaťaženosťou, technikou jazdy, rýchlosťou<br />
a <strong>na</strong>stavením motora. V slovenskej výpočtovej metodike sú všetky<br />
osobné a nákladné vozidlá charakterizované jediným priemerným<br />
emisným faktorom EMO a EMN.<br />
where PO, PN – the number of passenger cars and/or trucks in the<br />
period T; EMO, EMN are emission factors for passenger cars<br />
and/or trucks in [mg.m 1 ]. S is the road width in m.<br />
Although we can determine the PO and PN with high accuracy,<br />
it is practically impossible to determine the exact emission<br />
factors for EMO and EMN. We can assume that every vehicle has<br />
got different emissions of pollutants, even if these are the vehicles<br />
of the same type. Vehicles can differ in load, driving technique,<br />
speed and engine setting. In the Slovak calculation methodology,<br />
every passenger car and every truck is characterized by the only<br />
one average emission factor EMO and EMN.<br />
6. Využitie modelu v praxi<br />
Ako príklad uvádzame modelovanie znečistenia ovzdušia od<br />
<strong>dopravy</strong> v meste Žili<strong>na</strong>.<br />
Mesto Žili<strong>na</strong> má rozlohu 8 652 ha a 88 tisíc obyvateľov [2].<br />
Okres Žili<strong>na</strong> má hustotu cestnej siete 0,378 km/km 2 , resp. 2 km/<br />
1000 obyvateľov podľa údajov Slovenskej správy ciest – Cestnej<br />
databanky.<br />
Základný komunikačný systém mesta je radiálno-okružný. Je<br />
vytvorený z 3 mestských okruhov, radiály tvoria cesty I. a II. triedy<br />
a mestské komunikácie.<br />
Matematické modelovanie je vyko<strong>na</strong>né <strong>na</strong> základe dopravnej<br />
prognózy pre sledované územie mesta. Prognóza súčasného stavu<br />
vychádza z celoštátneho sčítania <strong>dopravy</strong> v roku 1995 a 2000.<br />
Ďalšie údaje o intenzite <strong>dopravy</strong> sú prevzaté z dopravno-inžinierskych<br />
podkladov, ktoré sa spracovávali v rámci prípravy trasy diaľnice<br />
D1 a D18 v okolí Žiliny [3]. Hodnoty intenzít pre rok 2015<br />
sú odvodené prepočtom hodnôt získaných z celoštátneho sčítania<br />
<strong>dopravy</strong> pomocou výhľadových koeficientov.<br />
Študované územie komunikačného systému mesta bolo rozdelené<br />
<strong>na</strong> sieť bodov so vzájomnou vzdialenosťou 100 m, pre ktoré<br />
boli modelované koncentrácie oxidov dusíka.<br />
Predpoklady a neurčitosti modelového výpočtu<br />
● priemerná rýchlosť dopravného prúdu v meste bola uvažovaná<br />
50 km/h,<br />
● uvažované špecifické emisie automobilov sú uvedené v tab. 2,<br />
● priemerná častosť smerov vetra bola dlhodobo sledovaná <strong>na</strong><br />
letisku v Dolnom Hričove, priemerná rýchlosť vetra je určená<br />
zo všetkých meraní vrátane bezvetria a je uvedená v tab. 3,<br />
6. Utilisation of the Model in Practice<br />
As an example, the modeling of the air pollution caused by<br />
the traffic in the city of Žili<strong>na</strong> is presented.<br />
The area of Žili<strong>na</strong> is 8,652 ha and the city has got 88,000<br />
inhabitants [2]. Road density of the Žili<strong>na</strong> district is 0.378 km/h 2 ,<br />
or 2 km/1000 inhabitants according to the data from the Slovak<br />
Road Administration – the Road Databank.<br />
The basic road network of the city is a radial-circular one. It<br />
is made of 3 urban circles; the radials are the I. and II. class roads<br />
and urban communications.<br />
Mathematical modeling is done on the basis of a traffic prognosis<br />
for the monitored area. The prognosis of the present state is<br />
based on the <strong>na</strong>tio<strong>na</strong>l traffic census from 1995 and 2000. Further<br />
data on traffic volume are taken from traffic-engineering materials,<br />
which have been processed for the project of the D1 and D18<br />
highway around Žili<strong>na</strong>. The values for traffic volume for 2015 are<br />
derived from the conversion of the values obtained in the <strong>na</strong>tio<strong>na</strong>l<br />
traffic census using the prognosis coefficients.<br />
The communication system of the city was fitted to a grid<br />
with the point interval of 100 m, where concentrations of nitrogen<br />
oxides were modeled.<br />
Assumptions and Indefinite Aspects of the Model Calculation<br />
● Average speed of the traffic flow in the town was considered to<br />
be 50 km/h,<br />
● Considered specific vehicle emissions are given in Table 2,<br />
● Average frequency of wind direction was used from long term<br />
monitoring in the Dolný Hričov airport, average wind velocity<br />
is estimated from all the measurements, including doldrums and<br />
it is presented in Table 3.<br />
Špecifické emisie automobilov Tab. 2<br />
Emisný faktor [g.km 1 ]<br />
v<br />
Rok CO NO [km.h 1 ]<br />
x<br />
os. <strong>na</strong>kl. os. <strong>na</strong>kl.<br />
2000<br />
2015<br />
50 17,0 13,0 1,5 9,0<br />
80 8,0 7,0 1,8 8,0<br />
50 3,7 6,6 0,7 7,3<br />
80 2,2 2,8 0,9 6,8<br />
Specific vehicle emissions Table 2<br />
Emission factor<br />
v<br />
Year CO NO [km.h 1 ]<br />
x<br />
passanger car truck passanger car truck<br />
2000<br />
2015<br />
50 17.0 13.0 1.5 9.0<br />
80 8.0 7.0 1.8 8.0<br />
50 3.7 6.6 0.7 7.3<br />
80 2.2 2.8 0.9 6.8<br />
KOMUNIKÁCIE / COMMUNICATIONS 1/2003 ●<br />
13
C O M M U N I C A T I O N S<br />
I S<br />
Priemerná častosť smerov vetrov za rok v % Tab. 3<br />
Stanica S SV V JV J JZ Z SZ Rých. vetra<br />
Dolný Hričov 14,9 10,4 9,7 11,1 13,4 13,9 13,1 13,5 0,9 m/s<br />
Očakávané vplyvy <strong>dopravy</strong> v meste<br />
Pri modelovaní znečistenia ovzdušia boli posudzované množstvá<br />
celkovej produkcie znečisťujúcich látok do ovzdušia (t/rok)<br />
od celodennej 24-hodinovej <strong>dopravy</strong>, taktiež boli porovnávané koncentrácie<br />
oxidov dusíka NO x (g/m 3 ) <strong>na</strong> jednotlivých <strong>na</strong>jviac zaťažených<br />
úsekoch komunikačného systému mesta, vznikajúce od<br />
priemernej dennej intenzity <strong>dopravy</strong> a boli porov<strong>na</strong>né s prípustnou<br />
priemernou dennou koncentráciou NO x , ktorá je 100 g/m 3 .<br />
Na základe matematického modelovania [8] pre roky 2000<br />
a 2015 bolo, zistené, že v meste Žili<strong>na</strong> sa od <strong>automobilovej</strong> <strong>dopravy</strong><br />
pre rok 2000 vyprodukovalo v priemere 660,01 kg NO x za deň, čo je<br />
v prepočte 240 t/rok. Z toho 132,9 t/rok (55 %) vyprodukovala osobná<br />
doprava. Pre rok 2015 sa predpokladá, že automobilová doprava<br />
vyprodukuje 575,45kg NO x za deň, čo je v prepočte 210 t/rok.<br />
Z toho 107 t/rok (51 %) vyprodukuje osobná doprava. Maximál<strong>na</strong><br />
predpokladaná denná koncentrácia NO x v roku 2015 by po dobudovaní<br />
plánovaných komunikácií nemala prekročiť 15 g/m 3 .<br />
Average frequency of wind direction in one year [%] Table 3<br />
Station N NE E SE S SW W NW Wind veloc.<br />
Dolný Hričov 14.9 10.4 9.7 11.1 13.4 13.9 13.1 13.5 0.9 m/s<br />
Expected Effects of the Traffic in the City<br />
In the air pollution modeling, the amounts of the total production<br />
of pollutants into the air (t/year) were evaluated as based<br />
on the all-day long 24-hour traffic, and concentrations of nitrogen<br />
oxides NO x (g/m 3 ) at the sections with the highest traffic<br />
volumes that origi<strong>na</strong>te from the average daily traffic were compared<br />
and these were compared to the permitted daily concentration of<br />
NOx, which is 100 g/m 3 .<br />
Based on the mathematical modeling [8] for 2000 and 2015,<br />
it was found out that in the city of Žili<strong>na</strong> the traffic produced<br />
660.01 kg of NO x per day in 2000, equal to 240 t/year. Out of this<br />
volume 132.9 t/year (55 %) was produced by individual traffic. In<br />
2015 it is expected that vehicles will produce 575.45 kg of NO x per<br />
day, what equals to 210 t/year. Out of this volume 107 t/year (51 %)<br />
will be produced by individual traffic. Maximal assumed daily<br />
concentration of NO x in 2015 after the planned communications<br />
are constructed should not exceed 15 g/m 3 .<br />
Obr. 15 Znázornenie priemernej dennej koncentrácie NO x<br />
v meste Žili<strong>na</strong> pre rok 2000<br />
Fig. 15 Average daily concentrations of NO x in Žili<strong>na</strong> in 2000<br />
Obr. 16 Znázornenie priemernej dennej koncentrácie NO x<br />
v meste Žili<strong>na</strong> pre rok 2015<br />
Fig. 16 Average daily concentrations of NO x in Žili<strong>na</strong> in 2015<br />
7. Záver<br />
Ukážkou výsledkov pomocou matematického modelu chceme<br />
<strong>na</strong>z<strong>na</strong>čiť široké možnosti využitia.<br />
V príspevku nie je priestor <strong>na</strong> prezentovanie celej šírky získaných<br />
údajov z alter<strong>na</strong>tívnych riešení modelu.<br />
Kvalita a čistota ovzdušia sa stali vážnym problémom pri <strong>na</strong>vrhovaní<br />
dopravných sietí v regiónoch i mimo nich, pri organizovaní<br />
<strong>dopravy</strong> aj územnom plánovaní.<br />
7. Conclusion<br />
The demonstration of the results obtained through the mathematical<br />
model is meant to indicate a wide range of its utilization.<br />
The length of the article does not allow us to present the whole<br />
scope of the data acquired from alter<strong>na</strong>tive model solutions.<br />
Quality and cleanliness of the air have become a serious<br />
problem in projecting transport networks within and beyond regions,<br />
in transport organization and territorial planning.<br />
14 ● KOMUNIKÁCIE / COMMUNICATIONS 1/2003
C O M M U N I C A T I O N S<br />
I S<br />
Metódy matematického modelovania v súlade s dopravnými<br />
prognózami sú veľmi účinným nástrojom v tomto procese a v procese<br />
hodnotenia vplyvov <strong>na</strong> životné prostredie.<br />
Imisná štúdia by preto mala byť súčasťou nielen projektovej<br />
dokumentácie cestných komunikácií <strong>na</strong> úrovni variantného rozhodovania<br />
o výbere vhodného umiestnenia cestných ťahov, ale aj<br />
neoddeliteľnou súčasťou rozhodovacích procesov <strong>na</strong> úrovni regionálneho<br />
riešenia dopravných problémov. Aby splnila svoj účel, mala<br />
by obsahovať modelovanie tvorby imisií z <strong>automobilovej</strong> <strong>dopravy</strong><br />
v takom rozsahu, aby bolo možné porovnávať rôzne varianty riešenia<br />
a posúdiť prínosy alebo riziká, ktoré do regiónu prinesú.<br />
Methods of mathematical modeling, in accordance with traffic<br />
prognoses, are a very effective tool in this process and in the<br />
process of evaluation of the effects on the environment.<br />
An emission study should therefore form a part not only of<br />
a road project documentation at the level of variant decision-making<br />
about choosing a suitable location for road routes, but it should also<br />
be an inseparable part of a decision-making processes at the level<br />
of finding regio<strong>na</strong>l solution for problems with traffic. In order to<br />
achieve this aim, the study should comprise a model of emission<br />
production coming from automobile traffic to such extent that it<br />
would be possible to compare various alter<strong>na</strong>tives to the solution<br />
and to evaluate the benefits or the risks brought about into the<br />
region.<br />
Literatúra – References<br />
[1] ČERNÝ, M.: Projekt európskych diaľnic AIMSE (Project of European highways AIMSE). Silniční obzor 1/1996<br />
[2] Životné prostredie v Slovenskej republike, vybrané ukazovatele v rokoch 1996 – 2000 (The Environment in the Slovak Republic, Selected<br />
Indicators in 1996 - 2000), ŠÚ SR 2000<br />
[3] Merkblatt über Lufgverunreinigungen an Strassen, Teil: Strassen ohne oder mit lockerer Randbebauung, MluS-92, Köln, 1996<br />
[4] HESSEK, F.: Metodika výpočtu automobilového znečistenia ovzdušia (The method of road traffic air pollution calculation), SAV Bratislava<br />
1993<br />
[5] PISCHINGER, R.: Auswirkungen von “Tempo – 30” auf die Kfz – Abgasemissionen in Graz, Eigenverlag Graz, 1991<br />
[6] ĎURČANSKÁ, D., HESSEK, F.: Matematické modelovanie <strong>vplyvu</strong> diaľnice <strong>na</strong> znečistenie (Mathematical Modelling of the Highway<br />
Influence to Air Pollution), Komunikácie/Communications, vedecké listy ŽU, 4/2000, page 69 – 78<br />
[7] HOLLAREK, T.: Posúdenie širších dopravných vzťahov diaľničných pripojení D1 a D18 v rámci žilinského regiónu (Assessment of<br />
broader transport relationships of D1 and D18 highway connections in the Žili<strong>na</strong> region), Enviconsult Žili<strong>na</strong>, 1996<br />
[8] HALABUK, M.: Modelovanie znečistenia ovzdušia od <strong>automobilovej</strong> <strong>dopravy</strong>, diplomová práca (Modeling of air pollution caused by road<br />
traffic, Thesis), University of Žili<strong>na</strong> 2002<br />
[9] SZABÓ, G.: Dispersion Model of Air Pollutants from Line Sources, Meteorological Jour<strong>na</strong>l, 4/2001ISSN 1335-33X, p. 23-32<br />
[10] http://www.lakes-environmental.com/lakeepa1.html, 2003-01-08<br />
KOMUNIKÁCIE / COMMUNICATIONS 1/2003 ●<br />
15
C O M M U N I C A T I O N S<br />
I S<br />
Vladimír Hlavňa – Rastislav Isteník *<br />
NIEKTORÉ PROBLÉMY KONŠTRUKCIE A PREVÁDZKY<br />
AUTOMOBILU VO VZŤAHU K ŽIVOTNÉMU PROSTREDIU<br />
POSSIBILITIES OF SOLUTION OF AN AUTOMOBILE DESIGNING AND OPERATION<br />
IN RELATION TO THE ENVIRONMENT<br />
Zaťaženie životného prostredia prevádzkou automobilov nie je<br />
malé. Ak produkcia emisií v ustálených stavoch prevádzky je viac-<br />
-menej úspešne riešená, tak neustálené režimy prevádzky spôsobujú<br />
podstatne väčšie zaťaženie životného prostredia. Ide <strong>na</strong>jmä o štart<br />
motora a rozbeh automobilu. V príspevku je a<strong>na</strong>lyzovaný rozbeh automobilu<br />
a sú uvedené niektoré cesty znižovania zaťaženia životného<br />
prostredia počas jeho rozbehu.<br />
The impact on the environment caused by operation of automobiles<br />
is obvious. Although production of emissions in steady-state operations<br />
is more or less successfully solved, unsteady operatio<strong>na</strong>l modes<br />
result in a substantially greater impact on the environment. They are,<br />
in particular, an engine start and an automobile start up. The article<br />
deals with an a<strong>na</strong>lysis of an automobile start up and offers some ways<br />
of reducing the impact on the environment during the start up.<br />
1. Úvod<br />
Zme<strong>na</strong> životného prostredia je považovaná za prírodný proces,<br />
pretože všetky organizmy svojou existenciou menia svoje okolie.<br />
Človek má však veľkú schopnosť meniť okolie v krátkom čase.<br />
Veľa iných organizmov už nemá potom šancu prispôsobiť sa týmto<br />
novým životným podmienkam a aj sám človek má niekedy s týmto<br />
prispôsobením sa problémy.<br />
Životné prostredie možno charakterizovať ako hmotné okolie<br />
živých organizmov vrátane človeka a zahrňuje základné prírodné<br />
zložky a zdroje – pôdu, ovzdušie, vodu, organizmy, ich spoločenstvá,<br />
ekosystémy a krajinný priestor, vrátane človekom ovplyvnených<br />
častí. Životné prostredie tak predstavuje zložitý komplex ekologických<br />
systémov, v ktorých sa vyvíja a realizuje život.<br />
Doteraz vyvíjal človek svoje aktivity tak, aby uspokojil svoje<br />
potreby. Pritom využíval všetky danosti Zeme, aby rozvíjal hospodárstvo<br />
a priemysel bez ohľadu <strong>na</strong> to, že poškodzoval životné prostredie.<br />
Teraz sa <strong>na</strong>chádzame vo fáze uvedomovania si tejto nepriaznivej<br />
skutočnosti a hľadáme cesty ako ju zmeniť pozitívnym<br />
smerom. Názorne to ukazuje obrázok 1. Každé vnášanie chemických,<br />
biologických a fyzikálnych činiteľov do životného prostredia,<br />
vyvolané ľudskou činnosťou, sa pokladá za jeho zaťaženie – znečistenie<br />
či poškodenie.<br />
V dávnej minulosti v rozhodujúcej miere určovalo životné prostredie<br />
človeku potrebu jeho mobility i vlastnú technickú i technologickú<br />
realizáciu tohto procesu. V súčasnosti je tento vzťah<br />
opačný – spoločenskými, hospodárskymi a ekonomickými podmienkami<br />
vyvolané potreby mobility – vyžadujúce rýchlejšie, čas-<br />
1. Introduction<br />
Any change in the environment is considered a <strong>na</strong>tural process<br />
because all living organisms change their environment due to their<br />
existence. Human beings also have a great ability to change the<br />
surrounds within a short period of time. Then there is not a chance<br />
for many other organisms to accommodate to these new living conditions<br />
and human beings themselves sometimes find it difficult to<br />
get used to changes.<br />
The environment can be characterized as material world surrounding<br />
living organisms including human beings. It includes the<br />
basic <strong>na</strong>tural components and sources – land, air, water, organisms,<br />
their communities, ecosystems and countryside including those<br />
parts which are influenced by human beings. The environment thus<br />
presents a complex of ecologic systems in which life is developed<br />
and realized.<br />
So far human beings have developed their activities in such<br />
a way as to meet their needs. Doing so they have used all the gifts<br />
of the Earth to develop economy and industry paying no attention<br />
to the fact that the environment has been damaged. We are now<br />
at the stage of getting gradually aware of the unfavorable fact and<br />
looking for new ways of changing it positively. Fig. 1 illustrates the<br />
above-mentioned situation. Every entry of chemical, biological,<br />
and physical agents induced by human activity to the environment<br />
can be seen as its loading – pollution or damage.<br />
In the past it was the environment that decisively limited needs<br />
of ancient people for mobility as well as technical and technological<br />
realization of the process. At present the relation is opposite<br />
– social and economic conditions call for mobility – requiring<br />
* prof. Ing. Vladimír Hlavňa, PhD., Ing. Rastislav Isteník, PhD.<br />
SjF Žilinská <strong>univerzita</strong>, Veľký diel, 010 26 Žili<strong>na</strong>, Tel.: ++421-41-5132670, 5132660 Fax: ++421-41-5253016<br />
E-mail: vladimir_hlav<strong>na</strong>@kkvmz.utc.sk, rasto_istenik@kkvmz.utc.sk<br />
16 ● KOMUNIKÁCIE / COMMUNICATIONS 1/2003
C O M M U N I C A T I O N S<br />
I S<br />
tejšie a dlhšie cesty – a k nej nevyhnutná dopravná technika, t. j.<br />
dopravné prostriedky a dopravné cesty, vo veľkej miere ovplyvňujú<br />
životné prostredie človeka. Tým sú prekonávané ekonomické,<br />
sociálne, národnostné, etnické a geografické bariéry. Preto platí aj<br />
v mobilite už <strong>na</strong>stolená otázka: „Ako presmerovať súčasný kruh<br />
<strong>na</strong> ekologický“.<br />
faster, more frequent and longer journeys – and inevitable transportation<br />
technology, i.e. means of transport and routes, which<br />
considerably influence the environment. In this way economic,<br />
social, <strong>na</strong>tio<strong>na</strong>l, ethnic and geographical barriers are overcome.<br />
That is why also in mobility the following question “How to transfer<br />
the present circle to the ecological one” holds.<br />
Ak sa zoberie do úvahy skutočnosť,<br />
že jednou z vlastností, ktorá<br />
je v ľuďoch zakorenená, je s<strong>na</strong>ha<br />
po voľnosti pohybu, t. j. mobilita,<br />
tak jed<strong>na</strong> z možností, ktorou sa<br />
problém presmerovania spomí<strong>na</strong>ného<br />
kruhu môže riešiť je postupné<br />
zvyšovanie efektívnosti energetických<br />
zdrojov (hlavne fosílnych) pri<br />
minimalizácii zaťaženia životného<br />
prostredia uplatnením <strong>na</strong>jnovších<br />
technických a technologických<br />
riešení pri zachovaní primeranosti nákladov.<br />
If we take into consideration<br />
the fact that one of the properties<br />
rooted deeply in human beings is<br />
the desire for freedom of movement,<br />
i.e. mobility, then one of the<br />
possibilities of solving the transformation<br />
of the mentioned circle<br />
will be a gradual increase in efficiency<br />
of energetic sources (mainly<br />
Obr. 1. Súčasný a ekologický kruh<br />
fossils) at minimal impact on the<br />
Fig. 1. Present and ecological circle<br />
environment implementing sophisticated<br />
technical and technological<br />
solutions within reaso<strong>na</strong>ble costs.<br />
Doprava ovplyvňuje životné prostredie v podstate dvojakým<br />
spôsobom:<br />
● pozitívne tým, že účelným premiestňovaním osôb, surovín a tovaru<br />
zabezpečuje potreby spoločnosti i výkon niektorých služieb<br />
a výrazne prispieva k rastu turistiky,<br />
● negatívne tým, že svojou existenciou, t. j. prevádzkou a zariadeniami<br />
ho poškodzuje a znehodnocuje.<br />
Z <strong>dopravy</strong> je v súčasnosti podstatná časť obyvateľstva obťažovaná<br />
<strong>na</strong>jmä výfukovými plynmi a hlukom. Biologické pôsobenie<br />
emisií sa hodnotí z hľadiska:<br />
● toxicity, keď produkované emisie vyvolávajú otravy,<br />
● genetiky, kedy sa pozornosť venuje látkam s karcinogénnymi<br />
a mutagénnymi účinkami,<br />
● ekológie, sledujúce biotické a abiotické faktory. Z tohto hľadiska<br />
veľké nebezpečenstvo predstavujú nespálené resp. odparené<br />
uhľovodíky a oxidy dusíka.<br />
Za účelom zníženia rizika biologického pôsobenia emisií výfukových<br />
plynov dochádza k sprísňovaniu predpisov povolenej produkcie<br />
emisií pre výrobcov i užívateľov – pozri tabuľku 1. Výfukové<br />
plyny vznetových motorov sú pre ľudí zaraďované ako látky pravdepodobne<br />
karcinogénne a výfukové plyny zážihových motorov sú<br />
možno karcinogénne.<br />
Z obrázka 2 (štatistické údaje) a tabuľky 2 vyplýva, že životné<br />
prostredie <strong>na</strong>jviac zaťažuje cestná – automobilová doprava. Podiel<br />
železničnej a leteckej <strong>dopravy</strong> <strong>na</strong> zaťažení životného prostredia je<br />
približne rov<strong>na</strong>ký, ale oveľa menší ako <strong>automobilovej</strong>. Vplyv vodnej<br />
<strong>dopravy</strong> vychádza zanedbateľný. Avšak, porov<strong>na</strong>nie jednotlivých<br />
odvetví dopráv je problematické a závisí od voľby kritérií.<br />
Množstvo emitovaných škodlivín vo výfukových plynoch spaľovacích<br />
motorov závisí aj od množstva spotrebovaného paliva. So<br />
znižujúcou sa celkovou spotrebou paliva – obrázok 3 – sa znižuje<br />
aj produkcia škodlivých emisií.<br />
Transportation, in fact, influences the environment in two<br />
ways:<br />
● In a positive way – thanks to its purposeful displacement of people,<br />
raw materials and goods it realizes needs of society and some services<br />
and considerably contributes to the growth of tourism,<br />
● In a negative way – due to its existence, i.e. by means of its operation<br />
and equipment it damages and deteriorates the environment.<br />
Present negative impacts of transportation on majority of population<br />
are mostly emissions and noise. Biological impact of emissions<br />
can be approached from the following points of view:<br />
● toxicity, when produced emissions result in poisons,<br />
● genetics, when attention is paid to substances featuring carcinogen<br />
and mutagen effects,<br />
● ecology, focusing on biotic and abiotic factors. From this point<br />
of view great potential danger is represented by unburned or<br />
evaporated carbon dioxides and nitrogen oxides.<br />
In order to reduce risks of biological impact of exhaust emissions<br />
there are more strict limits on allowable production of emission<br />
imposed on both manufacturers and users – see Table 1.<br />
Diesel engines emissions are referred to as substances probably<br />
carcinogen for people and spark ignition engines emissions maybe<br />
carcinogen.<br />
Referring to Fig. 2 (statistical data) and Table 2 we can see<br />
that road – automobile transport has the greatest negative impact<br />
on the environment. The share of railway and air transport is relatively<br />
similar but considerably lower that the share of automobile<br />
transport. The share of water transport is negligible. Though, the<br />
comparison of individual branches of types of transport is problematic<br />
and depends on the choice of criteria.<br />
Amount of emitted pollutants in emissions of combustion<br />
engines also depends on amount of consumed fuel. With a decreasing<br />
total amount of fuel – Fig. 3 – there is also a decrease in production<br />
of harmful emissions.<br />
KOMUNIKÁCIE / COMMUNICATIONS 1/2003 ●<br />
17
C O M M U N I C A T I O N S<br />
I S<br />
Vývoj podielu karcinogénnych látok pre vznetové motory Tab. 1 Share of carcinogen substances for diesel engines Table 1<br />
Vznetový<br />
Zážihový motor bez<br />
EURO I EURO II EURO III<br />
motor<br />
a s katalyzátorom.<br />
100 % 60 % 30 % 15 % 20 – 4 %<br />
Spark ignition engine<br />
Diesel<br />
EURO I EURO II EURO III without and with<br />
engine<br />
a catalytic converter<br />
100 % 60 % 30 % 15 % 20 – 4 %<br />
Relatívne porov<strong>na</strong>nie <strong>vplyvu</strong> emisií jednotlivých druhov <strong>dopravy</strong> Tab. 2<br />
Emisie<br />
Doprava<br />
CO CO 2 HC SO 2 NO x PM Pb Hluk Vibrácie<br />
Spolu<br />
Cestná – osobné automobily 3 1 2 3 1 2 1 13<br />
Cestná – úžitkové vozidlá 1 1 3 3 3 3 14<br />
Železničná1 1 1 2 1 6<br />
Vodná 1 1 1 3<br />
Letecká1 1 1 3 6<br />
Relative comparison of influence of emissions of different types of transport Table 2<br />
Emissions<br />
Transport<br />
CO CO 2 HC SO 2 NO x PM Pb Noise Vibrations<br />
Total<br />
Road – passenger cars 3 1 2 3 1 2 1 13<br />
Road – utility vehicles 1 1 3 3 3 3 14<br />
Railway 1 1 1 2 1 6<br />
Water 1 1 1 3<br />
Air 1 1 1 3 6<br />
Obr. 2. Podiel vyprodukovaných emisií jednotlivých dopráv v SR roku 2001<br />
Fig. 2. Share of emissions of types of transport in the Slovak Republic in 2001<br />
18 ● KOMUNIKÁCIE / COMMUNICATIONS 1/2003
C O M M U N I C A T I O N S<br />
I S<br />
Obr. 3. Orientačne - vývoj spotreby paliva cestných európskych vozidiel so zážihovým motorom (ECE)<br />
Fig. 3. Development of fuel consumption for road European spark ignition engines (ECE)<br />
2. Možnosti znižovania zaťaženia životného prostredia<br />
prevádzkou automobilov<br />
Nosné smery v znižovaní zaťaženia životného prostredia prevádzkou<br />
automobilov všeobecne spočívajú v:<br />
● technických riešeniach v konštrukcii<br />
i v prevádzke,<br />
● technologických riešeniach v konštrukcii<br />
a prevádzke,<br />
● systémových opatreniach v organizácii<br />
a riadení prevádzky automobilov,<br />
● legislatívnych, ekonomických<br />
a osvetových opatreniach.<br />
2. Possibilities of reducing negative impact on the<br />
environment caused by automobile operation<br />
Main trends in reducing negative impact on the environment<br />
caused by automobile operation generally lie in:<br />
● Technical solutions in designing<br />
and operation,<br />
● Technological solutions in designing<br />
and operation,<br />
● System measures in organization<br />
and ma<strong>na</strong>gement of automobile<br />
operation,<br />
● Legislative, economic and cultural<br />
measures.<br />
Nielen tlak legislatívy – obrázky<br />
4 a 5, ale aj vzťah k životnému<br />
prostrediu vynucuje riešiť problém<br />
ekologičnosti a hospodárnosti automobilov<br />
technickými a technologickými<br />
riešeniami. Čo umožnili niektoré<br />
takéto opatrenia je ukázané <strong>na</strong> obrázku 6.<br />
Obr. 4. Vývoj medzných hodnôt emisií pevných častíc pre osobné<br />
a nákladné automobily so vznetovým motorom<br />
Fig. 4. Development of limit values of solid particles for passenger<br />
and goods vehicles with diesel engines<br />
It is not only legislation – Fig. 4<br />
and 5 – but also the relation to the<br />
environment that forces us to<br />
solve issues of automobile ecology<br />
and economy by means of technical<br />
and technological solutions. What<br />
has been achieved implementing some of the mentioned measures<br />
can be seen in Fig. 6.<br />
Obr. 5. vľavo: Vývoj medzných hodnôt emisií v g.km 1 pre ľahké nákladné<br />
automobily so vznetovým motorom (test ECEEUDC); vpravo: Vývoj<br />
medzných hodnôt emisií v g.kW 1 h 1 pre ťažké nákladné automobily<br />
so vznetovým motorom (test ECE R49)<br />
Fig. 5. left: Development of limit values of emissions in g.km 1 for light trucks<br />
with diesel engines (test ECEEUDC); right: Development of limit values<br />
of emissions in g.kW 1 h 1 for heavy duty trucks with diesel engines<br />
(test ECE R49)<br />
Obr. 6. Vývoj mernej spotreby paliva pre rôzne<br />
spaľovacie motory v g.kW 1 h 1<br />
Fig. 6. Development of specific fuel consumption for<br />
different combustion engines in g.kW 1 h 1<br />
KOMUNIKÁCIE / COMMUNICATIONS 1/2003 ●<br />
19
C O M M U N I C A T I O N S<br />
I S<br />
3. Simulácia rozbehu vozidla so spaľovacím motorom<br />
V tejto časti je <strong>na</strong> základe numerickej simulácie posúdený vplyv<br />
zmeny tvaru momentovej krivky motora v jeho rýchlostnej charakteristike<br />
<strong>na</strong> niektoré parametre vozidla počas jeho rozbehu. Táto<br />
zme<strong>na</strong> bola dosiahnutá uplatnením ventilového rozvodu s variabilným<br />
časovaním. Posudzovanie (dy<strong>na</strong>mických vlastností vozidla) sa<br />
obyčajne vyjadruje v charakteristikách rozbehu a dobehu vozidla.<br />
Uvedené parametre následne úzko súvisia s hospodárnosťou a zaťažovaním<br />
životného prostredia prevádzkou automobilu. Prechodový<br />
režim motora počas rozbehu vozidla nie je definovaný iba zvyšovaním<br />
jeho otáčok a zaťaženia. Z pohľadu zaťaženia životného<br />
prostredia výfukovými plynmi sú veľmi výz<strong>na</strong>mné časové úseky<br />
v období preraďovania rýchlostných stupňov. Ako jedno z kritérií<br />
hodnotenia môže byť čas potrebný <strong>na</strong> dosiahnutie danej rýchlosti<br />
vozidla, resp. čas potrebný <strong>na</strong> dosiahnutie potrebnej dráhy.<br />
Definovanie problému<br />
Uplatnením ventilového rozvodu s variabilným časovaním<br />
(VT – variable timing), <strong>na</strong>príklad hydraulicky ovládaného rozvodu<br />
VARROZ – KKVMZ, je možné optimalizovať činnosť motora<br />
v širokom rozsahu pracovných otáčok. Takýto rozvod umožňuje<br />
priamo ovplyvňovať <strong>na</strong>príklad tvar momentovej krivky v otáčkovej<br />
charakteristike motora. Zme<strong>na</strong> tvaru momentovej krivky a tiež<br />
absolútnych hodnôt dosahovaného momentu ovplyvňuje jazdné<br />
vlastnosti vozidla. Pri súčasnom rozvoji <strong>dopravy</strong> <strong>na</strong>stáva <strong>na</strong>jmä vo<br />
väčších mestách problém so zvládnutím dopravnej situácie <strong>na</strong> preplnených<br />
cestných komunikáciách a križovatkách. Na vozidlo sú<br />
teda kladené čoraz väčšie nároky <strong>na</strong> dosahovanie vysokých zrýchlení<br />
pri rozjazdoch v križovatkách a v neposlednom rade aj pri<br />
predchádzaní iných vozidiel, čo má priamu <strong>na</strong>dväznosť <strong>na</strong> bezpečnosť<br />
posádky.<br />
Cieľom je <strong>na</strong> základe numerickej simulácie posúdiť vplyv zmien<br />
tvaru momentovej krivky otáčkovej charakteristiky (dosiahnutých<br />
pomocou variabilného časovania rozvodu) <strong>na</strong> niektoré vybrané<br />
veličiny pri rozjazde vozidla.<br />
Štandardné vstupné parametre približne zodpovedajú vozidlu<br />
Škoda Felicia 1,3MPI. Parametre potrebné pre výpočet, ktoré nie sú<br />
uvádzané výrobcom, resp. neboli k dispozícii ani z iných zdrojov,<br />
boli odhadnuté. Výpočtový model zohľadňuje odpor valenia kolies<br />
po vozovke, odpor vzduchu a odpor<br />
zo stúpania. Tvary momentových<br />
kriviek vonkajšej otáčkovej charakteristiky<br />
(VOCH) dosiahnutých variabilným<br />
časovaním rozvodu motora<br />
(obrázok 7) boli zvolené ako<br />
extrémne prípady, aby boli vo výsledkoch<br />
dobre viditeľné rozdiely<br />
medzi jednotlivými prípadmi.<br />
3. Simuation of start up of the vehicle with<br />
a combustion engine<br />
In this part we examine the influence of a torque curve shape<br />
in the speed engine characteristic on some vehicle properties during<br />
its start up. This shape change was achieved by an application of<br />
the valve gear with variable timing in the vehicle. The evaluation<br />
(of dy<strong>na</strong>mic characteristics) is usually expressed in characteristics<br />
of the vehicle start up. The mentioned parameters consequently<br />
closely relate to economy and pollution of the environment due to<br />
operation of the vehicle. The unsteady operatio<strong>na</strong>l mode of the<br />
engine during the vehicle start up is not defined only by increase<br />
in its speed and loading. From the point of view of the pollution of<br />
the environment caused by exhaust emissions are highly important<br />
time intervals between the gear ratio changes. One criterion for<br />
the evaluation can be time needed for achieving the given speed of<br />
vehicle or time needed for covering the necessary distance.<br />
Problem defining<br />
The engine operation optimization in a wide range of rotatio<strong>na</strong>l<br />
speed interval may be realized by application of the valve gear with<br />
a variable timing, for instance hydraulically controlled valve gear<br />
VARROZ – KKVMZ. This valve gear allows a direct affecting of<br />
the torque curve shape in the engine speed characteristic. A change<br />
of the torque curve shape as well as a change of absolute values of<br />
the achieved torque has influence on the vehicle driving properties.<br />
The present expansion of transportation induces, mostly in<br />
large towns, some problems resulting from i<strong>na</strong>bility to cope with<br />
situations on crowded roads and crossroads. There are more requirements<br />
put on a modern vehicle, <strong>na</strong>mely to achieve high accelerations<br />
during start-ups at crossroads and, last but not least, during<br />
overtaking which is closely related with safety of passengers.<br />
One objective is to evaluate – on the basis of a numeric simulation<br />
– influence of the torque curve shape change (achieved by<br />
means of variable timing of the valve gear) on some chosen parameters<br />
during the vehicle start-up.<br />
The standard input parameters are similar to those of the<br />
Škoda Felicia 1.3MPI vehicle. The parameters needed for the calculation<br />
but either not provided by the manufacturer or otherwise<br />
unfeasible, were estimated. The computatio<strong>na</strong>l model considers<br />
resistance of the wheel rolling on<br />
the roadway, air drag and elevation<br />
resistance. Shapes of the speed<br />
characteristic curves (VOCH)<br />
achieved by the valve gear variable<br />
timing (Fig. 7) were chosen as extreme<br />
cases so that the distinctions<br />
among individual cases would be<br />
clearly seen.<br />
Prípad 1,3MPI zodpovedá reálnej<br />
<strong>na</strong>meranej vonkajšej otáčkovej<br />
charakteristike motora. Krivka<br />
VTnMax platí pre prípad motora<br />
<strong>na</strong>ladeného <strong>na</strong> maximálne otáčky.<br />
Obr. 7. Momentové krivky vonkajšej otáčkovej charakteristiky<br />
motora pre simuláciu<br />
Fig. 7. Considered torque curves of outer engine speed<br />
characteristic for simulation<br />
The case of the engine 1.3MPI<br />
corresponds to a real measured<br />
engine speed characteristic. The<br />
curve VTnMax holds for a case<br />
when the engine is tuned on the<br />
20 ● KOMUNIKÁCIE / COMMUNICATIONS 1/2003
C O M M U N I C A T I O N S<br />
I S<br />
Krivka VTnMin zodpovedá motoru s časovaním rozvodu <strong>na</strong>ladeným<br />
<strong>na</strong> otáčky minimálne. Krivka oz<strong>na</strong>čená VTmax odhadovo<br />
zodpovedá ideálnemu stavu, dosiahnutému aplikovaním variabilného<br />
časovania pre uvažovaný motor 1.3MPI. Tento ideálny stav môže<br />
dosiahnuť regulovaný systém rozvodu s variabilným časovaním,<br />
ovládaný počítačom. Parametre riadenia rozvodu určuje počítač<br />
priebežne podľa aktuálneho stavu motora (otáčky, záťaž, teploty…),<br />
<strong>na</strong>príklad pri nízkych otáčkach zabezpečí parametre zodpovedajúce<br />
krivke VTnMin a pri vysokých otáčkach zabezpečí <strong>na</strong>stavenie<br />
prislúchajúce krivke VTnMax.<br />
Výpočtový model vozidla so spaľovacím motorom<br />
Model rozjazdu vozidla je do istej miery zjednodušený. Pri<br />
definovaní valivého odporu je zanedbaná vztlaková sila vznikajúca<br />
v dôsledku prúdenia vzduchu okolo vozidla. Tiež je zanedbané, že<br />
vektor výslednice sily odporu vzduchu nepôsobí presne vo výške<br />
ťažiska vozidla, čo môže v skutočnosti spôsobiť moment spôsobujúci<br />
zmeny v hodnotách prítlačných síl jednotlivých kolies.<br />
Špeciálne je <strong>na</strong>modelovaná činnosť spojky pri štarte vozidla.<br />
Vo výpočte sa uvažuje, že vodič pri rozbehu udržuje plynový pedál<br />
v polohe maximálneho stlačenia (t. j. motor pracuje v režime <strong>na</strong><br />
vonkajšej charakteristike) a spojku ovláda tak, že udržiava motor<br />
<strong>na</strong> konštantných otáčkach 3500 min 1 až do okamihu úplného<br />
spojenia kľukového hriadeľa s hriadeľom prevodovky. Stratový výkon<br />
premieňaný <strong>na</strong> teplo, vznikajúci v spojke v dôsledku rozdielnych<br />
uhlových rýchlostí kľukového hriadeľa a vstupného hriadeľa prevodovky<br />
(prešmykovanie) postupne klesá a nulovú hodnotu <strong>na</strong>dobúda<br />
v okamihu spojenia spojky, ktoré <strong>na</strong>stane, keď vozidlo dosiahne<br />
rýchlosť zodpovedajúcu uvažovaným otáčkam motora 3500 min 1 .<br />
maximal rotatio<strong>na</strong>l speed. The curve VTnMin holds for an engine<br />
which is tuned on the minimal rotatio<strong>na</strong>l speed. The curve VTmax<br />
responds to an absolutely ideal case achieved by the valve gear variable<br />
timing for the considered combustion engine 1.3MPI. This<br />
ideal state may be achieved, for instance, by the variable timing system<br />
with a computer regulation. The computer determines parameters<br />
of regulation on the basis of a real engine state (rotatio<strong>na</strong>l<br />
speed, load, temperatures…), for instance, in the area of low RPM<br />
the computer provides parameters responding to the curve VTnMin<br />
and, on the other hand, in the area of high RPM it provides parameters<br />
responding to the curve VTnMax. The result is the curve<br />
VTmax.<br />
The computatio<strong>na</strong>l model of a vehicle with combustion engine<br />
The model of a vehicle start up is to a certain extent simplified.<br />
On defining the roll resistance the uplift force resulting from air<br />
streaming along the vehicle is neglected. Another neglected thing<br />
is that the vector of the resultant force of air drag is not acting in<br />
the gravity center height, which may, in fact, induce a moment<br />
causing changes in values of compressive forces of individual<br />
wheels.<br />
The function of the clutch during the vehicle start up is specially<br />
modeled. In the computation the driver is considered to maintain<br />
the accelerator pedal in the maximal position, (i.e. the engine<br />
works on the outer speed characteristics) and to control the clutch<br />
so that the engine has a constant rotatio<strong>na</strong>l speed of 3500 min 1<br />
until the clutch joins the crankshaft with the gearbox shaft. Power<br />
losses in the clutch (due to different angle speeds of the crankshaft<br />
and input gearbox shaft) are transformed into heat and gradually<br />
decrease. They achieve the zero value at the moment when<br />
the clutch joins, which is when the vehicle achieves the velocity<br />
corresponding to the engine speed of 3500 min 1 .<br />
a) všeobecná poloha vozidla<br />
a) general vehicle position<br />
b) vodorovná poloha (a<strong>na</strong>lyzovaná)<br />
b) a<strong>na</strong>lyzed horizontal position<br />
Obr. 8. Výpočtové polohy vozidla<br />
Fig. 8. The vehicle positions for calculation<br />
Základné vstupné parametre a niektoré definičné vzťahy:<br />
Celková hmotnosť vozidla m AUTA 1065 kg, prevodové pomery<br />
i stály 3,833333333, i 1 3,461538462; i 2 1,956521739; i 3 <br />
1,310344828; i 4 0,975; i 5 0,755555556; polomer kolesa<br />
0,262 m (vzdialenosť osi od vozovky); čas <strong>na</strong> preradenie prevodového<br />
stupňa T radenia 0,4 s; mechanická účinnosť prenosu výkonu<br />
z motora <strong>na</strong> kolesá mp 0,93; merná hmotnosť vzduchu vz <br />
The basic input parameters and some definition formulas:<br />
The total vehicle mass m AUTA 1065 kg, gear ratios i stály <br />
3.833333333, i 1 3.461538462; i 2 1.956521739; i 3 <br />
1.310344828; i 4 0.975; i 5 0.755555556; wheel radius<br />
0.262 m (distance of center from the roadway); time of gear ratio<br />
shift T radenia 0.4 s; mechanical efficiency of mechanism from<br />
engine to wheels mp 0,93; specific air mass vz 1.16 kg.m 3 ;<br />
KOMUNIKÁCIE / COMMUNICATIONS 1/2003 ●<br />
21
C O M M U N I C A T I O N S<br />
I S<br />
1,16 kg.m 3 ; súčiniteľ odporu vzduchu c x 0,35; čelná plocha<br />
vozidla 1,94 m 2 ; súčiniteľ valivého odporu pri malej rýchlosti f val0 <br />
0,01; začiatočné otáčky motora n Mstart 3500 min 1 ; otáčky<br />
motora po spojení spojky n min 3500 min 1 , otáčky motora pri<br />
preradení <strong>na</strong> vyšší stupeň n Mprerad 5500 min 1 .<br />
Hodnota rýchlosti vozidla pri spojení spojky počas rozjazdu:<br />
nmin<br />
v min r kolesa 2 .<br />
ist aly<br />
i 1<br />
Súčiniteľ valivého odporu závislý od rýchlosti:<br />
f val f val0 (1 4 10 5 v 2 ), kde v je rýchlosť vozidla<br />
v km.h 1 .<br />
Sila odporu valenia<br />
F odpVAL f val m auto g<br />
Sila odporu vzduchu<br />
air drag coefficient c x 0.35; vehicle frontal area 1.94 m 2 ; small<br />
velocity resistance of roll f val0 0.01; initial engine speed n Mstart <br />
3500 min 1 ; engine speed at clutch join n min 3500 min 1 ,<br />
gear shift change rotatio<strong>na</strong>l speed n Mprerad 5500 min 1 .<br />
The vehicle velocity value for the clutch join moment (during<br />
the vehicle start up):<br />
nmin<br />
v min r kolesa 2 <br />
ist <br />
aly<br />
i 1<br />
The roll resistance coefficient dependent on velocity:<br />
f val f val0 (1 4 10 5 v 2 ), where v is velocity of the<br />
vehicle in km.h 1 .<br />
The roll resistance force<br />
F odpVAL f val m auto g<br />
Air drag force<br />
F odpVZ c x S c 1 2 vz v 2 auto<br />
Sila odporu zo stúpania<br />
F stúpania m auta g sin()<br />
Výsledná odporová sila<br />
F odpVZ c x S c 1 2 vz v 2 auto<br />
Elevation resistance<br />
F stúpania m auta g sin()<br />
Resultant resistance force<br />
F odporová F odpVAL F odpVZ F stúpania<br />
Moment <strong>na</strong> kolesách<br />
F odporová F odpVAL F odpVZ F stúpania<br />
Torque on the wheels<br />
M kolesá M motora i celkový mp<br />
H<strong>na</strong>cia sila<br />
F h<strong>na</strong>cia M kolesa<br />
<br />
r k<br />
olesa<br />
Redukovaná hmotnosť rotujúcich hmôt<br />
i kol I 1kol iR 2 I prev icelkový 2 I KH<br />
m ROTred <br />
rk<br />
2<br />
kde i kol – počet kolies vozidla,<br />
I 1kol – moment zotrvačnosti jedného kolesa,<br />
i R – prevodový pomer rozvodovky,<br />
I prev – moment zotrvačnosti výstupného hriadeľa prevodovky,<br />
i celkový – celkový prevodový pomer mechanizmu od motora až<br />
po kolesá,<br />
I KH – moment zotrvačnosti kľukového hriadeľa motora,<br />
vrátane zotrvačníka.<br />
Pohybová rovnica vozidla:<br />
(m AUTA M ROTred ) d2 x(<br />
t)<br />
2<br />
F<br />
dt<br />
h<strong>na</strong>cia (t) F odporová (t).<br />
M kolesá M motora i celkový mp<br />
Motive force<br />
F h<strong>na</strong>cia M kolesa<br />
<br />
r k<br />
olesa<br />
Reduced rotation masses<br />
i kol I 1kol iR 2 I prev icelkový 2 I KH<br />
m ROTred <br />
rk<br />
2<br />
where i kol – number of wheels,<br />
I 1kol – one wheel moment of inertia,<br />
i R – permanent gear ratio,<br />
I prev – moment of inertia of output gearbox shaft,<br />
i celkový – resultant gear ratio,<br />
I KH – the crankshaft moment of inertia, including flywheel.<br />
Equation of the vehicle motion:<br />
(m AUTA M ROTred ) d2 x(<br />
t)<br />
2<br />
F<br />
dt<br />
h<strong>na</strong>cia (t) F odporová (t)<br />
22 ● KOMUNIKÁCIE / COMMUNICATIONS 1/2003
C O M M U N I C A T I O N S<br />
I S<br />
Výsledky simulácie a príslušné a<strong>na</strong>lýzy<br />
Výsledky sú počítané pre všetky štyri uvažované prípady tvaru<br />
momentovej krivky vonkajšej otáčkovej charakteristiky motora<br />
(obrázok 7), danej parametrami časovania rozvodu. Na obrázku 9<br />
sú znázornené priebehy rýchlosti vozidla do času 120 s po štarte.<br />
Približne po 90 s <strong>na</strong>stáva vo všetkých prípadoch ustaľovanie rýchlosti<br />
a v čase 120 s už takmer <strong>na</strong>dobúda ustálenú hodnotu. Z priebehov<br />
vidno nezanedbateľný vplyv časovania <strong>na</strong> veľkosť maximálnej<br />
dosiahnuteľnej rýchlosti vozidla. Do ustálenia maximálnej rýchlosti<br />
prejde vozidlo viac ako 4 km. Zmenu rýchlosti z 0 <strong>na</strong> 100 km.h 1<br />
(obrázok 10) dosiahne vozidlo podľa výpočtu <strong>na</strong>jskôr v prípade<br />
VTmax za čas 14,3 s, <strong>na</strong>jneskôr v prípade VTnMin za čas 17,3 s.<br />
Simulation results and appropriate a<strong>na</strong>lyses<br />
The results are calculated for all four considered shapes of the<br />
outer speed characteristics torque curve (Fig. 7), given by parameters<br />
of variable timing. In Fig. 9 there are velocity behaviors<br />
covering time interval of 120 s after the vehicle start. Approximately<br />
after 90 s in all cases there is velocity conditioning and<br />
within 120 s the velocity values are nearly conditioned. Variable<br />
timing has an obvious influence on the maximal achieved velocity<br />
value of the vehicle. The vehicle covers more than 4 km until it<br />
achieves the maximum velocity. A change of velocity from 0 to<br />
100 km.h 1 (Fig. 10) is achieved – according to the calculations<br />
– in the case of VTmax in the quickest time interval of 14.3 s and<br />
in the case of VTnMin in the longest time interval of 17.3 s.<br />
Obr. 9. Priebehy rýchlosti vozidla až po dosiahnutie ustálenej hodnoty<br />
Fig. 9. Velocity behaviors until the conditioned state<br />
Obr. 10. Detail z oblasti dosiahnutia 100 km.h 1 pri rôznych<br />
časovaniach rozvodu<br />
Fig. 10. Detail from the zone of achieving 100 km.h 1 for various<br />
valve gear timing<br />
Obr. 11. Priebehy zrýchlení vozidla pri rôznych<br />
časovaniach rozvodu<br />
Fig. 11. Acceleration behaviors for various valve gear timing<br />
Obr. 12. Časový priebeh otáčok motora pri rôznych<br />
časovaniach rozvodu<br />
Fig. 12. Engine rotatio<strong>na</strong>l speed time behaviors<br />
for various valve gear timing<br />
Obr. 13. Časový priebeh krútiaceho momentu motora pri rôznych<br />
časovaniach rozvodu<br />
Fig 13. Torque of engine time behavior for various valve<br />
gear timing<br />
Obr. 14. Časový priebeh efektívneho výkonu motora pri rôznych<br />
časovaniach rozvodu<br />
Fig. 14. Engine power time behavior for various valve<br />
gear timing<br />
KOMUNIKÁCIE / COMMUNICATIONS 1/2003 ●<br />
23
C O M M U N I C A T I O N S<br />
I S<br />
Engine torque<br />
Obr. 15. Radenie prevodov (1.3MPI)<br />
Fig. 15. Gear ratio changes (1.3MPI)<br />
Obr. 16. Radenie prevodov (1.3MPI)<br />
Fig. 16. Gear ratio changes (1.3MPI)<br />
Driving resistance<br />
Driving force<br />
Driving force<br />
Driving resistance<br />
Driving resistances<br />
Driving resistance<br />
Driving resistance<br />
Driving resistance<br />
Obr. 17. H<strong>na</strong>cia a odporová sila<br />
Fig. 17. Motive and resistant force<br />
Obr. 18. Priebeh odporových síl od rýchlosti<br />
Fig. 18. Resistance forces behavior<br />
Zrýchlenie vozidla (obrázok 11) sa postupne znižuje až <strong>na</strong><br />
nulovú hodnotu pri dosiahnutí maximálnej rýchlosti. Počas preraďovania<br />
rýchlostných stupňov je zrýchlenie záporné z dôvodu<br />
spomaľovania, spôsobeného odpormi pôsobiacimi proti pohybu<br />
vozidla. Spomaľovanie pri preraďovaní má tým väčšiu absolútnu<br />
hodnotu, čím je vyššia rýchlosť. Toto je dané rastúcou závislosťou<br />
odporových síl od rýchlosti, znázornenou <strong>na</strong> obrázku 12.<br />
Priebehy parametrov motora ako sú otáčky, krútiaci moment<br />
a výkon sú <strong>na</strong> obrázkoch 12 až 16. Preraďovanie rýchlostných<br />
stupňov v prípade 1.3MPI je <strong>na</strong> obrázkoch 15 a 16. Priebeh h<strong>na</strong>cej<br />
sily pre prípad 1.3MPI je uvedený <strong>na</strong> obrázku 17. Hodnota h<strong>na</strong>cej<br />
sily je pri maximálnej ustálenej rýchlosti rovná hodnote sily odporovej.<br />
Celková odporová sila je riešenom prípade daná súčtom sily<br />
odporu vzduchu a sily odporu valenia (obrázok 18).<br />
Vyhodnotenie simulácie<br />
Použitý model umožňuje a<strong>na</strong>lyzovať vplyvy variabilného časovania<br />
rozvodu motora (<strong>na</strong>pr. VARROZ KKVMZ) a iných zaujímavých<br />
parametrov. Z numerickej simulácie vyplýva očakávaný výsledok,<br />
ktorým je dosiahnutie <strong>na</strong>jpriaznivejších parametrov pre prípad roz-<br />
The vehicle acceleration (Fig. 11) gradually decreases until it<br />
reaches the zero value at achieving the maximum velocity. The<br />
acceleration is negative during gear ratio changes as a result of<br />
deceleration, which is caused by resistance forces acting against<br />
the vehicle motion. The higher is the velocity the higher is the value<br />
of deceleration during gear ratio changes. This is given by the<br />
increasing dependence of resistance forces on the vehicle velocity,<br />
which is illustrated in Fig 12.<br />
The engine parameter time dependencies, as rotatio<strong>na</strong>l speed,<br />
torque and power, are shown in Figs. 12–16. The gear ratio changing<br />
in the case of the 1.3MPI engine is in Figs. 15–16. The moving<br />
force behavior for the1.3MPI engine is in Fig. 17. The value of the<br />
moving force at the maximum vehicle speed is equal to the value<br />
of resistance force. The total resistance force is, in this solved case,<br />
given by a sum of air drag force and roll resistance force (Fig. 18).<br />
Assessment of simulation<br />
The used model e<strong>na</strong>bles to a<strong>na</strong>lyze influences of the engine<br />
valve gear variable timing (for instance VARROZ KKVMZ) and<br />
other interesting parameters. The numeric simulation has provided<br />
the expected result, which is the achievement of optimal parame-<br />
24 ● KOMUNIKÁCIE / COMMUNICATIONS 1/2003
C O M M U N I C A T I O N S<br />
I S<br />
vodu s variabilným časovaním, vo výpočtoch oz<strong>na</strong>čený ako prípad<br />
VTmax. Čas <strong>na</strong> dosiahnutie rýchlosti 100 km.h 1 sa v prípade<br />
variabilného časovania rozvodu VTmax skrátil oproti štandardnému<br />
<strong>na</strong>staveniu časovania motora 1.3MPI o rovných 1,5 s, čo činí<br />
v percentuálnom vyjadrení skrátenie času až o 9,49 %.<br />
Tento výsledok je veľmi výz<strong>na</strong>mný, ak si uvedomíme, že je<br />
dosiahnutý iba lepšou reguláciou výmeny náplne motora prostredníctvom<br />
variabilne časovaného rozvodu, bez zmeny hlavných rozmerov<br />
motora, bez zmeny kompresného pomeru a bez zvýšenia<br />
otáčok.<br />
ters for valve gear variable timing for calculations related to VTmax.<br />
Time needed for achieving 100 km.h-1 has been reduced by 1.5 s<br />
in the case of VTmax when compared with the standard timing of<br />
the 1.3MPI engine, which amounts to 9.49 per cent.<br />
This result is very significant when we take into consideration<br />
that it has been achieved only due to a better regulation of the<br />
engine cylinders filling by means of a variable timed valve gear,<br />
without any change of the engine dimensions, compression ratio<br />
or maximum value of rotatio<strong>na</strong>l speed.<br />
4. Záver<br />
Starostlivosť o životné prostredie prostredníctvom legislatívnych<br />
krokov núti výrobcov dopravných prostriedkov znižovať hladinu<br />
plynných i hlukových emisií. K ich znižovaniu možno v podstate<br />
pristupovať dvoma spôsobmi, a to:<br />
●<br />
●<br />
aktívne - znižovanie a odstraňovanie emisií priamo v zdroji,<br />
pasívne - dodatočné znižovanie a odstraňovanie.<br />
V príspevku je a<strong>na</strong>lyzovaná jed<strong>na</strong> možná cesta (použitie variabilného<br />
časovania rozvodu) aktívneho spôsobu znižovania zaťaženia<br />
životného prostredia plynnými emisiami.<br />
Centrálnym problémom nie je len obava z vyčerpateľnosti<br />
energetických zdrojov, ale veľmi aktuál<strong>na</strong> i <strong>na</strong>liehavá je otázka<br />
zaťaženia životného prostredia. Tento fakt je spôsobený tým, že<br />
emisie produkované dopravnými prostriedkami ovplyvňujú život<br />
<strong>na</strong> zemi nielen priamo, ale aj nepriamo. Je dokázané, že pre ľudí<br />
neškodné plyny ako oxid uhličitý CO 2 , metán CH 4 , oxid dusíka<br />
N 2 O ako aj halogénove uhľovodíky ovplyvňujú zemskú atmosféru.<br />
Riešenie konkrétnych úloh sa potom dotýka nielen výrobcov<br />
dopravných prostriedkov, výstavby dopravných ciest, ale aj dopravnej<br />
prevádzky. Na dopravných cestách sa pohybuje veľké množstvo<br />
dopravných prostriedkov. Ich zdrojom energie je v prevažnej<br />
väčšine spaľovací motor. Tieto dopravné prostriedky nielenže znečisťujú<br />
ovzdušie, pôdu a vody, spôsobujú hluk a otrasy, zaberajú<br />
pôdu, produkujú ďalšie odpady z dopravnej prevádzky i pri ich<br />
výrobe, ale aj spotrebúvajú neobnoviteľné zdroje energie a niekedy<br />
majú rušivé estetické a psychologické účinky. Na druhej strane<br />
treba poukázať aj <strong>na</strong> pozitívne pôsobenie <strong>dopravy</strong>. Tieto skutočnosti<br />
vyžadujú venovať sa so všetkou vážnosťou a zodpovednosťou<br />
problematike dopravných prostriedkov v súvislosti so životným<br />
prostredím.<br />
4. Conclusions<br />
Attention paid to the environment through legislative measures<br />
forces manufacturers of means of transport to reduce levels of<br />
gaseous and noise emissions. The reduction can be, in fact, approached<br />
in two ways:<br />
● Actively – reduction and elimi<strong>na</strong>tion of emissions directly in<br />
the source,<br />
● Passively – additio<strong>na</strong>l reduction and elimi<strong>na</strong>tion.<br />
In the article one possible active way (use of variable timed<br />
valve gear) of reducing negative impact on gaseous emissions on<br />
the environment is a<strong>na</strong>lyzed.<br />
The core issue is not only fear that sources of energy can be<br />
exhausted but really topical and urgent is the question of environmental<br />
pollution. This has been caused by the fact that emissions<br />
produced by means of transport influence life on the Earth not<br />
only directly but also indirectly. It is proved that gases being harmless<br />
to people as carbon dioxide CO 2 , methane CH 4 , nitrogen<br />
oxide N 2 O as well as halogen hydrocarbons influence the atmosphere.<br />
The solution of particular tasks thus concerns not only<br />
manufacturers of means of transport, constructions of transport<br />
routes but also operation. There are many means of transport on<br />
roads and highways. The source of energy, for most of them, is<br />
a combustion engine. The means of transport not only pollute the<br />
air, land and water, cause noise and vibrations and occupy land,<br />
produce other waste from their operation and also in their production<br />
but they also consume energies that cannot be recycled<br />
and sometimes produce harmful esthetic and psychological effects.<br />
On the other hand, it is necessary to underline the positive role of<br />
transport too. All the above facts emphasize the need to solve the<br />
issues of means of transport and the environmental protection<br />
with utmost seriousness and responsibility.<br />
Literatúra – References<br />
[1] ANONYM: prospekty, katalógy a webovske stránky firiem automobilového priemyslu<br />
[2] ČÁP J., FREIBAUER L., HLAVŇA V.: Teorie vozidel, Alfa, Bratislava, 1985.<br />
[3] HLAVŇA, V. a kol.: Dopravný prostriedok a životné prostredie, ES VŠDS Žili<strong>na</strong> 1996, ISBN 80-7100-306-9<br />
[4] ISTENÍK, R.: Simulácia mechanických a termomechanických procesov v spaľovacích motoroch a vozidlách, SjF ŽU Žili<strong>na</strong>, habilitačná<br />
práca 2002<br />
[5] ISTENÍK R., FITZ P.: Programový systém DYNAST – riešené príklady z dopravnej a manipulačnej techniky, vysokoškolská učebnica,<br />
EDIS, Žilinská <strong>univerzita</strong>, ISBN 80-7100-829-X, Žili<strong>na</strong>, 2001<br />
KOMUNIKÁCIE / COMMUNICATIONS 1/2003 ●<br />
25
C O M M U N I C A T I O N S<br />
I S<br />
Zygmunt Szlachta – Jerzy Cisek *<br />
DODATOČNÉ VSTREKOVANIE PALIVA DO VALCA VZNETOVÉHO<br />
MOTORA AKO METÓDA ZNIŽOVANIA NO x<br />
THE DIESEL FUEL POST-INJECTION INTO ENGINE CYLINDER AS METHOD<br />
OF NO x REDUCTION<br />
Možnosti obmedzovania emisií NO x vo valci vznetového motora pri jeho konštrukcii alebo prostredníctvom prevádzkových parametrov sú<br />
limitované. Preto sa robia štúdie efektívnosti rôznych metód znižovania NO x vo výfukových plynoch. Metóda, ktorú použili autori, využíva redukčného<br />
činiteľa vo forme chemicky aktívnych uhľovodíkov (radikálov) z paliva. Aby sa získali čiastočne oxidované a tepelne rozložené uhľovodíky,<br />
aplikoval sa dodatočný vstrek (vstreknutie ďalšej časti paliva) do valca vznetového motora v priebehu expanzie. Na vyko<strong>na</strong>nie tejto funkcie sa<br />
skonštruoval špeciálny systém <strong>na</strong> dodávku paliva skladajúci sa z dvoch vstrekovacích čerpadiel. Jedno z čerpadiel vstrekovalo hlavnú (primárnu)<br />
dávku paliva, druhé vstrekovalo dodatočnú dávku paliva. Vstrekovanie oboch dávok paliva bolo realizované rov<strong>na</strong>kým vstrekovačom. Vo výfukovom<br />
systéme jednovalcového testovacieho motora sa použil katalytický konvertor a všetky výfukové plyny vytvorené spaľovaním hlavnej dávky<br />
paliva a chemicky aktivované uhľovodíky pochádzajúce z dodatočnej dávky paliva prechádzali cez konvertor. Na vyhodnotenie dosiahnutých<br />
výsledkov sa definovali rôzne postupy zamerané <strong>na</strong> efektívne znižovanie NO x . Počas testov sa menil uhol vstreku hlavnej i dodatočnej dávky<br />
paliva (vzhľadom <strong>na</strong> hornú úvrať) ako aj teplota, priestorová rýchlosť výfukových plynov prechádzajúcich cez konvertor a druh paliva.<br />
Zistilo sa, že ak sa použije metóda redukčného činiteľa, je celkový efekt redukcie NO x kombináciou efektov získaných vo valci selektívnou<br />
nekatalytickou redukciou a účinkov v katalytickom konvertore získaných selektívnou katalytickou redukciou.<br />
The possibilities of limiting the emission of nitrogen oxides in the cylinder of the diesel engine by means of its design and operating parameters<br />
are limited. This is why studies of the effectiveness of various methods for NO x reduction in exhaust gases are being undertaken. The<br />
method used by the authors involves the utilization of a reducing agent in the form of chemically active hydrocarbons (radicals) from the fuel.<br />
In order to obtain partially oxidized and thermally decomposed hydrocarbons, the post-injection of fuel (the injection of an additio<strong>na</strong>l portion<br />
of fuel) into the diesel engine cylinder during the expansion stroke was implemented. To perform this function, a special fuel supply system<br />
consisting of two injection pumps was designed. One of the pumps was injecting the main (primary) fuel dose, and the other one – the additio<strong>na</strong>l<br />
fuel dose. Injection of both fuel doses was accomplished by the same injector. A catalytic converter was used in the exhaust system of the<br />
one-cylinder test engine, and all the exhaust gases produced in the combustion of the main diesel fuel dose and chemically activated hydrocarbons<br />
coming from the fuel post-injection (additio<strong>na</strong>l fuel dose) were passing through the converter. Various NO x reduction efficiency measures<br />
were defined to evaluate the results obtained. During the tests, the additio<strong>na</strong>l diesel fuel dose and post-injection angle (relative to the TDC), as<br />
well as temperature, space velocity of exhaust gases through converter and sort of diesel fuel were changed.<br />
It was found that using that method of the reducing agent dosage, the total effect of nitrogen oxide reduction was a combi<strong>na</strong>tion of the<br />
effects obtained in the engine cylinder by Selective Non-Catalytic Reduction (SNR) and the effects obtained in the catalytic converter by Selective<br />
Catalytic Reduction (SCR).<br />
1. Introduction<br />
The issue of NO x emission reduction pertains not only to diesel<br />
engine exhaust gases, but also to the spark ignition, petrol-fuelled<br />
engine. However, in the conventio<strong>na</strong>l spark-ignition engine, the<br />
problem of particulates emission is not so important as in the<br />
diesel engine, where particulates are produced during the combustion<br />
of heterogeneous mixtures, specific to the diesel engine.<br />
Nitrogen oxide emission in petrol engines has been limited to the<br />
level imposed by the relevant standards by the common use of threeway<br />
catalytic converters, reducing also other toxic constituents of<br />
the exhaust gases (CO, HC). This concept is not useful in the<br />
diesel engine whose exhaust gases contain a significant amount of<br />
oxygen [4]. For this reason, research projects initiated currently<br />
aim to develop efficient NO x emission reduction methods, based<br />
on the proven technologies for NO x elimi<strong>na</strong>tion from exhaust gases<br />
typical for the chemical industry and power industry.<br />
According to the results of tests [19, 22, 23], nitrogen oxides<br />
generated in the process of burning diesel fuel in the diesel engine<br />
can be reduced by two methods: Selective Non-Catalytic Reduction<br />
(SNR) and Selective Catalytic Reduction (SCR). The former<br />
* Zygmunt Szlachta, Assoc. Prof., D.Sc., Ph.D., M.E., Jerzy Cisek, Ph.D., M.E.,<br />
Institute of Automobiles and Inter<strong>na</strong>l Combustion Engines, Cracow University of Technology, 31-155 Kraków, ul. Warszawska 24, Poland.<br />
Tel./Fax.: ++48-12- 6282047, E-mail: z.szlachta@usk.pk.edu.pl, jcisek@usk.pk.edu.pl<br />
26 ● KOMUNIKÁCIE / COMMUNICATIONS 1/2003
C O M M U N I C A T I O N S<br />
I S<br />
one is a thermal method, and it can be employed in the processes<br />
of reduction taking place in the engine cylinder and partially in the<br />
exhaust system owing to a relatively high temperature of exhaust<br />
gases to which the reducing agent is added. However, outside the<br />
cylinder, the effectiveness of this method is low because of a rapid<br />
drop in the exhaust gas temperature. This temperature depends on<br />
the diesel engine operating conditions and, in the exhaust systems,<br />
ranges from 373 to 423K when the engine is idling, from 423 to<br />
623K in urban traffic (low and medium loads and engine speeds),<br />
and from 623 to 1023K on a highway. In order to employ the SNR<br />
method to reduce nitrogen oxides it would be necessary to heat up<br />
exhaust gases, which involves energy losses.<br />
In the engine exhaust system it is more favourable to use a catalytic<br />
converter which reduces NO x emissions by means of the<br />
SCR method. An extensive development of this method, with an<br />
application to engine exhaust gases, started in the eighties. Similarly<br />
as in the chemical industry and statio<strong>na</strong>ry power plants, nitrogen-containing<br />
compounds, such as ammonia or urea, are usually<br />
considered as nitrogen oxide reducing agents. Various test results<br />
indicate that ammonia used in a catalytic converter to reduce the<br />
concentration of nitrogen oxides in the diesel engine exhaust gases<br />
provides high reduction efficiency exceeding 90%. The use of this<br />
reducing agent is, however, not practical owing to its toxicity, explosiveness<br />
in a mixture with air, and also by a sharp and unpleasant<br />
odour. Additio<strong>na</strong>lly, it would be necessary to use pressure vessels<br />
for the transportation of ammonia. Consequently, urea as an indirect<br />
source of ammonia seems to be more useful in this application.<br />
Urea used as a non-toxic source of ammonia is a safe reducing<br />
agent. Additio<strong>na</strong>lly, its good solubility in water facilitates transportation<br />
in diluted form. As a result of injecting urea into hot<br />
exhaust gases (having a temperature above 430K) before the catalytic<br />
converter, the first reaction taking place is the hydrolysis of<br />
urea, during which ammonia and other compounds such as NH 2<br />
are produced (one kilogram of urea yields 0.566 kg of ammonia).<br />
Assuming the NO to NO 2 ratio of 9:1, which is valid for the diesel<br />
engine exhaust gases, it can be calculated that to reduce 1 kg of<br />
NO x , about 0.67 kg of urea is needed [9]. The efficiency of NO x<br />
reduction depends both on the reduction process conditions and<br />
on the amount of urea used.<br />
It must be emphasised that in order to use urea and/or ammonia<br />
in traction engines it would be necessary to employ a costly system<br />
dosing these reducing agents adequately to engine operating conditions<br />
(NO x content of exhaust gases), and periodically replenishing<br />
the tank with the reducing agent. It would be also necessary to<br />
build a complete distribution system for ammonia or urea, and to<br />
take protective measures against the effects caused by a potential<br />
escape of toxic ammonia to the atmosphere from the engine<br />
exhaust system. Thus the use of the selective catalytic reduction of<br />
nitrogen oxides by means of nitrogen-based compounds is better<br />
justified in industrial diesel engines or in engines installed on<br />
ships, while for traction diesel engines powering motor vehicles it<br />
is more appropriate to focus research activities on the use of other<br />
reducing agents, such as hydrocarbons.<br />
2. Studies of NO x Reduction with Hydrocarbons<br />
Publications on that subject usually describe the results of tests<br />
conducted in laboratory conditions. Such tests usually involve the<br />
reduction of nitrogen oxides contained in a mixture prepared from<br />
gases stored in pressure gas vessels and having similar composition<br />
to that of the actual diesel engine exhaust gases. To investigate<br />
the effects of NO x reduction by the SCR method, hydrocarbons<br />
(also from a pressure gas vessel) were introduced into such gaseous<br />
mixtures flowing through a catalytic reactor. Less results of tests<br />
conducted with actual diesel engine exhaust gases are available. In<br />
such tests, the following substances were used to reduce nitrogen<br />
oxides: hydrogen H 2 , gaseous hydrocarbons CH 4 , C2H 4 , C 3 H 6 ,<br />
etc. [7, 10, 12, 13], alcohols [4, 7, 14, 15] and hydrocarbons contained<br />
in diesel fuel. Diesel fuel was usually injected into the exhaust<br />
system, before the catalytic reactor [5, 10, 12, 13, 17, 18].<br />
Because of its temperature, the location where hydrocarbons<br />
are added to exhaust gases has a considerable influence on the<br />
process of nitrogen oxide reduction, as it is related to the amount<br />
and chemical activity of radicals generated during the initial decomposition<br />
of hydrocarbon molecules. The most favourable solution<br />
seems to be the injection of an additio<strong>na</strong>l hydrocarbons directly<br />
into the cylinder, where they would be subjected to the initial<br />
decomposition. High temperature of the working medium and longer<br />
time of the initial decomposition of hydrocarbon molecules would<br />
be the advantages of such a solution. Considering possible engineering<br />
applications, the method of dosing the reducing agent into<br />
the cylinder has more advantages. This method was used in the tests<br />
described here, where additio<strong>na</strong>l hydrocarbons (contained in diesel<br />
fuel) were introduced directly into the engine cylinder, as a result<br />
of the post-injection of an additio<strong>na</strong>l, small portion of fuel, during<br />
the expansion stroke. Contrary to the main fuel dose injected during<br />
the compression stroke, the additio<strong>na</strong>l fuel dose did not have any<br />
influence on the engine output power.<br />
In order to chemically activate the hydrocarbons, the additio<strong>na</strong>l<br />
fuel dose injected into the cylinder should undergo a similar<br />
physical and chemical transformation as in the autoignition delay<br />
period, i.e. it should produce the so-called cool flame, without<br />
reaching the hot flame state (i.e. autoignition and combustion). In<br />
such conditions, as a result of thermal decomposition of hydrocarbon<br />
molecules and their initial reactions with oxygen contained in<br />
the exhaust gases, chemically active molecules of hydrogen H 2 ,<br />
radicals R ●<br />
(hydrocarbon molecule after loosing one hydrogen<br />
atom), HO 2<br />
●, ROO ● and atomic hydrogen H ● are produced, demonstrating<br />
strong NO x -reducing properties. This method of injecting<br />
additio<strong>na</strong>l fuel dose into the cylinder causes some portion of the<br />
products of partial oxidation of hydrocarbons to react with nitrogen<br />
oxides yet in the engine cylinder (because of high temperature<br />
inside it). Consequently, a part of nitrogen oxides is subjected to<br />
thermal reduction. It must be noted that the radicals taking part in<br />
the process of nitrogen oxide reduction may be also contained in the<br />
products of water, carbon monoxide, and carbon dioxide dissociation,<br />
generated by burning the main fuel dose [19, 22, 23].<br />
Reactions of NO x reduction taking place in a catalytic reactor<br />
have different course than thermal reactions, and their mechanism<br />
KOMUNIKÁCIE / COMMUNICATIONS 1/2003 ●<br />
27
C O M M U N I C A T I O N S<br />
I S<br />
depends not only on the reducing agent type, but also on the<br />
reactor type used. Iwamoto, who first started to use hydrocarbons<br />
for NO x reduction in the diesel engine exhaust gases by the SCR<br />
method, proved that in the Cu/ZSM-5 zeolitic reactor, reducing<br />
agents such as C 2 H 4 , C 3 H 6 , C 4 H 8 and alcohols demonstrate selective<br />
reducing capability, while H 2 , CO and CH 4 are non-selective<br />
reducing agents with respect to nitrogen oxides [11]. This indicates<br />
that the level of NO x reduction depends on the selective capability<br />
of particular reducing agents. In the case when diesel fuel is<br />
used as the reducing agent source it is difficult to determine its<br />
selective capability, because it depends on the percentage of particular<br />
hydrocarbons or hydrocarbon groups in the fuel. According<br />
to [6, 14], aromatic hydrocarbons are the best reducing agents, followed<br />
by olefins, paraffins, and aldehydes. It must be remembered<br />
that depending on the engine operating conditions, the composition<br />
and amount of unburned hydrocarbons change continuously.<br />
Apart from the selective capability of the reducing agent and the<br />
exhaust gas temperature, at the same relative volumetric flow rate<br />
of exhaust gases SV, the efficiency of NO x reduction is influenced<br />
also by H 2 0, SO 2 , and O 2 [13]. The mechanisms of NO x reduction<br />
in a catalytic converter have been investigated in many papers<br />
summarized in [23], especially interesting being the model presented<br />
by Hamada, proposing two ways of NO x reduction [8].<br />
In view of the above, it may be stated that the fi<strong>na</strong>l effect of<br />
NO x reduction in the diesel engine exhaust gases combines the<br />
results of both thermal (SNR) and catalytic (SCR) reduction.<br />
Partial effects depend not only on the volume of the additio<strong>na</strong>l<br />
injection of fuel being the source of the reducing agent, but also<br />
on the time and temperature at which hydrocarbons are present in<br />
the cylinder before the exhaust valve opens. In order not to burn<br />
the hydrocarbons additio<strong>na</strong>lly introduced into the cylinder, the fuel<br />
post-injection (effected during the expansion stroke) must not be<br />
too early in relation to the injection and combustion of the main<br />
fuel dose. It cannot be effected too late, either, since the temperature<br />
in the cylinder may be too low and the time mentioned above<br />
may be too short. Thus the total NO x reduction efficiency may be<br />
influenced by the following factors: volume of the additio<strong>na</strong>l fuel<br />
dose, timing of fuel post-injection (relative to the expansion stroke),<br />
engine speed and engine load, exhaust gas temperature, oxygen<br />
concentration in the exhaust gases, etc. Diesel fuel composition, i.e.<br />
the content of hydrocarbon groups influencing thermal decomposition<br />
of molecules, may also have a significant effect on the reduction<br />
efficiency.<br />
The idea presented in the paper is based on the simultaneous<br />
implementation of diesel fuel post-injection and a catalytic converter.<br />
It does not require any additio<strong>na</strong>l dosing system for injecting<br />
hydrocarbons before the converter. The method could be implemented<br />
quite easily in widely used common-rail injection systems<br />
which allow the fuel dose injected to be divided into freely adjusted<br />
portions. Such a system of hydrocarbon dosage has been already<br />
indicated in [16], but without any detailed information.<br />
The possibility of using fuel-contained hydrocarbons in the<br />
process of thermal and catalytic reduction of NO x in the diesel<br />
engine exhaust gases has been investigated in the Cracow University<br />
of Technology [3, 19, 20, 21, 22, 23]. Tests were done on the<br />
single-cylinder test engine. For the purpose of tests, a special fuel<br />
supply system was built, consisting of two injection pumps: a main<br />
injection pump delivering fuel necessary for engine operation, and<br />
an additio<strong>na</strong>l injection pump delivering additio<strong>na</strong>l amount of fuel<br />
(hydrocarbons) used for NO x reduction. The pumps were connected<br />
in a row by means of a clutch providing continuous change<br />
of angle between injection the main fuel dose and the additio<strong>na</strong>l<br />
fuel dose. Fuel from both pumps was delivered to the engine cylinder<br />
through the same injector. To elimi<strong>na</strong>te unnecessary interaction<br />
between fuel pressures generated by both pumps, a double check<br />
valve was installed before the injector. A catalytic converter was<br />
installed in the exhaust system. Exhaust gas samples were taken<br />
for a<strong>na</strong>lysis before and after the catalytic converter. Temperature<br />
was measured at the points where samples were taken.<br />
3. NO x reduction efficiency definitions<br />
As it has been mentioned before, owing to a high temperature<br />
in the cylinder and a longer time of initial decomposition of molecules,<br />
first effects of radicals and hydrogen reducing action may<br />
be observed yet in the engine cylinder, and also in the exhaust<br />
manifold between the cylinder and the catalytic converter. The<br />
resultant NOx reduction has the form of Selective Non-Catalytic<br />
Reduction (SNR). In the catalytic converter, however, NO x reduction<br />
is accomplished by Selective Catalytic Reduction (SCR). To<br />
evaluate the effects of both NO x reduction methods, and to evaluate<br />
the total effect, three definitions of NO x reduction efficiency<br />
have been introduced. Auxiliary quantities used for calculations,<br />
together with the points where the exhaust gases were sampled for<br />
a<strong>na</strong>lysis, are shown in Fig. 1.<br />
C 1b C 1p C 2b C 2p<br />
Fig. 1. Quantities used for the calculation of NO x reduction efficiency<br />
where:<br />
C1b – NO x concentration before the catalytic converter, the engine<br />
being supplied only with the main fuel dose (without fuel<br />
post-injection),<br />
C1p – NO x concentration before the catalytic converter, the engine<br />
being supplied with the main and additio<strong>na</strong>l fuel dose (with<br />
fuel post-injection),<br />
C2b – NO x concentration after the catalytic converter, the engine<br />
being supplied only with the main fuel dose (without fuel<br />
post-injection),<br />
C2p – NO x concentration after the catalytic converter, the engine<br />
being supplied with the main and additio<strong>na</strong>l fuel dose (with<br />
fuel post-injection).<br />
28 ● KOMUNIKÁCIE / COMMUNICATIONS 1/2003
C O M M U N I C A T I O N S<br />
I S<br />
For the purpose of a test results a<strong>na</strong>lysis, several definitions<br />
of NO x reduction efficiency can be applied:<br />
SNR –the efficiency of thermal Selective Non-Catalytic Reduction<br />
between the cylinder and the catalytic converter.<br />
SNR C 1b C 1p<br />
<br />
C<br />
1b<br />
SCR –the efficiency of Selective Catalytic Reduction in the catalytic<br />
converter.<br />
SCR C 1p C 2p<br />
<br />
C<br />
T<br />
1p<br />
– the total efficiency of NO x reduction, combining the effects<br />
of both Selective Non-Catalytic Reduction (SNR) before<br />
the catalytic converter and Selective Catalytic Reduction<br />
(SCR) in the catalytic converter.<br />
T C 1b C 2p<br />
<br />
C<br />
1b<br />
4. Results and discussion<br />
4.1. The influence of fuel post-injection timing during<br />
the expansion stroke<br />
Efficiency of NO x reduction measurements were made at two<br />
engine speeds: at 1600 r.p.m., and 2000 r.p.m. The torque developed<br />
by engine was constant (T 60 Nm) in both cases. The main<br />
fuel dose was adjusted so as to obtain the assumed operating parameters<br />
of the engine, and its volume was q 1 60 mm 3 /cycle at<br />
1600 r.p.m., and q 1 63 mm 3 /cycle at 2000 r.p.m. The ratio of the<br />
reducing agent to nitrogen oxides before catalytic reactor was kept<br />
at a constant level (HC 1 /NO x 3). This value was determined by<br />
a<strong>na</strong>lyzing the results of tests conducted in other research centres.<br />
These results were obtained for direct introduction of hydrocarbons<br />
before the catalytic converter, and the optimum HC 1 /NO x<br />
ratio in terms of NO x reduction efficiency and reducing agent utilization<br />
was determined at a level of 3 [1, 2, 4].<br />
The start angle of fuel post-injection (injection of additio<strong>na</strong>l fuel<br />
dose) (was varied from 60 to 200° ATDC – after the top dead centre<br />
(the exhaust valve of the test engine starts to open at 140 ° ATDC).<br />
It was not possible to use smaller angle values because, in spite<br />
of considerably increased additio<strong>na</strong>l fuel dose, it was impossible<br />
to obtain the assumed ratio HC 1 /NO x 3. It is generally known<br />
that the amount of nitrogen oxides produced in the combustion<br />
chamber is constant at constant engine speeds and constant engine<br />
loads. However, when the start angle of fuel post-injection was<br />
changed, the concentration of hydrocarbons before the converter<br />
also changed, and it was necessary to adjust the additio<strong>na</strong>l injection<br />
fuel dose in order to maintain a constant HC 1 /NO x ratio.<br />
Changes in the concentration of hydrocarbons were mainly due to<br />
the utilization of some hydrocarbons in the process of NO x reduction<br />
between the cylinder and the converter (Selective Non-Catalytic<br />
Reduction, SNR), and due to the fact that some hydrocarbons<br />
from the additio<strong>na</strong>l injection fuel dose were burnt in the engine<br />
cylinder, when the fuel post-injection took place too early after the<br />
TDC.<br />
Fig. 2 shows the influence of the fuel post-injection angle on<br />
the efficiency of NOx reduction between the engine cylinder and<br />
the catalytic converter. The highest value of SNR 24% was<br />
obtained for 1600 r.p.m. and 60° ATDC. For 140° ATDC,<br />
the efficiency was around 10%. At 2000 r.p.m., for 80° ATDC,<br />
SNR was 22%, and for 120° ATDC, (SNR was about 4%. It<br />
is clear that the efficiency of NO x reduction depends on the fuel<br />
post-injection angle only for low values of this angle.<br />
A drop in the efficiency of NO x reduction by the SNR method<br />
for the increasing values of the fuel post-injection angle (valid<br />
for low values only) can be explained by the fact that less reducing<br />
agent was delivered to the cylinder when the delay of fuel postinjection<br />
relative to the TDC was longer. In such conditions the<br />
amount of chemically activated hydrocarbons decreased as well,<br />
also as a result of decreasing temperature inside the cylinder. At<br />
higher values the efficiency of thermal NO x reduction did not<br />
change, which may be explained by a stable amount of chemically<br />
activated hydrocarbons, although the total amount of hydrocarbons<br />
was different.<br />
Fig. 2. The influence of the fuel post-injection angle on the efficiency<br />
of thermal NO x reduction<br />
The total efficiency of NO x reduction T , combining all<br />
processes of NO x reduction before and after the catalytic converter<br />
as a function of the fuel post-injection angle, is presented in Fig.<br />
3. The functions showing this relationship are increasing for both<br />
engine speeds. A stronger influence of the fuel post-injection angle<br />
is visible at 2000 r.p.m. and for 120° ATDC. At 1600 r.p.m.<br />
similar values of T (about 20%) were obtained in the whole range<br />
of variability of the fuel post-injection angle. At 2000 r.p.m., T<br />
was around 18% in the range from 120 to 200 oATDC, but when<br />
the start of fuel post-injection was closer to the TDC, the values<br />
of T decreased, reaching 10% for 80 oATDC. This decrease<br />
in the total conversion efficiency was caused by lower NO x reduction<br />
efficiency in the converter, dropping down to even negative<br />
values (the amount of nitrogen oxides in the converter increased)<br />
– see Fig. 4.<br />
Fig. 4 shows an increase in the NO x reduction efficiency in<br />
the catalytic converter along with the increasing fuel post-injection<br />
KOMUNIKÁCIE / COMMUNICATIONS 1/2003 ●<br />
29
C O M M U N I C A T I O N S<br />
I S<br />
angle, mainly for low values of that angle ( 120° ATDC), and<br />
for both engine speeds. For higher values of , a stabilization of<br />
NO x reduction efficiency can be observed. It should be noted that<br />
for the lowest values the efficiency SCR drops below zero. Positive<br />
aspects of catalytic converter utilization can be noticed only<br />
for exceeding 80° ATDC at 1600 r.p.m., and for exceeding<br />
120° ATDC at 2000 r.p.m., because in that range the NO x reduction<br />
efficiency is greater than zero.<br />
Fig. 3. The influence of the fuel post-injection angle on the total<br />
efficiency of NO x reduction<br />
and the fuel post-injection angle ( 100° ATDC). The volumes<br />
of additio<strong>na</strong>l fuel dose were relatively high, reaching 26% of the main<br />
fuel dose at 1600 r.p.m. and 33% of the main dose at 2000 r.p.m.<br />
Such volumes were necessary to obtain the required maximum<br />
HC 1 /NO x ratio of 10 before the converter. It was expected that by<br />
using diesel fuel as a reducing agent source (diesel fuel is a mixture<br />
of hydrocarbons having various selectivity in terms of NO x reduction),<br />
the optimum level of that ratio in terms of NO x reduction<br />
efficiency would be much higher than 3.<br />
The curves shown in Fig. 5 prove that with higher volumes of<br />
additio<strong>na</strong>l fuel dose, the efficiency of NO x reduction in the SNR<br />
process increased. This increase was, however, not uniform, being<br />
higher for 1600 r.p.m. and lower for 2000 r.p.m. One can suspect<br />
that at 1600 r.p.m. more chemically active hydrocarbons were used<br />
in the SNR reactions. The volumes of fuel injected as the additio<strong>na</strong>l<br />
dose were smaller, but most of the hydrocarbons were not<br />
burnt. Initially decomposed and partially oxidized (chemically activated)<br />
hydrocarbons acted as an effective NO x reducing agent. The<br />
maximum efficiency (SNR in test conditions reached about 34%<br />
at 1600 r.p.m. and about 10% at 2000 r.p.m.<br />
Fig. 4. The influence of the fuel post-injection angle<br />
on the efficiency of catalytic NO x reduction<br />
Fig. 5. The influence of the additio<strong>na</strong>l fuel dose on the efficiency of<br />
thermal reduction of nitrogen oxides<br />
The total efficiency of NO x reduction T as a function of the<br />
additio<strong>na</strong>l fuel dose volume is presented in Fig. 6.<br />
Negative values describing NO x reduction efficiency demonstrate<br />
that the catalytic converter does not reduce nitrogen oxides<br />
effectively. This is caused by the fact that at high exhaust gas temperatures<br />
(exceeding the activation temperature of the converter by<br />
200 K) the converter becomes i<strong>na</strong>ctive and loses its selective capability<br />
including the capability of NO x reduction. Probably because<br />
of high exhaust gas temperatures and an excess of oxygen, further<br />
reactions of nitrogen oxidation take place in the converter (the<br />
exhaust gas temperature after the converter is lower, and the reaction<br />
of nitrogen oxidation is endothermic), and the concentration<br />
of nitrogen oxides inside the converter increases.<br />
4.2. The influence of the additio<strong>na</strong>l diesel fuel dose<br />
Tests were conducted at two engine speeds: 1600 and 2000<br />
r.p.m., with two constant parameters: the engine torque (T 60Nm),<br />
Fig. 6. The influence of the additio<strong>na</strong>l fuel dose<br />
on the total efficiency of NO x reduction<br />
The shape of both curves (for both engine speeds) is identical<br />
as those of the SNR process efficiency curves. The reason for<br />
30 ● KOMUNIKÁCIE / COMMUNICATIONS 1/2003
C O M M U N I C A T I O N S<br />
I S<br />
higher T values for the corresponding volumes of the additio<strong>na</strong>l<br />
fuel dose are additio<strong>na</strong>l processes of NO x reduction taking place<br />
in the catalytic converter. For the maximum volume of the additio<strong>na</strong>l<br />
fuel dose, the efficiency T reached about 42% at 1600 r.p.m.<br />
and about 21% at 2000 r.p.m. From the comparison with the results<br />
of the SNR process (Fig. 5) it is clear that the gain is relatively<br />
small. This is caused by low conversion efficiency in the catalytic<br />
converter.<br />
Fig. 7 shows the influence of the additio<strong>na</strong>l fuel dose volume<br />
on the efficiency of NO x reduction in the catalytic converter<br />
( SCR ). Attention must be drawn to the small influence of the additio<strong>na</strong>l<br />
fuel dose volume on the efficiency of the SCR process in the<br />
catalytic converter. The fuel post-injection results in a slight tendency<br />
towards higher efficiency numbers only at 1600 r.p.m.<br />
A reason for this insignificant sensitivity of the NO x reduction<br />
efficiency to the additio<strong>na</strong>l fuel dose volume may be the fact that,<br />
irrespective of the variation in the amount of hydrocarbons introduced<br />
into the converter, only a constant portion of hydrocarbons<br />
demonstrate selective reducing capability suitable for the converter<br />
being used. With the fuel post-injection, slightly better average efficiency<br />
of the SCR process in the converter (about 13%) was reached<br />
at 2000 r.p.m., while at 1600 r.p.m. the efficiency was about 8%.<br />
The reason for this may be higher exhaust gas temperature before<br />
the converter at 2000 r.p.m. resulting in gaining selective capabilities<br />
by more hydrocarbons contained in exhaust gases.<br />
caused by better conditions for the adsorption of nitrogen oxides<br />
and the reducing agent in the active cells of the converter due to<br />
prolonged contact time. Because of lower velocity of exhaust gas<br />
flowing through the converter, particles of nitrogen oxides and<br />
those of the reducing agent, due to their low kinetic energy, were<br />
deposited easier, increasing the level of adsorption in the active<br />
cells of the converter.<br />
Fig. 8. The influence of space velocity SV on the efficiency<br />
of catalytic NO x reduction<br />
Fig. 9 shows the total efficiency of NO x reduction as a function<br />
of the space velocity of exhaust gas flowing through the converter.<br />
This includes NO x reduction accomplished by selective<br />
non-catalytic (thermal) method (SNR) and by selective catalytic<br />
reduction (SCR).<br />
Fig. 7. The influence of the additio<strong>na</strong>l fuel dose on the efficiency<br />
of NO x reduction in the catalytic converter<br />
4.3. The influence of the space velocity of exhaust gas<br />
flowing through the converter<br />
The space velocity of exhaust gas SV is defined as the ratio of<br />
volumetric flow rate of exhaust gas flowing through the converter<br />
to the converter volume. As it can be seen in Fig. 8, the influence<br />
of this parameter on the efficiency of NO x selective catalytic<br />
reduction turned out to be very strong. While at the highest SV of<br />
78 x 10 3 h 1 the NO x reduction efficiency of 22% was obtained,<br />
at SV 30 x 10 3 h 1 even 68% reduction efficiency was found.<br />
As during the tests the proportion of the reducing agent to the<br />
NO x volume did not change (HC 1 /NO x 5), it must be stated<br />
that the reduction of NO x concentration after the converter was<br />
Fig. 9. The influence of space velocity SV on the total efficiency<br />
of NO x reduction<br />
The concentration of nitrogen oxides in the <strong>na</strong>tural exhaust<br />
gas was 710 ppm. As a result of thermal reduction between the<br />
engine cylinder and the converter it decreased to 500 ppm. Consequently,<br />
(SNR was 29.5% and this value did not change during<br />
the investigation of the influence of SV on the NO x reduction efficiency<br />
in the converter. The total efficiency of NOx reduction was<br />
determined assuming the concentration of nitrogen oxides in<br />
<strong>na</strong>tural exhaust gas, i.e. 710 ppm, as a reference value. With this<br />
assumption it was possible to determine the efficiency of NO x<br />
reduction from the whole volume of nitrogen oxides contained in<br />
the <strong>na</strong>tural exhaust gas of the engine. As it can be seen, the<br />
KOMUNIKÁCIE / COMMUNICATIONS 1/2003 ●<br />
31
C O M M U N I C A T I O N S<br />
I S<br />
minimum reduction efficiency of 42% was registered at the highest<br />
SV of exhaust gas flowing through the converter, <strong>na</strong>mely at 78 <br />
10 3 h 1 . The total efficiency of NO x reduction was higher at<br />
lower SV values, and at SV of 30 10 3 h 1 an efficiency of 77,5%<br />
was obtained.<br />
The results obtained lead to a conclusion that both methods<br />
implemented, i.e. the SNR and the SCR have a significant influence<br />
on the total efficiency of NO x reduction in the exhaust gas<br />
of the engine. As at certain conditions of NO x reduction process<br />
(with the post-injection of diesel fuel into the engine cylinder)<br />
there are some limitations affecting the possibility of influencing<br />
the efficiency of thermal reduction, the development work on the<br />
optimisation of catalytic converters, and consequently on the<br />
improvement of the SCR process, should be intensified.<br />
4.4. The influence of exhaust gas temperature<br />
at the converter<br />
The investigation of the influence of exhaust gas temperature<br />
on the efficiency of NO x reduction was conducted at a constant<br />
engine velocity n 1600 r.p.m., and at a constant engine torque<br />
T 80 Nm. The following parameters were also fixed: static injection<br />
timing of main fuel dose (27° BTDC), start angle of fuel postinjection<br />
100° ATDC), the main fuel dose q 1 76 mm 3 /cycle,<br />
and the additio<strong>na</strong>l fuel dose q 2 20 mm 3 /cycle. The test stand was<br />
equipped with an exhaust gas cooler to adjust the temperature of<br />
exhaust gas before the converter in the range of 260 to 460 °C.<br />
Fig. 10 shows that the converter used in the investigation featured<br />
the highest catalytic activity in terms of NO x reduction at<br />
exhaust temperatures approximately between 380 °C and 460 °C,<br />
providing the highest NO x reduction efficiency ranging from 25%<br />
to 44%. At temperatures between 260 °C and 360 °C, however, the<br />
efficiency of NO x reduction in the converter was negative, which<br />
means that the converter lost its catalytic function in the NO x<br />
reduction process and became an NO x “generator”. This was caused<br />
by reactions opposite to the NO x reduction, intensified at lower<br />
exhaust gas temperature. Nitrogen oxides were produced mainly<br />
from diesel fuel constituents containing nitrogen (additives augmenting<br />
the cetane number) and from radicals such as, for example,<br />
CH 2<br />
●, CNO ● , HCN ● .<br />
4.5. The influence of diesel fuel group composition<br />
Three diesel fuel grades differing in chemical composition<br />
were a<strong>na</strong>lysed. The properties of the fuels are collected in Table 1.<br />
Three main groups of hydrocarbons were distinguished in the diesel<br />
fuel: aromatic hydrocarbons, ethylenic hydrocarbons (olefins), and<br />
saturated hydrocarbons (paraffins and <strong>na</strong>phtenes).<br />
An investigation of the influence of diesel fuel group composition<br />
on the NO x reduction in the exhaust gas was conducted at<br />
a constant engine velocity n 1600 r.p.m. and a constant torque<br />
T 60 Nm. The main fuel dose q 1 60 mm 3 /cycle, the post-injection<br />
fuel dose q 2 20 mm 3 /cycle, the static injection timing of main<br />
fuel dose was 27° BTDC, and the start angle of fuel post-injection<br />
100° ATDC.<br />
Fig. 11 shows percentages of these hydrocarbons in the fuels<br />
used. The highest value of the total efficiency of NO x reduction<br />
C 54 % was obtained for fuel “3”, and the lowest value (48%)<br />
was obtained for fuel “1” (Fig. 12). The reason was a high NO x<br />
reduction efficiency achieved in the converter for fuel “3” due to<br />
NOx selective catalytic reduction, as shown in Fig. 13.<br />
Fig. 11. Contents of hydrocarbon groups in the fuels used<br />
Fig. 10. The influence of exhaust gas temperature before the converter<br />
on the efficiency of NO x catalytic reduction in a Cu/ZSM-5 converter<br />
Fig. 12. The influence of diesel fuel type on the total efficiency<br />
of NO x reduction<br />
The highest efficiency of NO x reduction in the catalytic converter<br />
SCR 42% was obtained for fuel “3” (Fig. 13).<br />
32 ● KOMUNIKÁCIE / COMMUNICATIONS 1/2003
C O M M U N I C A T I O N S<br />
I S<br />
Parameter Unit Fuel<br />
“1” “2” “3”<br />
1. Composition: [% vol.]<br />
aromatic hydrocarbons (arenes) 8.75 13.64 16.23<br />
ethylenic hydrocarbons (olefins) 1.08 1.19 1.96<br />
saturated hydrocarbons (paraffins + <strong>na</strong>phtenes) 90.17 85.17 81.81<br />
2. Aromatic hydrocarbons [% mass] 9.85 14.96 17.68<br />
3. Average molecular weight 254 189 214<br />
4. Structural composition:<br />
Carbon content of:<br />
aromatic structures C A [%] 5.63 11.20 12.34<br />
<strong>na</strong>phtene structures C N 33.21 24.93 25.26<br />
paraffin structures C P 61.16 63.87 62.40<br />
contents of rings in an average molecule:<br />
total P 1.24 0.86 1.01<br />
aromatic hydrocarbons P A 0.17 0.26 0.32<br />
<strong>na</strong>phtene hydrocarbons P N 1.07 0.60 0.69<br />
5. Density at 20 °C [kg/m 3 ] 0.837 0.8165 0.8305<br />
6. Sulphur content [% mass] 0.001 0.001 0.07<br />
7. Normal distillation: [°C]<br />
Start of distillation: 140 85 111<br />
5 190 120 155<br />
10 224 149 179<br />
20 250 176 202<br />
30 268 194 220<br />
40 282 210 239<br />
50 297 228 257<br />
60 309 249 273<br />
70 320 273 294<br />
80 331 296 314<br />
90 350 330 337<br />
95 356 355 359<br />
97 359 370 367<br />
8. Mass balance of distillation process:<br />
distillation below 250 °C [% mass] 13.11 51.6 39.3<br />
distillation 250 – 300 °C 31.73 22.3 24.6<br />
distillation 300 – 350 °C 35.77 20.5 24.1<br />
distillation residue 19.29 5.4 11.9<br />
distillation losses 0.1 0.2 0.1<br />
9. Cetane number 58.078 47.713 50.151<br />
Table 1<br />
Fig. 13. The influence of diesel fuel type on the efficiency<br />
of NO x reduction in a catalytic converter<br />
The SCR was 34% and 36% for fuels “1” and “2” respectively.<br />
Taking into account the properties of fuels collected in Tables 1,<br />
it may be concluded that the efficiency of selective catalytic reduction<br />
of nitrogen oxides in the catalytic converter depends on the<br />
aromatic hydrocarbon content of the fuel used. This is caused by<br />
the fact that aromatic hydrocarbons feature better selective properties<br />
in the NO x reduction process taking place in the converter<br />
used in the experiment than other hydrocarbons contained in diesel<br />
fuel. Such dependencies are also described in the literature on the<br />
subject discussed [6, 11, 14]. For example, according to [6], hydrocarbon<br />
groups can be ordered according to their selectivity as<br />
follows: arenes olefins paraffins, while according to [14] the<br />
order is: arenes olefins n-paraffins aldehydes. This explains<br />
why the SCR was the lowest for fuel “1” containing 9.85% of aro-<br />
KOMUNIKÁCIE / COMMUNICATIONS 1/2003 ●<br />
33
C O M M U N I C A T I O N S<br />
I S<br />
matic hydrocarbons by weight (the lowest content), and the highest<br />
for fuel “3” containing 17.68% of aromatic hydrocarbons by weight<br />
(the highest content).<br />
5. Conclusions<br />
It has been found that, as a result of fuel post-injection in the<br />
engine cylinder, nitrogen oxides are reduced not only in the catalytic<br />
converter, but also in the exhaust manifold between the<br />
cylinder and the converter. Two methods of NOx reductions were<br />
isolated: the SNR process (Selective Non-Catalytic Reduction)<br />
taking place outside the converter, and the SCR process (Selective<br />
Catalytic Reduction) in the catalytic converter. To evaluate<br />
the effects of NOx reductions, several definitions of various NO x<br />
reduction efficiency measures have been introduced. The main<br />
conclusions drawn from the experiments are as follows:<br />
1. The results indicate that the total efficiency of the NO x reduction<br />
depended mainly on the efficiency of Selective Non-Catalytic<br />
Reduction (SNR). The additio<strong>na</strong>l fuel dose volume,<br />
engine speed and engine load were influential factors. Better<br />
effects were observed at lower engine speeds.<br />
2. The influence of the fuel post-injection angle on the NO x<br />
reduction efficiency was the strongest when the additio<strong>na</strong>l fuel<br />
dose was injected close to the TDC. In such a case better<br />
effects were obtained from the SNR process, but with a negative<br />
effect in the converter. As a result, the total effect of the<br />
reduction practically did not depend on the fuel post-injection<br />
angle. Injection of the additio<strong>na</strong>l portion of fuel too close to<br />
the TDC is, however, not allowed because of the possible autoignition<br />
of diesel fuel. This would lead to a rapid increase in<br />
the exhaust gas temperature and possible damage to the converter.<br />
In view of the above, and considering also an effective<br />
use of the reducing agent (which has an effect on diesel fuel<br />
consumption), it would be more advantageous to inject the<br />
additio<strong>na</strong>l fuel dose at crank angles between 120 and 160 °<br />
ATDC. These values do not have to be the optimum values for<br />
different operating conditions of the engine (engine load and<br />
engine speed), and for other engines.<br />
3. The tests conducted at two different engine speeds and constant<br />
engine load showed that the influence of the additio<strong>na</strong>l<br />
fuel dose volume, and the HC 1 /NO x ratio before the converter,<br />
on the efficiency of NO x reduction in the catalytic converter<br />
SCR is rather small. This influence could be, however, more<br />
visible in different operating conditions of the test engine. The<br />
resultts obtained from the study justify the conclusion that<br />
there is a need for further research into a catalytic system which<br />
would feature higher activity and better selectivity, and could<br />
be used in the converter. Some parameters, such as the reaction<br />
time, may be also optimized by adjusting the volume of<br />
the converter to the volume and rate of flow.<br />
4. A strong influence of the space velocity of exhaust gas flowing<br />
through the converter on the efficiency of selective catalytic<br />
reduction of nitrogen oxides taking place inside the converter<br />
was found. By reducing this velocity, the efficiency of NOx<br />
catalytic reduction was raised.<br />
5. In order to optimize the efficiency of NO x reduction, the temperature<br />
of exhaust gas before the converter should be maintained<br />
in a strictly defined range.<br />
6. The influence of fuel composition on the efficiency of selective<br />
non-catalytic reduction of nitrogen oxides turned out to be<br />
rather low. However, a stronger influence of fuel type on the<br />
efficiency of catalytic reduction taking place in the converter<br />
was observed. It was determined that fuels containing more<br />
aromatic hydrocarbons provide better opportunities in terms<br />
of the effectiveness of selective catalytic reduction of nitrogen<br />
oxides.<br />
References<br />
[1] BOEHMAN A. L.: Numerical Modeling of NO Reduction Over Cu-ZSM-5 Under Lean Conditions. SAE Transactions 1997, nr 930735,<br />
pp. 11-17.<br />
[2] CENTI G., GALLI A.: Mono and Polynuclear Cu Species in ZSM-5. Nature and Reactivity in the Reduction of NO in the Presence of<br />
Various Reductants. 12 th Inter<strong>na</strong>tio<strong>na</strong>l Zeolite Conference. 1999 Materials Research Society, s. 1359-1366.<br />
[3] CISEK J., SZLACHTA Z., WCISŁO G.: Ograniczenie emisji tlenków azotu w spali<strong>na</strong>ch silnika wysokoprężnego przez zmniejszenie<br />
ich powstawania w komorze spalania. Problemy Eksploatacji, 1999, nr 3, s. 9-21.<br />
[4] CISEK J., SZLACHTA Z., WCISŁO G.: Ograniczenie emisji tlenków azotu w spali<strong>na</strong>ch silnika wysokoprężnego za pomocą konwertorów<br />
katalitycznych. Problemy Eksploatacji, 1999, nr 3, s. 23-33.<br />
[5] DARKOWSKI A., KRUCZYŃSKI S.: Badania <strong>na</strong>d katalityczną redukcją NO x w spali<strong>na</strong>ch silników o zapłonie samoczynnym. Chemia<br />
i Inżynieria Ekologicz<strong>na</strong>, nr 5-6, 1998, s. 397-403.<br />
[6] ENGLER B.H., LEYRER J., LOX E. S., OSTGATHE K.: Catalytic Reduction of NO x with Hydrocarbons Under Lean Diesel Exhaust<br />
Gas Conditions. SAE Transactions, 1993, nr 930735, s. 535-561.<br />
[7] DARKOWSKI A., KRUCZYŃSKI S.: Badania selektywnej katalitycznej redukcji tlenków azotu <strong>na</strong> katalizatorach opartych o metale<br />
szlachetne. KONES’98, s. 92-97.<br />
[8] HAMADA H.: Selective reduction of NO by hydrocarbons and oxyge<strong>na</strong>ted hydrocarbons over metal oxide catalysts. Catal. Today, 1994,<br />
22, 21.<br />
[9] HAVENITH C., VERBEEK R. P., HEATON D. M., SLOTEN P.: Development of a Urea DeNO x Catalyst Concept for European Ultra-<br />
Low Emission Heavy-Duty Diesel Engines. SAE Transactions, 1995, nr 952652, s. 675-684.<br />
34 ● KOMUNIKÁCIE / COMMUNICATIONS 1/2003
C O M M U N I C A T I O N S<br />
I S<br />
[10] HEIMRICH M. J.: Demonstration of Lean NO x Catalytic Converters Technology on a Heavy-Duty Diesel Engines. SAE Transactions,<br />
1997, nr 970750, s. 232-292.<br />
[11] IWAMOTO M., YAHIRO H.: Novel catalytic decomposition and reduction of NO. Catalysis Today, 1994, nr. 22, s. 5.<br />
[12] KONNO M., CHIKAHISA T., MURAYAMA T., IWAMOTO M.: Catalytic Reduction of NO x in Actual Diesel Engine Exhaust. SAE<br />
Transactions, 1992, nr 920091, 11-18.<br />
[13] KÖNIG A., RICHTER T., JOBSON E., PREIS M., LEVERONI E., KRUTZSCH B., NOIROT R., CHEVRIER M.: LeaNO x .<br />
Ergebnisse eines europäischen Forschungsvorhabens zur katalytichen Stickoxidumsetzung in magerem Abgas. 17-Wiener Motoren Symposium<br />
1996, s.354-369.<br />
[14] LEYRER J., LOX E. S., STREHLAU W.: Design Aspects of Lean NO x Catalysts for Gasoline and Diesel Engine Applications. SAE<br />
Transactions, 1995, nr 952495, 1622-1643.<br />
[15] NAJBAR W., BIAŁAS A.: Katalitycz<strong>na</strong> konwersja tlenków azotu do azotu. Ogólnopolskie Semi<strong>na</strong>rium dot. Katalitycznej Dezaktywacji<br />
Tlenków Azotu. Rabka 1994, s. 25-34<br />
[16] PISCHINGER F. F.: Tendencje rozwojowe silników o zapłonie samoczynnym do samochodów osobowych. Biuletyn Instytutu Technologii<br />
Nafty w Krakowie, 1996, nr 3/96, s. 32-47.<br />
[17] PRIGENT M.: Catalytic Automotive Exhaust Gas Depollution: Present Status and New Trends. Journėe de Contact en Catalyse de la<br />
Commu<strong>na</strong>utė Francaise de Belgique: “Catalyse par les mėtaux” la 7 Dėcembre 1995, Bruxelles,<br />
[18] SCHÖPPE D., HOSP W., ZÜRBIG J., METHES W.: Ein geregeltes Abgas<strong>na</strong>chbehandlungssystem zur Erfüllung zukünftiger Emissionsgrenzwerte<br />
bei PKW-Dieselmotoren. 17-Wiener Motoren Symposium 1996, s.332-353.<br />
[19] SZLACHTA Z., WCISŁO G.: Ograniczanie zawartości tlenków azotu w spali<strong>na</strong>ch silnika wysokoprężnego za pomocą węglowodorów<br />
zawartych w paliwie. Projekt badawczy KBN (promotorski), nr 9 T12D 035 14. Kraków 2001.<br />
[19] WCISŁO G.: Istota działania konwertorów katalitycznych używanych do redukcji NO x w metodzie selektywnej katalitycznej redukcji<br />
SCR. Teka Komisji Naukowo-Problemowej Motoryzacji przy Krakowskim Oddziale PAN. Kraków 2000, z.21, s. 237 - 244.<br />
[20] WCISŁO G., SZLACHTA Z.: Konwertory katalityczne do redukcji tlenków azotu w spali<strong>na</strong>ch silników wysokoprężnych. Teka Komisji<br />
Naukowo-Problemowej Motoryzacji przy Krakowskim Oddziale PAN. Kraków 2000, z.21, s. 225 - 236.<br />
[21] ZABŁOCKI M., SZLACHTA Z., CISEK J., WCISŁO G.: Badania możliwości zmniejszenia koncentracji tlenków azotu w spali<strong>na</strong>ch<br />
silnika wysokoprężnego przez selektywną katalityczną redukcję NO x za pomocą węglowodorów oleju <strong>na</strong>pędowego jako czynnika redukującego.<br />
Projekt badawczy KBN, nr 9 T12D 035 14. Kraków 2000. Sprawozdanie Politechniki Krakowskiej nr 540/KBN/2000.<br />
[22] WCISŁO G.: Ograniczanie zawartości tlenków azotu w spali<strong>na</strong>ch silnika wysokoprężnego za pomocą węglowodorów zawartych w<br />
paliwie. Praca doktorska. Kraków 2001.<br />
KOMUNIKÁCIE / COMMUNICATIONS 1/2003 ●<br />
35
C O M M U N I C A T I O N S<br />
I S<br />
Oldřich Polách *<br />
O KONŠTRUKCII POJAZDOV S RADIÁLNE NATÁČANÝMI<br />
DVOJKOLESIAMI<br />
ON THE DESIGN OF RUNNING GEARS WITH RADIAL STEERING WHEEL SETS<br />
Zníženie hlučnosti koľajových vozidiel môže byť dosiahnuté vhodnou konštrukciou ich podvozkov a pojazdov. Dvojkolesia <strong>na</strong>táčané do<br />
radiálnej polohy zamedzujú pískanie v oblúkoch koľaje. Okrem toho znižujú priečne sily medzi kolesom a koľajnicou aj ich opotrebenie. Konštrukčné<br />
zásady pre vývoj vzájomne viazaných, samočinne sa <strong>na</strong>táčajúcich dvojkolesí sú uvedené <strong>na</strong> príkladoch podvozkov pre nové článkové<br />
vozidlá TEŽ a spojené jednonápravové pojazdy FEBA pre predmestské súpravy NSB Class 72 firmy Bombardier Transportation Winterthur.<br />
Noise reduction of railway vehicles can be reached by suitable design of their bogies and running gears. Radial steering wheel sets avoid<br />
curve squeal. Besides they reduce lateral forces between the wheel and rail and their wear. Design principles for the development of interconnected<br />
self-steering wheel sets are introduced on examples of bogies for new articulated vehicles TEŽ and coupled single-axle running gears<br />
FEBA for commuter trains NSB Class 72 from Bombardier Transportation Winterthur.<br />
1. Environmental design of bogies and running<br />
gears for railway vehicles<br />
The influence of railway vehicles on the environment has to<br />
be considered in their design. Noise reduction is an important issue,<br />
which can be influenced by the design of bogies and running gears<br />
[1]. More than the rolling noise and impact noise on crossings,<br />
high level curve squeal in tight curves with a small curve radius<br />
annoys people who live in the vicinity of a railway line. Curve<br />
squeal is the intense to<strong>na</strong>l noise caused by wheel vibration when<br />
entering the curve [2]. The modelling and calculation of curve<br />
squeal noise generation is referenced in [3]. The excitation mechanism<br />
essentially generates lateral forces due to frictio<strong>na</strong>l instability.<br />
It is connected with lateral stick-slip motion between wheel<br />
and rail when running through a curve. The lateral creep (slip) s y<br />
is proportio<strong>na</strong>l to the angle of attack (Fig. 1)<br />
s y u y<br />
v t an <br />
tan (1)<br />
v v<br />
with u y lateral creep (slip) velocity<br />
v vehicle speed<br />
angle of attack.<br />
Reducing the angle of attack, lateral slip is reduced and the<br />
curve squeal can be avoided or at least reduced. Even when a conventio<strong>na</strong>l<br />
bogie does not squeal in a curve, the wheel-rail noise of<br />
a radial steering wheel set is lower than of a conventio<strong>na</strong>l one. The<br />
measured difference in a curve with 400 m radius reaches 3–4 dB(A)<br />
[1]. Wheel sets steered in curve into the radial position not only<br />
prevent curve squeal, they also lower track fatigue reducing the<br />
lateral wheel-rail forces and reduce the wear of wheels and rails,<br />
which is proportio<strong>na</strong>l to the friction work A R related to one meter<br />
of rail length<br />
A R ⏐X s x ⏐ ⏐Y s y ⏐ ⏐⏐ (2)<br />
with X longitudi<strong>na</strong>l force between the wheel and rail<br />
Y lateral force between the wheel and rail<br />
s x , (s y ) longitudi<strong>na</strong>l (lateral) creep in the wheel-rail contact<br />
moment around the normal axis to the contact plane<br />
spin creep in wheel-rail contact (rotation around the<br />
normal axis to the contact plane).<br />
To achieve radial adjustment of wheel sets, passive or active<br />
systems can be used. Less expensive passive systems can be divided<br />
into<br />
● self-steering wheel sets with soft guidance<br />
● inter-connected wheel sets<br />
● force-steering wheel sets.<br />
The self-steering wheel sets are characterised by soft wheel set<br />
guidance between the axle and bogie frame. The steering effect is<br />
based on the longitudi<strong>na</strong>l creep forces between the wheel and rail<br />
due to differences in the rolling path and rolling radius of the left<br />
and right wheel. The steering effect is sensitive to the conditions<br />
in the wheel-rail contact. Because of conflicting demands of selfsteering<br />
and stability, the steering effect of wheel sets with soft<br />
guidance as well as maximum speed of vehicle are limited.<br />
Inter-connected wheel sets use the same effect, but increased<br />
by the forces and moments in their coupling. They can achieve<br />
* Doc. Ing. Oldřich Polách, PhD.<br />
Bombardier Transportation Ltd, Zürcherstraße 41, CH-8401 Winterthur, Switzerland, oldrich.polach@ch.transport.bombardier.com<br />
36 ● KOMUNIKÁCIE / COMMUNICATIONS 1/2003
C O M M U N I C A T I O N S<br />
I S<br />
higher speed and better steering ability compared with soft guided<br />
wheel sets without coupling.<br />
The steering mechanism of force-steering wheel sets uses the<br />
movement between the bogie frame and carbody or between two<br />
carbodies to adjust the wheel sets. The system is sensitive to the<br />
exact geometry of steering mechanism.<br />
Bogies and running gears with radial steering wheel sets reduce<br />
mainte<strong>na</strong>nce costs caused by wear and track fatigue and meet<br />
recommendations for an environmental friendly design. Design<br />
principles and construction of self steering inter-connected wheel<br />
sets will be introduced on examples of bogies for articulated vehicles<br />
GTW and coupled single-axle running gears FEBA of Norwegian<br />
commuter trains Class 72 from Bombardier Transportation Winterthur.<br />
2. Bogies with coupled wheel sets<br />
The longitudi<strong>na</strong>l axle guidance of self-steering wheel sets has<br />
to be very soft to allow radial adjustment by creep forces in the<br />
wheel-rail contact. In spite of this, the transmission of traction<br />
and braking forces should not lead to large longitudi<strong>na</strong>l wheel set<br />
movement. Besides, a conventio<strong>na</strong>l bogie design with soft axle guidance<br />
reduces the stability limit significantly.<br />
These contradictions can be solved by the coupling of wheel<br />
sets as shown symbolically in Fig. 2. The bending stiffness k B2<br />
acts in parallel to the equivalent bending (steering) stiffness k B1 of<br />
the axle guidance and primary suspension<br />
k B1 w 2 P k Px (3)<br />
with k Px<br />
w P<br />
– longitudi<strong>na</strong>l stiffness of axle guidance and primary<br />
suspension (per wheel)<br />
– half distance of axle guidance in lateral direction.<br />
The lateral coupling stiffness k S2 acts in parallel to the equivalent<br />
shear stiffness k S1 of the axle guidance and primary suspension<br />
kB1 k P y<br />
k S1 kB1 b 2 (4)<br />
k Py<br />
with k Py – lateral stiffness of axle guidance and primary suspension<br />
(per wheel)<br />
b – half wheel set base in longitudi<strong>na</strong>l direction.<br />
There are various examples of bogies with self steering wheel<br />
sets which are coupled with each other. A steering mechanism<br />
with transverse shaft transmitting the longitudi<strong>na</strong>l forces between<br />
the wheel sets and bogie frame [4], [5] is implemented in locomotives<br />
Re 460 of the Swiss Federal Railways (SBB) for maximum<br />
speed of 230 km/h. An application of a similar mechanism in<br />
newly developed modular locomotive bogies is described in [6].<br />
In Slovakia, coupled self-steering wheel sets are used in the<br />
new vehicles series 425.95 (Fig. 3) on TEŽ metre-gauge line in the<br />
High Tatras. The articulated vehicles are produced by ŽOS Vrútky<br />
in co-operation with the Swiss manufacturer Stadler and Bombardier<br />
Transportation works in Switzerland. The bogies are delivered<br />
by Bombardier Transportation Winterthur. This type of vehicle<br />
called GTW was first produced by Stadler in 1995. The GTW<br />
vehicles with the bogies from Bombardier Transportation [7], [8],<br />
[9] are now in service in Germany, USA, Switzerland and Slovakia<br />
on standard and <strong>na</strong>rrow gauge lines.<br />
The trailer bogies (Fig 4a) are particularly suited to extreme<br />
track distortion because their torsio<strong>na</strong>lly elastic bogie frame means<br />
lower wheel unloading. The braking forces are transmitted by<br />
a traction rod which connects the wheel set directly with carbody<br />
without acting on the primary suspension. Two secondary air<br />
springs and lateral and longitudi<strong>na</strong>l dampers ensure a quiet ride<br />
comfort. The lateral coupling of wheel sets by axle-hung supports<br />
results in their good radial alignment with less wear of wheel as<br />
well as smooth negotiation of <strong>na</strong>rrow curves without squeal. The<br />
traction running gear (Fig. 4b) is especially designed to fit short<br />
traction modules of articulated vehicles like the GTW. The innovative<br />
lightweight construction allows elimi<strong>na</strong>ting bogie frame. The<br />
body of traction unit is suspended by helical springs directly on<br />
the axle boxes. Two axle-hung motor gear units, suspended from<br />
the carbody, are connected by lateral coupling. In this way the<br />
lateral coupling of wheel sets is realised and its self-steering ability<br />
improved similar as on the trailer bogie. A traction rod between<br />
the motor gear unit and the body of the traction unit transfers the<br />
tractive and braking forces.<br />
<br />
To achieve good self steering ability together with high stability,<br />
the bending stiffness k B2 must be very low or zero, but the<br />
lateral (shear) coupling must be very stiff. In addition, the transmission<br />
of traction and braking forces should be separated and<br />
should not influence the steering of the wheel sets.<br />
<br />
<br />
Fig. 1 Bogie with stiff axle guidance in a curve<br />
KOMUNIKÁCIE / COMMUNICATIONS 1/2003 ●<br />
37
C O M M U N I C A T I O N S<br />
I S<br />
Radial adjustment of GTW wheel sets in curves was proven<br />
by measurement of steering angle between the wheel sets of the<br />
trailer bogie. The ideal steering angle can easily be calculated from<br />
the curve radius and bogie geometry (assuming a tangential bogie<br />
position, Fig. 1) as<br />
2 2 b <br />
R<br />
angle comes to the ideal steering angle, the better the wheel sets<br />
align themselves. The measurements statistically confirm a good<br />
radial alignment of the wheel sets. The slope of the regression line<br />
of all measured points for the curve range between the radius of<br />
100 m and infinite (straight line) reaches 70% of the ideal value<br />
compared with rigid axle guidance bogies.<br />
with R<br />
– curve radius.<br />
Fig. 2 Bogie with inter-connected wheelsets<br />
3. Coupled single-axle running gears<br />
The coupled single-axle running gears called FEBA have been<br />
developed by Bombardier Winterthur as a modern solution for<br />
regio<strong>na</strong>l service. They were chosen by the Norwegian State Railways<br />
for the new electrical units Class 72 (Fig. 6). The four-part<br />
commuter train with a top speed of 160 km/h was built by a consortium<br />
of ANSALDOBREDA (Italy) and Bombardier Transportation<br />
Winterthur. The coupled single-axle running gears FEBA are<br />
used similarly to Jakob-bogies of articulated vehicles. Two each<br />
running gears are coupled beneath the coach ends of the centre<br />
coach. On the ends of the composition, motor bogies e<strong>na</strong>bling<br />
radial steering of the wheel sets by way of soft wheel set guidance<br />
are used.<br />
The coupled single-axle running gears ideally unite the characteristics<br />
of bogie and single-axle. They can be utilised independent<br />
of the type of carbody coupling. In difference to Jakob-bogies, easy<br />
Fig. 3 Vehicle GTW (from German “Gelenktriebwagen”) TEŽ series 425.95 (drawing Stadler)<br />
a) b)<br />
Fig. 4 Bogies of GTW-vehicles: trailer bogie (a) and traction running gear (b)<br />
Values of steering angle measured on GTW-vehicles of metregauge<br />
Swiss private railways BTI [8] are shown in Fig. 5. The measured<br />
vehicles have the same design and similar running conditions<br />
as the vehicles TEŽ 425.95. The closer the measured steering<br />
and fast uncoupling of the individual cars for mainte<strong>na</strong>nce purposes<br />
is still guaranteed without the necessity of auxiliary bogies.<br />
The design of the running gears is based on components already<br />
extensively tried and utilised in railway vehicles (Fig. 7). The<br />
38 ● KOMUNIKÁCIE / COMMUNICATIONS 1/2003
C O M M U N I C A T I O N S<br />
I S<br />
<br />
carbody, and also support it against pitching. The vertical, lateral<br />
and longitudi<strong>na</strong>l dampers ensure quiet running behaviour.<br />
The technical principle of the coupling of single-axle running<br />
gears is shown in Fig. 8. The running gears are coupled by way of<br />
two horizontal parallel-aligned traverse rods, so that the single<br />
running gears can move towards each other in a longitudi<strong>na</strong>l and<br />
vertical direction. The yaw stiffness k z of the running gears coupling<br />
around the vertical axis is determined by the radial stiffness<br />
of the spherical rubber elements k rad and by the longitudi<strong>na</strong>l distance<br />
l of the coupling rods<br />
2<br />
k z l k<br />
4 rad (5)<br />
The lateral stiffness k y of the running gears coupling is<br />
k y k rad (6)<br />
Fig. 5 Measured steering angles between the wheelsets<br />
of the metre-gauge GTW trailer bogie on BTI-line in Switzerland<br />
Apart from the important parameters given in the equations<br />
(5) and (6), the torsio<strong>na</strong>l stiffness of the spherical rubber element<br />
and the flexibility of the frames of both running gears should be<br />
taken into account in the exact layout of the yaw stiffness and the<br />
lateral stiffness of the running gears coupling.<br />
Fig. 6 A half of the four-part commuter train Class 72 of Norwegian Railways<br />
primary suspension is constituted by rubber Chevron springs. Air<br />
springs with an auxiliary air volume serve as the secondary suspension.<br />
The braking force transmission is realised by two traction<br />
rods (Fig. 9), which couple each running gear longitudi<strong>na</strong>lly on its<br />
The coupling of the running gears e<strong>na</strong>bles optimum running<br />
behaviour during curving and increases the running stability [10].<br />
In comparison with a Jakob-bogie, both running gears demonstrate<br />
a high torsio<strong>na</strong>l flexibility towards each other, providing better<br />
safety against derailment on bad track quality.<br />
Fig. 7 The serial single-axle running gear<br />
of NSB commuter train Class 72<br />
Fig. 8 Principal of the single-axle running gears coupling using<br />
two parallel lateral rods<br />
KOMUNIKÁCIE / COMMUNICATIONS 1/2003 ●<br />
39
C O M M U N I C A T I O N S<br />
I S<br />
<br />
<br />
<br />
Fig. 9 Simulation model of coupled single-axle running gears<br />
FEBA in SIMPACK<br />
<br />
<br />
Through the coupling of the single-axle running gears, a combi<strong>na</strong>tion<br />
of force-steering and inter-connected steering of the wheel<br />
sets is achieved. Due to yawing of the running gear versus the<br />
carbody during curving the longitudi<strong>na</strong>l stiffness of the secondary<br />
suspension acts in one direction, the yaw stiffness of the coupling<br />
k z in the opposite direction. The single-axle running gear balances<br />
itself out in a position which lies between the stiff steered wheel<br />
set of a two-axle-vehicle and the wheel set of a Jakob-bogie with<br />
rigid axle guidance. If a sufficiently soft yaw stiffness of the running<br />
gear coupling is chosen, the wheel sets possess additio<strong>na</strong>l freedom<br />
to steer themselves even better in the radial position through the<br />
effect of the longitudi<strong>na</strong>l creep forces between wheel and rail.<br />
Fig. 10 illustrates the forces and moments acting on the single-axle<br />
running gear. The longitudi<strong>na</strong>l stiffness of the primary suspension<br />
is assumed as being very high (approx. rigid). Let us assume that<br />
the wheel set is in a radial position and no creep forces are influencing<br />
the wheels in a longitudi<strong>na</strong>l direction. Without the effect<br />
of the forces between wheel and rail, the wheel set would remain<br />
in the radial position if the effective moments in the secondary<br />
suspension and in the coupling M are balanced out<br />
with F S<br />
Fig. 10 Forces and moments acting on the coupled single-axle<br />
running gears during curving<br />
M 2 F S w S (7)<br />
w S<br />
– longitudi<strong>na</strong>l force in secondary suspension<br />
– half lateral distance of secondary suspension.<br />
If the secondary suspension is of symmetrical design, the longitudi<strong>na</strong>l<br />
stiffness resembles the lateral stiffness, whereby the lateral<br />
stiffness is determined as a result of running comfort optimisation.<br />
For the given longitudi<strong>na</strong>l and lateral stiffness, we can determine<br />
from equation (7) the optimum yaw stiffness of the running<br />
gear coupling from the curving point of view<br />
k y [kN/mm]<br />
km/h<br />
k Py [kN/mm]<br />
km/h<br />
k φz [kNm/mrad]<br />
k Px [kN/mm]<br />
a) b)<br />
Fig. 11 Influence of the coupling of single-axle running gears (a) and their primary axle guidance stiffness (b) on the critical speed<br />
40 ● KOMUNIKÁCIE / COMMUNICATIONS 1/2003
C O M M U N I C A T I O N S<br />
I S<br />
a<br />
k z Opt 2 b w S 2 k Sx (8)<br />
with k Sx – longitudi<strong>na</strong>l stiffness of secondary suspension.<br />
If the equation (8) is fulfilled, the single-axle running gears<br />
will be radially steered during curving by the forces in the secondary<br />
suspension and in the wheel set coupling.<br />
The coupling of the single-axle running gears increases the<br />
running stability too. The influence of primary suspension and of<br />
running gears coupling was investigated by parameter a<strong>na</strong>lysis on<br />
a half train simulation model (Fig. 9). The a<strong>na</strong>lysis results are represented<br />
with stability contour plots for a residual damping D <br />
0% at a conicity of 0.4 (upper conicity limit for the testing and<br />
acceptance of the vehicle according to UIC-518 for a maximum<br />
speed between 140 and 200 km/h), see Fig. 11. The stability<br />
increases with the gaining of yaw stiffness k z and the lateral stiffness<br />
k y of the running gear coupling. In order to achieve a radially<br />
steering design, the yaw stiffness k z should be in the vicinity of<br />
the value according equation (8), therefore relatively low. Under this<br />
condition the stability can only be increased changing the lateral<br />
coupling stiffness k y . In the primary suspension, a more important<br />
role is played by the longitudi<strong>na</strong>l stiffness k Px of the axle guidance.<br />
The lateral stiffness k Py has a subordi<strong>na</strong>te role.<br />
<br />
Fig. 12 Measured values of steering angle between the wheelsets<br />
of coupled single-axle running gears in comparison with calculated<br />
ideal value<br />
The theoretical a<strong>na</strong>lyses carried out determine the design philosophy<br />
of the coupled single-axle running gears. The stiffness of<br />
the secondary suspension k Sx k Sy , defined by running comfort<br />
properties, can be used for calculating the yaw stiffness k z of the<br />
running gears coupling required in respect to curving according<br />
equation (8). Looking on the coupling of running gears, an increase<br />
of the critical speed can be achieved by increasing the lateral stiffness<br />
of the coupling k y . An increase of the yaw stiffness k z would<br />
improve stability as well, but the value of k z is limited by the<br />
curving properties as already mentioned. The longitudi<strong>na</strong>l axle guidance<br />
and primary stiffness k Px , should be stiff. The lateral axle<br />
guidance and primary stiffness k Py can be relatively soft to reduce<br />
the lateral dy<strong>na</strong>mic forces between wheel and rail.<br />
Prior to series application of the coupled single-axle running<br />
gears FEBA, two prototype running gears were subjected to extensive<br />
tests [11], [12]. The test runs have completely confirmed the<br />
anticipated running characteristics. The capability of the running<br />
gears to steer themselves radially in a curve was judged by measuring<br />
the steering angle (Fig. 12) between the wheel sets of the<br />
coupled running gears. The measurements confirmed almost ideal<br />
radial steering ability in curves with radii between 300 m and<br />
500 m. The slope of the regression line reaches 84% of the ideal<br />
value. Subsequently, the wheel-rail forces are low as described in<br />
[12]. The vehicle type tests in autumn 2000 and summer 2001<br />
demonstrated the fulfilment of the anticipated design results and<br />
the compliance with the limit values.<br />
4. Conclusion<br />
Bogies and running gears with radial steering wheel sets reduce<br />
mainte<strong>na</strong>nce costs caused by wear and track fatigue and meet recommendations<br />
for environment friendly design. To achieve steering<br />
ability of a two-axle bogie, the longitudi<strong>na</strong>l guidance between<br />
the axle and bogie frame have to be soft. A lateral coupling between<br />
the wheel sets increases the stability and improves the curving<br />
properties of soft guided wheel sets. Traction and braking forces<br />
between the axle and bogie frame have to by-pass the axle guidance<br />
to avoid a negative influence on the self-steering effect. The<br />
principles mentioned were used by Bombardier Transportation<br />
Winterthur when developing the bogies for articulated GTW-vehicles.<br />
In Slovakia, these bogies are used in the new vehicles TEŽ<br />
series 425.95.<br />
The coupled single-axle running gears FEBA developed by<br />
Bombardier Transportation Winterthur for the four-part commuter<br />
trains Class 72 of the Norwegian State Railways ideally unite the<br />
characteristics of bogie and single-axle. Through the coupling of<br />
the single-axle running gears, a combi<strong>na</strong>tion of force-steering and<br />
inter-connected steering of the wheel sets is achieved with almost<br />
ideal radial steering ability in curves with radii between 300 m and<br />
500 m. They can be utilised similarly to Jakob-bogies of articulated<br />
vehicles, but in contradiction to them they are independent<br />
of the type of carbody coupling and guaranty a fast uncoupling of<br />
the individual cars for mainte<strong>na</strong>nce purposes.<br />
Bogies and running gears with radial steering wheel sets clearly<br />
surpass the conventio<strong>na</strong>l design solutions, particularly on track<br />
with a high number of curves.<br />
KOMUNIKÁCIE / COMMUNICATIONS 1/2003 ●<br />
41
C O M M U N I C A T I O N S<br />
I S<br />
References<br />
[1] POLÁCH, O.: Železnice a hluk – stav, perspektivy, možnosti. In.: Proceedings „Člověk a doprava“, Loučeň u Nymburka 1993, part 2,<br />
pp. 91-104<br />
[2] HECHT, M.: Kurvenkreischen – Ursachen und Gegenmass<strong>na</strong>hmen. Schweizer Eisenbahn-Revue, No. 3/1995, pp. 103-108<br />
[3] THOMPSON, D. J.; JONES, C. J. C.: A review of modelling of wheel-rail noise generation. Jour<strong>na</strong>l of Sound and Vibration (2000),<br />
No. 3, pp. 519-536<br />
[4] POLÁCH, O.: Lok 2000 aneb vysoké rychlosti <strong>na</strong> švýcarský způsob. In.: Proceedings „železniční vozidla“, Loučeň u Nymburka 1992,<br />
part 2, pp. 111-115<br />
[5] POLÁCH, O.: Švýcarská lokomotiva SBB 460. Železnice, No. 5/1993, pp. 16-17<br />
[6] POLÁCH, O.: Optimierung moderner Lok-Drehgestelle durch fahrzeugdy<strong>na</strong>mische Systema<strong>na</strong>lyse. Eisenbahningenieur (53), No.<br />
7/2002, pp. 50-57<br />
[7] POLÁCH, O: Pojezdy a kolejová vozidla firmy SLM pro atraktivní regionální dopravu. In: Proceedings of the 13th Inter<strong>na</strong>tio<strong>na</strong>l Conference<br />
Current Problems in Rail Vehicles, Česká Třebová 1997, pp. 41-51<br />
[8] MEIER, B.; POLÁCH, O.; GROSSENBACHER, Th.: Leichtbau-Fahrwerke für den Regio<strong>na</strong>lverkehr. Schweizer Eisenbahn-Revue,<br />
No. 7-8/1998, pp. 306-312, Eisenbahn-Revue Inter<strong>na</strong>tio<strong>na</strong>l, No. 7-8/1998, pp. 306-312<br />
[9] MEIER, B.; POLÁCH, O.: Erfahrungen mit Leichtbau-Fahrwerken für den Regio<strong>na</strong>lverkehr. In: Proceedings of the 4th Inter<strong>na</strong>tio<strong>na</strong>l<br />
Conference on Railway Bogies and Running Gears, Budapest 1998, pp. 37-46<br />
[10] POLÁCH, O: Coupled single-axle running gears - a new radial steering design. Proceedings of the Institution of Mechanical Engineers,<br />
Part F, Jour<strong>na</strong>l of Rail and Rapid Transit, 216 (2002), No. F3, pp. 197-206<br />
[11] POLÁCH, O; MEIER. B.: Erprobung der Einzelachsfahrwerke FEBA. In: Proceedings of the 14th Inter<strong>na</strong>tio<strong>na</strong>l Conference Current<br />
Problems in Rail Vehicles, Žili<strong>na</strong> 1999, Vol. 2, pp. 67-74<br />
[12] POLÁCH, O., KRAFT, D.: Gekoppelte Einzelachsfahrwerke FEBA mit Radialeinstellung erfolgreich erprobt. Eisenbahn-Revue Inter<strong>na</strong>tio<strong>na</strong>l,<br />
1999, No. 10, pp. 424-429<br />
42 ● KOMUNIKÁCIE / COMMUNICATIONS 1/2003
C O M M U N I C A T I O N S<br />
I S<br />
Juraj Gerlici – Tomáš Lack *<br />
ANALÝZA GEOMETRIE ŽELEZNIČNEJ KOĽAJE<br />
(Z POHĽADU JEJ OPOTREBENIA V PREVÁDZKE)<br />
RAIL GEOMETRY ANALYSIS<br />
(FROM THE POINT OF VIEW OF WEARING IN THE OPERATION)<br />
A<strong>na</strong>lýza železničnej koľaje z pohľadu jej opotrebenia v prevádzke je<br />
otázka je otázka súčasnej praxe prevádzky koľajových vozidiel. Dôsledky<br />
negatívneho pôsobenia sa odrážajú aj <strong>na</strong> stave životného prostredia.<br />
Na hodnotenie miery <strong>vplyvu</strong> sa používajú rôzne metódy. Opotrebenie<br />
železničnej trate je možné hodnotiť rôznym spôsobom. Jednou z metód<br />
je vyhodnocovanie geometrických charakteristík kontaktu kolesa a koľajnice.<br />
Dôležité informácie o prevádzkovom stave železničnej trate sú<br />
Delta R funkcia, Tangens Gama funkcia, efektív<strong>na</strong> kuželovitosť, ekvivalentná<br />
kuželovitosť, profil koľajnice pri a<strong>na</strong>lýze opotrebenia <strong>na</strong> základe<br />
rozdielu polohy reálnej a teoretickej geometrie.<br />
Základ pre ďalšie hodnotenie stavu trate je vyhodnotenie polohy<br />
jednotlivých profilov kolesa a koľajnice a ich spoločné zobrazenie <strong>na</strong><br />
železničnej trati. Kvalitatívne nedostatočný reálny stav trate je dôvodom<br />
pre potrebnú údržbu trate a zlepšenie kvality geometrie koľaje.<br />
Kľúčové slová: kontakt železničného kolesa s koľajnicou, opotrebenie<br />
koľaje, geometrické charakteristiky koľaje, Delta R funkcia,<br />
Tangens Gama funkcia, efektív<strong>na</strong> kuželovitosť, ekvivalentná kuželovitosť.<br />
Rail geometry a<strong>na</strong>lysis is, from the point of view of wearing in the<br />
operation, the question of present railway vehicles operation practice.<br />
The sequels of negative influence are reflected on the environment<br />
state. For the influence rate assessment various methods are used.<br />
The wearing state of rail road track is possible to assess in different<br />
manners. One of them is the assessment of geometric contact of railway<br />
wheel and rail profile. The significant information on the rail track<br />
operation state are Delta R function, Tangens Gamma function, effective<br />
conicity equivalent conicity, rail profile in the track wear a<strong>na</strong>lysis<br />
on the ground of real and theoretic rail profile geometry position difference.<br />
The fundament for another rail state assessment is the single<br />
wheel/rail profiles position assessment and common displaying in the<br />
railroad track. The poor real track quality state is the reason for necessary<br />
track mainte<strong>na</strong>nce and rail geometry quality improvement.<br />
Key words: railway wheel/rail contact, rail wearing, geometric rail<br />
characteristics, Delta R function, Tangens Gamma function, effective<br />
conicity, equivalent conicity.<br />
1. Úvod<br />
Koľajová doprava je neoddeliteľnou súčasťou nášho bežného<br />
života. Je výz<strong>na</strong>mným faktorom v oblasti hromadnej <strong>dopravy</strong> cestujúcich<br />
a prepravy nákladov. Popri nesporne pozitívnych javoch<br />
ktoré prináša prevádzka vozidiel, hlavne v oblasti ekonomickej,<br />
prispieva svojím dielom aj <strong>na</strong> stav životného prostredia.<br />
V tomto článku zameriame svoju pozornosť <strong>na</strong> oblasť potenciálneho<br />
zdroja hluku, vibrácií, opotrebenia kolies a koľajníc, ako aj<br />
negatívneho <strong>vplyvu</strong> <strong>na</strong> jazdný komfort cestujúcich, pôsobisko kontaktu<br />
železničného kolesa s koľajnicou.<br />
1. Introduction<br />
Rail transport is an inseparable part of our common life. It is<br />
the important factor in the area of mass transport of passengers<br />
and freight transportation. Simultaneously with the indisputably<br />
positive phenome<strong>na</strong> brought about by railway vehicles operation,<br />
mainly in the economy area, it contributes with its own deal to the<br />
environment state too.<br />
In this article, we would like to concentrate our interest to the<br />
potential source of the noise, vibrations, rail and wheel wearing<br />
and negative influence to the ride comfort of the passengers, the<br />
centre of the wheel/rail contact.<br />
2. Základné pojmy<br />
Geometrická os koľaje je spojnica bodov <strong>na</strong>chádzajúcich sa<br />
uprostred vzdialenosti medzi protiľahlými bodmi pojazdných hrán<br />
v rovine priečneho rezu. Pojazdná hra<strong>na</strong> koľajnicového pásu je<br />
spojnica bodov ležiacich <strong>na</strong> vnútornej časti hlavy koľajnice, 14 mm<br />
2. Basic terms<br />
The geometric axis of the rail is the joint of points located in<br />
the middle of the distance between opposite points of the movable<br />
edge in the area of a diago<strong>na</strong>l section. The movable edge of the<br />
rail is the joint of the points lying in a position on the inner part<br />
* Dr. Ing. Juraj Gerlici, Ing. Tomáš Lack<br />
Faculty of Mechanical Engineering, Department of Railway Vehicles, Engines and Lifting Equipment. University of Žili<strong>na</strong>, Moyzesova 20.<br />
SK-01026 Žili<strong>na</strong>. E-mail: juraj_gerlici@kkvmz.utc.sk, tomas_lack@kkvmz.utc.sk<br />
KOMUNIKÁCIE / COMMUNICATIONS 1/2003 ●<br />
43
C O M M U N I C A T I O N S<br />
I S<br />
pod temenom koľajnicového<br />
pása. Rovi<strong>na</strong> priečneho rezu je<br />
zvislá rovi<strong>na</strong>, v pôdoryse kolmá<br />
<strong>na</strong> os koľaje. Temená koľajnicových<br />
pásov sú body dotyku<br />
spoločnej dotyčnice k horným<br />
plochám oboch hláv koľajnicových<br />
pásov ležiacich v rovine<br />
priečneho rezu. Geometrické<br />
Gauge<br />
Obr. 1 Profil hlavy koľajnice<br />
Fig. 1 Rail head profile<br />
usporiadanie koľaje tvorí rozchod koľaje, smerová a výšková poloha<br />
koľajnicových pásov a ich sklon v rovine priečneho rezu. Rozchod<br />
koľaje je vzdialenosť pojazdných hrán koľajnicových pásov meraná<br />
v rovine priečneho rezu. Pozdĺž<strong>na</strong> výška koľajnicových pásov je<br />
výškový priebeh temien koľajnicových pásov. Smer koľajnicového<br />
pása je priebeh pojazdnej hrany koľajnicového pása v pôdoryse.<br />
of the rail head, 14 mm under the<br />
crown of the rail head. The diago<strong>na</strong>l<br />
section area is a vertical area in the<br />
ground plan orthogo<strong>na</strong>l to the rail<br />
axis.<br />
Rail head crowns are contact<br />
points of the common tangent line,<br />
with the upper surfaces of the rail,<br />
lying in the diago<strong>na</strong>l section area. Geometrical<br />
position of the track is created with the gauge of the railways,<br />
directive and altitudi<strong>na</strong>l position and their decli<strong>na</strong>tion in the<br />
diago<strong>na</strong>l section area. The gauge of the railway is the distance of<br />
the movable edges of the rails, measured in the diago<strong>na</strong>l section<br />
area. The longitudi<strong>na</strong>l height of the rail is the height course of the<br />
rail crowns. Direction of the rail is the course of the movable edge<br />
of the rail in the ground area.<br />
3. Profil hlavy železničnej koľajnice<br />
Podľa tvaru plochy obrazca v priečnom reze je možné koľajnice<br />
zaradiť do dvoch skupín. Jednu tvoria koľajnice so širokou<br />
pätou, používané v prevažnej miere pre železničné trate, druhú<br />
koľajnice žliabkové, používané prevažne pri stavbe tratí pre vozidlá<br />
mestskej hromadnej <strong>dopravy</strong>. Najexponovanejšími časťami koľajnice<br />
sú hlava a päta. Hlava je zaťažovaná zvislými, priečnymi a pozdĺžnymi<br />
silami, ktoré vyvodzujú kolesá vozidla, <strong>na</strong> pätu pôsobia<br />
reakčné sily podpôr. Zatiaľ, čo sa päta počas svojej životnosti<br />
takmer vôbec neopotrebuje, hlava koľajnice je zaťažená a opotrebovaná<br />
vo zvislom aj priečnom smere. Koľajnica je opotrebená<br />
v priečnom smere hlavne v oblúkoch <strong>na</strong> vonkajších koľajnicových<br />
pásoch.<br />
V ďalších úvahách sa budeme zaoberať geometriou a zmenou<br />
geometrie hlavy koľajnice so širokou pätou, typu UIC 60.<br />
Zme<strong>na</strong> ideálnej polohy koľajnicových pásov počas prevádzky<br />
vozidiel, nie je <strong>na</strong> celej dĺžke rov<strong>na</strong>ká.<br />
V niektorých miestach sa môže modifikácia prejaviť ako úbytok<br />
materiálu opotrebenie, v niektorých prípadoch ako lokálny prírastok.<br />
Opotrebenie koľaje sa v niektorých prípadoch vyhodnocuje<br />
on-line <strong>na</strong> reálnej trati pri experimentálnom určovaní geometrickej<br />
polohy koľaje. V iných prípadoch sa môže vyko<strong>na</strong>ť a<strong>na</strong>lýza off-line<br />
<strong>na</strong> základe <strong>na</strong>meraných a zaz<strong>na</strong>me<strong>na</strong>ných súborov priečnych profilov<br />
koľajníc. V obidvoch prípadoch sa <strong>na</strong>merané hodnoty profilov<br />
v určenom intervale priečnej súradnice porovnávajú s referenčným<br />
teoretickým profilom koľajnice. Dôležitým parametrom pre určovanie<br />
opotrebenia materiálu koľaje je sklon koľajnicových pásov.<br />
Trate európskych železníc sú stavané hlavne so sklonom 1:40. Na<br />
tratiach Slovenských železníc sa používa sklon 1:20.<br />
3. Rail head profile<br />
In accordance with the shape area in the diago<strong>na</strong>l section it<br />
is possible to classify the rails to two groups. The first group is<br />
created by the rails with wide foot which is used in overwhelming<br />
rate for railway track, the second is created with the grooved rails<br />
used in overwhelming rate for town mass transport. The head and<br />
the foot are maximum force loaded parts of the rail. The head is<br />
loaded with vertical, diago<strong>na</strong>l and longitudi<strong>na</strong>l forces, acting from<br />
vehicle wheels to rail heads. The reaction forces of the supports<br />
act on the rail foot. Meanwhile the rail foot is not during its life<br />
cycle practically worn, the rail head is forced and worn in the vertical<br />
and diago<strong>na</strong>l direction. The rail is worn in the diago<strong>na</strong>l direction<br />
mainly in the curves on outer rails.<br />
Further we will deal with the geometry and change of the foot<br />
rail UIC60 geometry.<br />
Change of the ideal position of the rails during vehicles operations<br />
is not iquel on the whole length. Change can be observed<br />
in some places as a material shrinkage wearing, in some cases<br />
as a local material accumulation. Rail wearing is in some cases<br />
assessed on-line on the real track with the experimental assessment<br />
of the geometrical position of the track. In other cases the<br />
off-line a<strong>na</strong>lysis on the ground of measured and saved lateral rail<br />
profile files can be carried out. The measured values of the profiles<br />
will be in all cases determined with the lateral coordi<strong>na</strong>te<br />
interval compared with the reference rail profile. The canting of<br />
rail is an important parameter for rail material wearing assessment.<br />
The tracks of the European railways are built mainly with<br />
the canting of rail of 1:40. The canting of rail of 1:20 is used on<br />
the Slovak railways.<br />
4. Kontaktné body geometrického profilu železničného<br />
kolesa a koľajnice<br />
Oblasťou intenzívneho pôsobenia síl spôsobujúcich opotrebenie<br />
koľajníc je oblasť kontaktu kolesa a koľajnice.<br />
Prvým krokom vedúcim k identifikácii rozsahu kontaktnej<br />
oblasti je a<strong>na</strong>lytické určenie kontaktných bodov.<br />
4. Wheel and rail profile geometry contact points<br />
The forces inducing the rail wearing act intensively in the<br />
wheel – rail contact area.<br />
The first step leading to contact area range identification is<br />
the a<strong>na</strong>lytical contact point assessment.<br />
44 ● KOMUNIKÁCIE / COMMUNICATIONS 1/2003
C O M M U N I C A T I O N S<br />
I S<br />
Kontaktné body budeme hľadať v rovine kolmej <strong>na</strong> os koľaje<br />
posúvaním profilu kolesa po profile koľajnice v horizontálnom<br />
smere v rozsahu / 10 mm.<br />
Vstupné parametre pre určenie kontaktných bodov sú:<br />
● y R – posunutie dvojkolesia<br />
● z S (y) – funkcia profilu koľajnice<br />
● z R (y) – funkcia profilu kolesa<br />
[Y S (y R ) y]<br />
Z S (y R ) z S (Y S )<br />
T S (y R ) z S (Y S )<br />
dmin(d)<br />
y(kolesokoľajnica)<br />
We will search the contact points in a perpendicular planet to<br />
the rail axis by the shifting wheel profile over rail profile, in the<br />
horizontal direction in the range of / 10 mm.<br />
The input parameters for the contact points evaluations are:<br />
● y R – lateral wheelset displacement<br />
● z S (y) – rail head profile function<br />
● z R (y) – wheel profile function<br />
[Y S (y R ) y]<br />
Z S (y R ) z S (Y S )<br />
T S (y R ) z S (Y S )<br />
dmin(d)<br />
y(wheelrail)<br />
Y R (y R ) Y S y R<br />
Y R (y R ) Y S y R<br />
Z R (y R ) z R (Y R )<br />
T R (y R ) z R (Y R )<br />
Obr. 2 Určenie kontaktného bodu kolesa a koľajnice<br />
Fig. 2 Rail – wheel contact point assessment<br />
Z R (y R ) z R (Y R )<br />
T R (y R ) z R (Y R )<br />
d min (y R ) [d(y, y R )] yYS<br />
d min (y R ) [d(y, y R )] yYS<br />
d min – minimál<strong>na</strong> hodnota funkcie d(y, y R )<br />
Výstupy:<br />
P S [Y S , Z S , T S ] – dotykový bod koľajnice<br />
● Y S – y-ová súradnica dotykového bodu<br />
● Z S – z-ová súradnica dotykového bodu<br />
● T S – smernica dotyčnice v dotykovom bode<br />
P R [Y R , Z R , T R ] – dotykový bod kolesa<br />
● Y R – y-ová súradnica dotykového bodu<br />
● Z R – z-ová súradnica dotykového bodu<br />
● T R – smernica dotyčnice v dotykovom bode<br />
d min – minimum value of the d(y, y R ) function<br />
Outputs:<br />
P S [Y S , Z S , T S ] – contact point of the rail<br />
● Y S – y-coordi<strong>na</strong>te of the contact point<br />
● Z S – z- coordi<strong>na</strong>te of the contact point<br />
● T S – tangent slope in the contact point<br />
P R [Y R , Z R , T R ] – contact point of the wheel<br />
● Y R – y- coordi<strong>na</strong>te of the contact point<br />
● Z R – z- coordi<strong>na</strong>te of the contact point<br />
● T R – tangent slope in the contact point<br />
Obr. 3 Dotykové body železničného kolesa a koľajnice<br />
Fig. 3 Railway wheel and rail geometry contact points<br />
5. Geometrické charakteristiky kontaktu kolesa<br />
a koľajnice<br />
Na základe zistených reálnych dotykových bodov kolesa a koľajnice,<br />
ku ktorým by hypoteticky došlo pri priečnom posúvaní profilu<br />
kolesa po profile koľajnice, je možné určiť geometrické charakteristiky.<br />
5. Geometric characteristics of the wheel and<br />
rail contact<br />
On the base of found real rail and wheel contact points information,<br />
hypothetical contact points can be calculated. The geometric<br />
characteristics can be determined as a result of the lateral<br />
movement of the wheel profile along the transversal rail head profile.<br />
KOMUNIKÁCIE / COMMUNICATIONS 1/2003 ●<br />
45
C O M M U N I C A T I O N S<br />
I S<br />
– Delta R<br />
– Tangens Gama<br />
– efektív<strong>na</strong> kužeľovitosť<br />
– ekvivalentná kužeľovitosť.<br />
Delta R<br />
Predpokladáme, že sa dvojkolesie môže pohybovať v železničnej<br />
koľaji len v smere jazdy vozidla. Os dvojkolesia zviera s osou<br />
koľaje pravý uhol. Tento uhol sa môže odlišovať od hodnoty pravého<br />
uhla o hodnotu uhla nábehu. V prípade centrovanej polohy dvojkolesia<br />
v koľaji pretí<strong>na</strong> os trate pozdĺžnu os dvojkolesia v stredovom<br />
bode. Vzdialenosť od stredového bodu ku ľavému kolesu je taká<br />
istá ako vzdialenosť od stredového bodu ku pravému kolesu.<br />
Kolesá (ľavé a pravé) sa valia po trati s tým istým teoretickým<br />
polomerom kolies. Prieč<strong>na</strong> vzdialenosť rovín styčných kružníc je<br />
2s 1500 mm.<br />
Ak sa dvojkolesie posunie v priečnom smere, vzniká okamžitý<br />
rozdiel polomerov valivých kružníc. Parameter rozdielu okamžitých<br />
polomerov valivých kružníc pri priečnom posunutí profilu dvojkolesia<br />
po profile koľajnice sa oz<strong>na</strong>čuje ako Delta R.<br />
– Delta R,<br />
– Tangens Gamma,<br />
– Effective conicity,<br />
– Equivalent conicity.<br />
Delta R<br />
We suppose that the wheelset can move in the railway track<br />
only in the vehicle ride axis direction. The wheelset axis forms the<br />
right angle with the rail axis. This angle can be different from the<br />
right angle value by angle of attack. In the case of centered position<br />
of the wheelset in the track, the axis of the track intersects<br />
the longitudi<strong>na</strong>l wheelset axis in the center point. The distance<br />
from the center point to the left wheel is the same as the distance<br />
from the center point to the right wheel. Wheels (left and right) are<br />
rolled in the track with the same theoretical wheel radius. The<br />
lateral distance of contact circles areas is 2s 1500 mm.<br />
If the wheelset moves in the lateral direction instantaneous<br />
rolling circles radii difference arises. The difference parameter of<br />
the immediate rolling circles by lateral wheelset profile displacement<br />
on the rail profile is labeled as Delta R.<br />
Vstupné parametre:<br />
S – polovica vzdialenosti valivých<br />
kružníc<br />
R r – polomer pravého kolesa<br />
R l – polomer ľavého kolesa<br />
z Rr (y) – funkcia profilu pravého<br />
kolesa<br />
z Rl (y) – funkcia profilu ľavého kolesa<br />
z Sr (y) – funkcia profilu pravej<br />
koľajnice<br />
z Sl (y) – funkcia profilu ľavej koľajnice<br />
y Rmin – minimálne posunutie<br />
dvojkolesia<br />
y Rmax – maximálne posunutie dvojkolesia<br />
y R – krok posunutia dvojkolesia<br />
pre y y Rmin až y Rmax s krokom y R<br />
1. Dotykový bod (y, z Sr , z Rr , P Sr , P Rr )<br />
● P Sr [y] P Sr<br />
● P Rr [y] P Rr<br />
2. Dotykový bod (y, z Sl , z Rl , P Sl , P Rl )<br />
● P Sl [y] P Sl<br />
● P Rl [y] P Rl<br />
3. R[y] R r Z Rr (R l Z Rl )<br />
4. Tg r [y] T Rr<br />
5. Tg l [y] T Rl<br />
6. Tg[y] Tg r [y] Tg l [y]<br />
Ek[y] R[y]<br />
pre y 0, Ek[y] 0 pre y 0<br />
2 y<br />
Výstupné parametre<br />
PS r – vektor dotykových bodov pravej koľajnice<br />
PS l – vektor dotykových bodov ľavej koľajnice<br />
PR r – vektor dotykových bodov pravého kolesa<br />
Obr. 4 Funkcia Delta-R<br />
Fig. 4 The Delta-R function<br />
Input parameters:<br />
S – half of the rolling circles<br />
distance<br />
R r – radius of the right wheel<br />
R l – radius of the left wheel<br />
z Rr (y) – right wheel profile function<br />
z Rl (y) – left wheel profile function<br />
z Sr (y) – right rail profile function<br />
z Sl (y) – left rail profile function<br />
y Rmin – minimum wheelset<br />
displacement<br />
y Rmax – maximum wheelset<br />
displacement<br />
y R – wheelset displacement step<br />
for y from y y Rmin to y Rmax with<br />
step y R<br />
1. Contact point (y, z Sr , z Rr , P Sr , P Rr )<br />
● P Sr [y] P Sr<br />
● P Rr [y] P Rr<br />
2. Contact point (y, z Sl , z Rl , P Sl , P Rl )<br />
● P Sl [y] P Sl<br />
● P Rl [y] P Rl<br />
3. R[y] R r Z Rr (R l Z Rl )<br />
4. Tg r [y] T Rr<br />
5. Tg l [y] T Rl<br />
6. Tg[y] Tg r [y] Tg l [y]<br />
Ek[y] R[y]<br />
for y 0, Ek[y] 0 for y 0<br />
2 y<br />
Output parameters<br />
PS r – the right rail contact points vector,<br />
PS l – the left rail contact points vector,<br />
PR r – the right wheel contact points vector,<br />
46 ● KOMUNIKÁCIE / COMMUNICATIONS 1/2003
C O M M U N I C A T I O N S<br />
I S<br />
PR l – vektor dotykových bodov<br />
ľavého kolesa<br />
R – vektor Delta-R funkcie<br />
Tg r – vektor Tan-ga funkcie pre pravé<br />
koleso<br />
Tg l – vektor Tan-ga funkcie pre ľavé<br />
koleso<br />
Tg – vektor Tan-ga funkcie<br />
Ek – vektor efektívnej kužeľovitosti<br />
Tangens Gama<br />
Tangens uhla normály dotykovej<br />
roviny v mieste kontaktu kolesa s koľajnicou,<br />
s vertikálnou osou oz<strong>na</strong>čujeme<br />
názvom Tangens Gama funkcia.<br />
Táto funkcia vyjadruje mieru intenzity<br />
väzby, ktorá vracia dvojkolesie po<br />
priečnom vychýlení do centrovanej,<br />
rovnovážnej polohy v koľaji.<br />
Efektív<strong>na</strong> kužeľovitosť<br />
The forces act to railway wheelset in the lateral direction after<br />
of center of gravity from the rail axis deviation. The wheelset is on<br />
the base of these forces returned and centered in the rail.<br />
The wheelset executes simultaneously the forward sliding<br />
movement in the rail axis direction. The resultant hunting motion<br />
is created by the simultaneous forward and lateral wheelset motion.<br />
Rotatio<strong>na</strong>l movement comparative parameter is effective conicity,<br />
the equivalent conicity is the comparative parameter for perioditan<br />
ga [-]<br />
Obr. 5 Funkcia Tangens Gama<br />
Fig. 5 Tangens Gamma function<br />
Effective conicity<br />
PR l – the left wheel contact<br />
points vector,<br />
R – the Delta-R function vector,<br />
Tg r - the Tan-ga function for right<br />
wheel vector,<br />
Tg l – the Tan-ga function for left<br />
wheel, vector<br />
Tg – the Tan-ga function, vector<br />
Ek – the Effective conicity vector<br />
Tangens Gamma<br />
Tangens of angle of the contact<br />
area normal line in the contact<br />
point of the wheel with rail, with<br />
the vertical axis, is <strong>na</strong>med Tangens<br />
Gamma function. This function expresses<br />
the binding strength rate,<br />
which is returning the wheelset<br />
after its lateral deviation to the<br />
centered position in the rail.<br />
Nenulová hodnota okamžitého rozdielu polomeru valivých<br />
kružníc vedie ku s<strong>na</strong>he dvojkolesia vyko<strong>na</strong>ť otáčavý pohyb okolo<br />
osi prechádzajúcej ťažiskom dvojkolesia, kolmej <strong>na</strong> horizontálnu<br />
rovinu. Štandardným parametrom,<br />
ktorým je možné pri kolese s jednoduchým<br />
kužeľovým profilom definovať<br />
mieru schopnosti <strong>na</strong>táčania, je<br />
kužeľovitosť.<br />
Skutočný profil železničného<br />
kolesa má geometriu profilu presne<br />
definovanú pre európske dráhy je<br />
zaužívaný profil S1002 (UIC-ORE).<br />
V priebehu prevádzky dochádza<br />
k opotrebeniu jazdnej plochy kolesa,<br />
čím sa aj profil modifikuje.<br />
Non zero value of the instant rolling circles radius difference<br />
leads to the endeavor of the wheelset doing the rotatio<strong>na</strong>l movement,<br />
around the axis, coming through the centre of gravity of the<br />
wheelset. The axis is perpendicular<br />
to the horizontal area. The conicity<br />
is the standard parameter, e<strong>na</strong>bling<br />
to define the rotation ability rate by<br />
the wheel with simple conus ride<br />
wheel profile.<br />
True railway wheel profile has<br />
got the profile geometry strictly defined.<br />
S1002 (UIC-ORE) profile is<br />
used for the European tracks. During<br />
the vehicles operation the wheel<br />
wearing occurs and subsequently, the<br />
wheel ride profile is changed.<br />
Efektív<strong>na</strong> kužeľovitosť je hodnota<br />
kužeľovitosti výhradne kužeľového<br />
profilu kolesa dvojkolesia,<br />
ktorú by dvojkolesie muselo mať, aby<br />
vykonávalo rov<strong>na</strong>ký rotačný pohyb<br />
bez preklzov v koľaji, ako skutočné<br />
(merané) dvojkolesie.<br />
Obr. 6 Efektív<strong>na</strong> kužeľovitosť<br />
Fig. 6 Effective conicity<br />
The effective conicity is the valid<br />
conicity value only in case of conus<br />
wheel ride profile of the wheelset<br />
that the wheelset should have for<br />
executing the same rotatio<strong>na</strong>l movement<br />
with-out slips in the rail as the<br />
true, (measured) wheelset.<br />
Na železničné dvojkolesie po vychýlení jeho ťažiska z osi<br />
koľaje v priečnom smere pôsobia sily, ktorých účinkom sa dvojkolesie<br />
vracia <strong>na</strong>späť do centrovanej polohy. Dvojkolesie vykonáva<br />
zároveň posuvný dopredný pohyb v smere koľaje. Výsledkom súčasného<br />
pohybu v smere postupnom aj v smere priečnom je teoreticky<br />
pravidelný vlnivý pohyb dvojkolesia. Podobne, ako<br />
porovnávací parameter efektív<strong>na</strong> kužeľovitosť, pre rotačný pohyb<br />
sa zavádza parameter ekvivalentná kužeľovitosť, pre pohyb vlnivý,<br />
KOMUNIKÁCIE / COMMUNICATIONS 1/2003 ●<br />
47
C O M M U N I C A T I O N S<br />
I S<br />
kde zjednocujúcim faktorom teoretického kužeľového profilu<br />
dvojkolesia a reálneho skúmaného dvojkolesia sú vlnová dĺžka<br />
a amplitúda vlnivého pohybu.<br />
cal hunting motion. The common factors of the theoretical and<br />
true wheel profile are wavelength and amplitude of hunting motion<br />
of the wheelset.<br />
6. Opotrebenie koľaje<br />
Zaťažujúce sily pôsobia v kontaktných bodoch kolesa a koľajnice.<br />
Sily vytvárajú v kontaktných plochách vysoké lokálne <strong>na</strong>päťové<br />
zaťaženie a materiál sa opotrebováva. Teoretický profil koľajnice<br />
UIC 60 je <strong>na</strong> obrázku 7. Profil má sklon 1:40. Meraný reálny<br />
profil je tiež <strong>na</strong> obrázku 7. Obidva profily sú umiestnené v spoločnom<br />
súradnicovom systéme, zarov<strong>na</strong>né <strong>na</strong> <strong>na</strong>jvyšší bod profilu<br />
koľajnice <strong>na</strong> úrovni teme<strong>na</strong> koľajnice. Z hľadiska polohy profilov<br />
má výz<strong>na</strong>mnú úlohu parameter rozchodu koľaje, určovaný vo vertikálnej<br />
vzdialenosti 14 mm pod temenom koľaje.<br />
6. Rail wearing<br />
The loading forces act in the wheel and rail contact points.<br />
The forces create the high local strength loads in the contact areas<br />
and the material is being worn. Theoretical rail profile of UIC 60<br />
is shown in Fig. 7. The profile has got incli<strong>na</strong>tion of 1:40. The<br />
measured true rail profile is in Fig. 7 too. Both profiles are situated<br />
in the common coordi<strong>na</strong>te system. They are aligned in the highest<br />
point of the rail profile, in the level of the rail head crown. From<br />
the point of view of profiles position, the rail gauge parameter has<br />
got an important function. The gauge parameter is determined in<br />
vertical axis 14 mm under the rail head crown coordi<strong>na</strong>te value.<br />
Obr. 7. Referenčný a skutočný profil koľajnice<br />
Fig. 7 Reference and true rail profile<br />
7. A<strong>na</strong>lýza opotrebenia profilu koľajnice<br />
Opotrebenie koľaje traťových úsekov môže byť hodnotené<br />
viacerými kritériami.<br />
Pre určenie spôsobu vyhodnocovanie, resp. vyčíslenie hodnôt,<br />
je rozhodujúce jednoz<strong>na</strong>čné umiestnenie porovnávaných profilov<br />
koľajníc v rovine YZ.<br />
7. Rail profile wearing a<strong>na</strong>lysis<br />
The railway track segments rail wearing can be assessed with<br />
more criteria.<br />
The strictly definite position of the compared rail profiles in<br />
the YZ area is crucial for determi<strong>na</strong>tion of the methode of<br />
assessment and for wearing quantification.<br />
Vzťažná poloha v horizontálnom<br />
smere je zhodná pre viaceré vyhodnocovacie<br />
systémy. Spoločný bod<br />
profilov je určený do úrovne pojazdnej<br />
hrany, vzhľadom <strong>na</strong> ktorý sa<br />
určuje rozchod koľaje. Vo vertikálnej<br />
osi je spoločným parametrom<br />
pre zarov<strong>na</strong>nie polohy temeno hlavy<br />
koľajnice.<br />
Obr. 8 Umiestnenie profilov pre určenie diferencie<br />
Fig. 8 The position of the profiles for difference assessment<br />
The relative position in the horizontal<br />
direction is identical for a lot<br />
of assessment systems. The common<br />
point of profiles is situated into the<br />
level movable edge, owing to gauge<br />
of the railway. The rail head crown<br />
is the common parameter for position<br />
alignment in the vertical axis.<br />
48 ● KOMUNIKÁCIE / COMMUNICATIONS 1/2003
C O M M U N I C A T I O N S<br />
I S<br />
Podmienkou správneho vyhodnocovania diferenčných parametrov<br />
je<br />
– dostatočný počet <strong>na</strong>meraných a uložených bodov,<br />
– použitie správnej vyhladzovacej krivky, ktorou sa <strong>na</strong>merané body<br />
preložia,<br />
– dostatočne vysoká numerická presnosť výpočtov,<br />
– možnosť grafického zobrazenia výsledkov.<br />
Na <strong>na</strong>sledujúcich obrázkoch sú profily hláv obidvoch koľajnicových<br />
pásov a referenčný profil UIC 60. Referenčný profil<br />
(červená farba) je <strong>na</strong>klonený v smere podľa umiestnenia koľajnice:<br />
ľavá / pravá.<br />
The conditions of the right difference parameter assessment<br />
are:<br />
– sufficient number of measured and stored points,<br />
– right smoothing curve numerical algorithm usage,<br />
– sufficient high numerical precision of the computations,<br />
– possibility of graphical representation of results.<br />
Both rail head profiles with reference profile UIC60 are shown<br />
in the figures below. The reference rail profile is canted in the<br />
direction owing to the vertical rail position: left / right side.<br />
Obr. 9. Diferencia profilov ľavých koľajníc<br />
Fig. 9 Left rail profiles difference.<br />
Obr. 10. Diferencia profilov pravých koľajníc<br />
Fig. 10 Right rail profiles difference.<br />
Výsledný rozdiel geometrie profilov je znázornený zelenou<br />
farbou. Výskyt krivky „pod“ vodorovnou osou s nulovou súradnicou<br />
z<strong>na</strong>mená úbytok materiálu, „<strong>na</strong>d“ z<strong>na</strong>mená návalok materiálu.<br />
Na obr. 11, v poradí 2. (pre pravú koľajnicu) a 3. (pre ľavú<br />
koľajnicu) grafe sú vynesené takéto rezy vedľa seba. Parameter<br />
vodorovnej osi z obrázkov 9 a 10 je v grafoch 2 a 3 obr. 11 vynesený<br />
<strong>na</strong> zvislej osi, hodnota diferencie je určená farebnou škálou<br />
a vodorovná os predstavuje vyhodnocovanú trať.<br />
The rail profiles geometry difference is shown in Fig. 9 and<br />
Fig. 10 with green color. The green line “under” the horizontal axis<br />
of zero level means the material decrement, the green line “over” axis<br />
means local material addition. The second diagram (for the right<br />
rail) and third diagram (for the left rail) in Fig. 11 show the railway<br />
rail lateral cross sections. Parameters of the horizontal axis in Fig.<br />
9 and Fig. 10 are in the second diagram and third diagram displayed<br />
in the vertical axis. The color scale legend determines the difference<br />
value and the horizontal axis is the assessed railway track.<br />
8. Vyhodnotenie diferencie geometrickej polohy<br />
<strong>na</strong>meraného a referenčného profilu<br />
Gauge: Vzdialenosť pojazdných hrán koľajnicových pásov meraná<br />
v rovine priečneho rezu.<br />
R Diff: Diferencia vzdialenosti bodov profilov hláv koľajníc<br />
vzhľadom <strong>na</strong> začiatok spoločného súradnicového systému profilov<br />
pravého koľajnicového pásu. Graf zobrazuje pre každú hodnotu<br />
súradnice trate všetky hodnoty diferencií geometrie profilov <strong>na</strong><br />
dĺžke zvoleného intervalu horizontálnej súradnice priečneho rezu<br />
pravej koľajnice. Farebná škála pomáha určiť oblasti od minimálnych<br />
až po maximálne diferencie geometrie <strong>na</strong> trati a <strong>na</strong> základe<br />
farebných plôch určuje celkový stav, prípadne zmenu stavu vyhodnocovanú<br />
po určitom čase.<br />
L Diff: Diferencia vzdialenosti bodov profilov hláv koľajníc<br />
vzhľadom <strong>na</strong> začiatok spoločného súradnicového systému profilov<br />
ľavého koľajnicového pásu. Graf zobrazuje pre každú hodnotu súrad-<br />
8. Measured and reference geometry profile difference<br />
assessment<br />
Gauge: Distance of the rails movable edges, measured in the<br />
cross section.<br />
R Diff: Rails heads profile points distance difference owing to<br />
the start of the right rail common coordi<strong>na</strong>te system. The diagram<br />
displays all profiles geometry difference values for each of coordi<strong>na</strong>te<br />
value in the selected track interval length of the horizontal<br />
coordi<strong>na</strong>te of the cross section of the right rail. The color scale<br />
helps to locate the areas from maximum to minimum geometry<br />
difference along the track and on the base of colored areas it is<br />
possible to evaluate the overall rail state or the change of the rail<br />
state under operation after some time.<br />
L Diff: Rails heads profile points distance difference owing to<br />
the start of the left rail common coordi<strong>na</strong>te system. The diagram<br />
displays all profiles geometry difference values for each of coordi-<br />
KOMUNIKÁCIE / COMMUNICATIONS 1/2003 ●<br />
49
C O M M U N I C A T I O N S<br />
I S<br />
Radii - R<br />
Obr. 11 Grafy vyhodnotenia geometrie profilov koľajníc <strong>na</strong> úseku trate<br />
Fig. 11 Diagrams of the rail profile geometry on the track segment assessment<br />
50 ● KOMUNIKÁCIE / COMMUNICATIONS 1/2003
C O M M U N I C A T I O N S<br />
I S<br />
nice trate všetky hodnoty diferencií geometrie profilov <strong>na</strong> dĺžke<br />
zvoleného intervalu horizontálnej súradnice priečneho rezu ľavej<br />
koľajnice. Farebná škála pomáha určiť oblasti od minimálnych až<br />
po maximálne diferencie geometrie <strong>na</strong> trati a <strong>na</strong> základe farebných<br />
plôch určuje celkový stav, prípadne zmenu stavu vyhodnocovanú<br />
po určitom čase.<br />
R Area (): Plocha určená priebehom diferenčnej krivky<br />
a nulovou horizontálnou súradnicou – oblasť menšej vertikálnej<br />
súradnice meraného profilu, oproti referenčnému profilu (opotrebenie),<br />
<strong>na</strong> pravej koľajnici.<br />
R Area (): Plocha určená priebehom diferenčnej krivky<br />
a nulovou horizontálnou súradnicou – oblasť väčšej vertikálnej<br />
súradnice meraného profilu, oproti referenčnému profilu (návalok),<br />
<strong>na</strong> pravej koľajnici.<br />
L Area (): Plocha určená priebehom diferenčnej krivky<br />
a nulovou horizontálnou súradnicou – oblasť menšej vertikálnej<br />
súradnice meraného profilu, oproti referenčnému profilu (opotrebenie),<br />
<strong>na</strong> ľavej koľajnici.<br />
L Area (): Plocha určená priebehom diferenčnej krivky<br />
a nulovou horizontálnou súradnicou – oblasť väčšej vertikálnej<br />
súradnice meraného profilu, oproti referenčnému profilu (návalok),<br />
<strong>na</strong> ľavej koľajnici.<br />
Radii: Definícia trate pomocou polomerov oblúkov. Priamu<br />
trať predstavuje horizontál<strong>na</strong> súradnicová os, hodnota parametra<br />
v grafe má oz<strong>na</strong>čenie G.<br />
<strong>na</strong>te value in the selected track interval length of the horizontal<br />
coordi<strong>na</strong>te of the cross section of the left rail. The color scale helps<br />
to locate the areas from maximum to minimum geometry difference<br />
along the track and on the base of colored areas it is possible<br />
to evaluate the overall rail state or the change of the rail state<br />
under operation after some time.<br />
R Area (): The area determined by the course of the difference<br />
curve and by zero horizontal coordi<strong>na</strong>te line – area of the<br />
lower value of the measured profile vertical coordi<strong>na</strong>te against reference<br />
profile (wearing) of the right rail.<br />
R Area (): The area determined by the course of the difference<br />
curve and by zero horizontal coordi<strong>na</strong>te line – area of the<br />
higher value of the measured profile vertical coordi<strong>na</strong>te against<br />
reference profile (adding) of the right rail.<br />
L Area (): The area determined by the course of the difference<br />
curve and by zero horizontal coordi<strong>na</strong>te line – area of the<br />
lower value of the measured profile vertical coordi<strong>na</strong>te against reference<br />
profile (wearing) of the left rail.<br />
L Area (): The area determined by the course of the difference<br />
curve and by zero horizontal coordi<strong>na</strong>te line – area of the higher<br />
value of the measured profile vertical coordi<strong>na</strong>te against reference<br />
profile (adding) of the left rail.<br />
Radii: Definition of the railway track with the help of curves<br />
radii. The straight track is shown by the horizontal coordi<strong>na</strong>te<br />
axis, parameter value in the diagram is labeled G.<br />
8. Záver<br />
Opotrebenie koľajníc predstavuje závažný problém prevádzky<br />
koľajových vozidiel. Negatívne dôsledky prílišného opotrebenia<br />
koľajníc sa prejavujú tak <strong>na</strong> zvýšenom zaťažení životného prostredia<br />
od materiálu rozptýleného do prostredia, parazitných kmitaní<br />
častí vozidiel, zvýšenej hladine hluku, tak <strong>na</strong> spôsobe jazdy železničného<br />
vozidla. Opotrebená koľaj rozhodujúcim spôsobom ovplyvňuje<br />
plynulý chod vozidiel, znižuje komfort jazdy, ako aj mieru<br />
bezpečnosti proti vykoľajeniu.<br />
Nízka kvalita železničnej trate spôsobuje vyšší koeficient poruchovosti<br />
prevádzky vozidiel a problémy s dopravou osôb a prepravou<br />
materiálu.<br />
8. Conclusion<br />
Wearing of the rail is important problem of the rail vehicles<br />
operation. Negative consequences of the extreme wearing of the<br />
rail can be demonstrated both on the loading of the environment<br />
from the material dispersed into the environment, parasite vibration<br />
of the parts of railway vehicles, high noise level and the manner of<br />
the railway vehicle runnig quality. The worn rail profile influences<br />
on a crucial manner smooth running of vehicles, decreases running<br />
comfort and safety against derailment too.<br />
The low quality track cases the higher failure coefficient of<br />
vehicles and problems with passengers and freight transportation.<br />
Literatúra – Reference:<br />
[1] UIC CODE 519 OR: Method for determining the equivalent conicity, Inter<strong>na</strong>tio<strong>na</strong>l Union of Railways, Draft of December 2001.<br />
[2] STN 73 6360: Geometrická poloha a usporiadanie koľaje železničných dráh normálneho rozchodu, September 2000.<br />
KOMUNIKÁCIE / COMMUNICATIONS 1/2003 ●<br />
51
C O M M U N I C A T I O N S<br />
I S<br />
PREHĽADY / REVIEWS<br />
Jozef G<strong>na</strong>p – Vladimír Konečný *<br />
DOPRAVNÁ POLITIKA VO VZŤAHU K CESTNEJ DOPRAVE<br />
A TRVALO UDRŽATEĽNÝ ROZVOJ<br />
TRANSPORT POLICY RELATED TO ROAD TRANSPORT AND SUSTAINABLE DEVELOPMENT<br />
Vývoj takmer vo všetkých hospodárskych odvetviach okamžite<br />
ovplyvní oblasť <strong>dopravy</strong>. Inými slovami, rast hospodárstva vedie automaticky<br />
k rastu v oblasti cestnej <strong>dopravy</strong>. Automobilový priemysel produkuje<br />
vozidlá vybavené novými technológiami a prevádzkovatelia<br />
<strong>dopravy</strong> túto oblasť fi<strong>na</strong>ncujú prostredníctvom nákupu nových nákladných<br />
vozidiel a autobusov. Tento proces je plynulý. Sprísňuje sa legislatíva<br />
pre cestnú dopravu, sú vypracované koncepcie v EÚ ako dosiahnuť<br />
trvalo udržateľný rozvoj. Štát<strong>na</strong> dopravná politika SR musí uvedené<br />
výsledky a koncepcie reflektovať, i<strong>na</strong>k sa cestná doprava v SR stane<br />
brzdou trvalo udržateľného rozvoja <strong>na</strong>šej spoločnosti.<br />
Development in almost all sectors of economy will immediately<br />
affect the transport sector. We can say that growth in economy leads<br />
automatically to growth in road transport. As a continuous process<br />
the road transport industry produces vehicles by new technologies<br />
and transport operators fi<strong>na</strong>nce this section by purchasing new trucks<br />
and coaches. There is a continual and tightened process in the road<br />
transport legislation, the EU has elaborated conceptions for achieving<br />
sustai<strong>na</strong>ble development. The state transport policy of the Slovak<br />
Republic has to reflect specified results and conceptions, otherwise road<br />
transport in the Slovak Republic becomes the brake of sustai<strong>na</strong>ble<br />
development.<br />
1. Úvod<br />
Na základe „Aktualizácie a rozpracovania zásad štátnej dopravnej<br />
politiky SR“, ktoré boli schválené uznesením vlády SR č. 21<br />
dňa 12. 1. 2000, je súčasná štát<strong>na</strong> dopravná politika dlhodobo<br />
cieľovo zameraná <strong>na</strong> vytváranie predpokladov <strong>na</strong>:<br />
racionálne využívanie zdrojov a územia štátu zabezpečením<br />
trvalo udržateľnej mobility podporou environmentálne ohľaduplných,<br />
bezpečnejších a z celospoločenského hľadiska efektívnejších<br />
dopravných systémov,<br />
využívanie komparatívnej výhody geografickej polohy štátu so<br />
zodpovedajúcim kvalitným prepojením dopravnej infraštruktúry<br />
s európskou dopravnou sieťou,<br />
proporcio<strong>na</strong>litu rozvoja <strong>dopravy</strong> vzhľadom <strong>na</strong> prepravný dopyt<br />
spoločnosti a dopravnú obsluhu územia,<br />
ochranu životného prostredia, premietnutú do voľby dopravných<br />
trás a dopravných prostriedkov <strong>na</strong> báze stanovených environmentálnych<br />
kritérií,<br />
trvalé udržiavanie a zvyšovanie bezpečnosti <strong>dopravy</strong> a jej spoľahlivosti,<br />
technickú vyváženosť, zodpovedajúcu parametrom uplatňovaným<br />
v dopravno-vyspelých štátoch,<br />
dlhodobosť, previazanosť a stabilitu legislatívnych zámerov rozvoja<br />
<strong>dopravy</strong>.<br />
●<br />
●<br />
●<br />
●<br />
●<br />
●<br />
●<br />
Slovenská republika je vzhľadom <strong>na</strong> štruktúru zahraničného<br />
obchodu závislá od medzinárodnej <strong>dopravy</strong> a je tiež tranzitným<br />
1. Introduction<br />
On the basis of the “Updating and elaboration of state transport<br />
policy principles of the Slovak Republic”, that were ratified by<br />
the government decree n.21 of the Slovak Republic on 12 January<br />
2000, the actual state transport policy is in the long term deliberately<br />
directed to creation of assumptions for:<br />
● Ratio<strong>na</strong>l exploitation of sources and state territory through<br />
securing the sustai<strong>na</strong>ble mobility by the support of the transport<br />
systems which are environmental considerate, safer and more<br />
●<br />
●<br />
●<br />
●<br />
●<br />
●<br />
effective in the term of society,<br />
Exploitation of the comparative advantage of geographic location<br />
with appropriate quality interconnection of the traffic infrastructure<br />
and European transport network,<br />
Transport proportio<strong>na</strong>lity development in regard to transport<br />
demand of society and the territory transport mainte<strong>na</strong>nce,<br />
Protection of the environment removed into the option of routes<br />
and means of transport in pursuance of specified environmental<br />
criterions,<br />
Permanent care and increasing the transport safety and its reliability,<br />
Technical flexibility corresponding to the enforced parameters<br />
in traffic-advanced states,<br />
Long-time, cohesion and stability of the legislative intents in<br />
the transport development.<br />
The Slovak Republic depends on the inter<strong>na</strong>tio<strong>na</strong>l transport<br />
with regard to the structure of foreign trade and is also a transit<br />
* Prof. Ing. Jozef G<strong>na</strong>p, PhD., Ing. Vladimír Konečný<br />
University of Žili<strong>na</strong>, Faculty of Operation and Economics of Transport and Communications, Department of Road and City Transport, Veľký diel,<br />
010 26 Žili<strong>na</strong>, Slovak Republic, Tel.:++421-41-5133295, Fax:++421-41-5651499, E-mail: g<strong>na</strong>p@fpedas.utc.sk, konecny@fpedas.utc.sk<br />
52 ● KOMUNIKÁCIE / COMMUNICATIONS 1/2003
C O M M U N I C A T I O N S<br />
I S<br />
PREHĽADY / REVIEWS<br />
štátom <strong>na</strong>jmä v smere sever-juh a opačne. Jej geografická poloha,<br />
hospodárska situácia a obchodná politika vyžaduje aj medzinárodnú<br />
perspektívu – dimenziu dopravnej politiky. Slovenská republika<br />
musí pokračovať v úzkej medzinárodnej spolupráci za účelom<br />
využitia výhodnej polohy v regióne strednej Európy. Perspektívne<br />
členstvo Slovenskej republiky v Európskej únii z<strong>na</strong>čí aj možnosť<br />
pre Slovensko, že sa bude môcť výz<strong>na</strong>mnejšou mierou podieľať <strong>na</strong><br />
tvorbe a realizácii európskej dopravnej politiky.<br />
Vzhľadom <strong>na</strong> Bielu knihu – Európska dopravná politika do<br />
r. 2010 – čas rozhodnutia [5], ktorú vydala Európska komisia<br />
v roku 2001, možno očakávať v celej Európe sťaženie podmienok<br />
podnikania pre cestných dopravcov. Úlohou Bielej knihy síce je<br />
odbremeniť zaťaženosť mnohých úzkych cestných úsekov a zlepšiť<br />
európsku infraštruktúru, tieto ciele však budú ospravedlňované<br />
sériou opatrení, ktorých priamym alebo nepriamym cieľom bude<br />
podpora iných druhov <strong>dopravy</strong>, často aj <strong>na</strong> úkor cestnej <strong>dopravy</strong><br />
pri nerešpektovaní efektívnosti týchto rozhodnutí [3].<br />
Medzinárodná únia cestnej <strong>dopravy</strong> (IRU), ktorej členom je<br />
aj ČESMAD Slovakia (Združenie cestných dopravcov SR), vypracovala<br />
svoju vlastnú štúdiu pre rozšírenie EÚ v cestnej doprave,<br />
ktorá má korešpondovať s predstavami inštitúcií, ako je Európska<br />
komisia a ECMT (Rada európskych ministrov <strong>dopravy</strong>). V tomto<br />
smere sa IRU spolu s EÚ usilujú o to, aby harmonizácia dopravného<br />
acqius commu<strong>na</strong>utaire (jednotný systém legislatívy EÚ) bola<br />
v čase vstupu do EÚ vo všetkých kandidátskych krajinách <strong>na</strong> rov<strong>na</strong>kej<br />
úrovni a aby nedochádzalo k znevýhodňovaniu niektorej<br />
z uchádzačských krajín.<br />
Stratégia IRU počíta pri rozšírení EÚ s dvoma možnými scenármi<br />
v oblasti cestnej <strong>dopravy</strong>:<br />
Scenár „veľkého tresku“<br />
Tento scenár počíta s úplnou implementáciou legislatívy<br />
z oblasti <strong>dopravy</strong> zo strany kandidátskych krajín a následného<br />
úplného otvorenia trhu individuálne pre dopravcov z jednotlivých<br />
krajín hneď od prvého dňa od podpísania zmluvy o vstupe do EÚ.<br />
Tento scenár vyžaduje vyššie nároky a viac času <strong>na</strong> prípravu<br />
a podľa IRU má niekoľko vážnych nedostatkov:<br />
●<br />
●<br />
●<br />
●<br />
umelý vznik dočasnej, ale závažnej krízy vyplývajúcej z <strong>na</strong>dbytočných<br />
kapacít okamžite potom, ako nové členské štáty vstúpia <strong>na</strong><br />
osobitný dopravný trh,<br />
vznik problémov a výrazný tlak <strong>na</strong> dopravné spoločnosti <strong>na</strong><br />
oboch stranách, obzvlášť z krajín strednej a východnej Európy,<br />
kvôli okamžitému prispôsobeniu ich internej štruktúry a ich<br />
fungovaniu novovzniknutej situácii, v tomto smere môže dôjsť<br />
aj k odporu otvoriť sa zo stany priemyslu,<br />
redukované možnosti poskytovať služby <strong>na</strong> osobitnom dopravnom<br />
trhu,<br />
možnosti investícií (<strong>na</strong>pr. pre obnovu vozidlového parku) by boli<br />
v budúcnosti pre nové členské štáty výrazne obmedzené.<br />
Scenár „krok za krokom“<br />
Pri tomto scenári by došlo k rozšíreniu bez dlhšieho oneskorenia,<br />
ale <strong>na</strong> druhej strane by sa postupne upravovali kvóty <strong>na</strong> ude-<br />
state in the north – south and opposite directions. Its geographic<br />
location, economic situation and business policy requests also an<br />
inter<strong>na</strong>tio<strong>na</strong>l prospect – the dimension of transport policy. The<br />
Slovak Republic has to continue in close inter<strong>na</strong>tio<strong>na</strong>l cooperation<br />
in order to exploit amenity in the Central Europe region. The<br />
prospective membership of the Slovak Republic in EU is also an<br />
opportunity for the Slovak Republic, which would be able to participate<br />
more markedly on creation and realization of the European<br />
transport policy.<br />
With regard to the White Paper – European transport policy to<br />
year 2010 – the time of decision [5], issued by the European Commission<br />
in 2001 it can be expected that the conditions for road<br />
carriers will become more difficult in all of Europe. The role of the<br />
White Paper is to decrease the burden on many road bottlenecks<br />
and to improve the European infrastructure, however these goals<br />
will be excused by a series of measures, the direct or indirect goals<br />
of which will be to support other types of transport, often at the<br />
expense of road transport irrespective of effectiveness of these<br />
decisions [3].<br />
The Inter<strong>na</strong>tio<strong>na</strong>l Road Transport Union (IRU), where<br />
ČESMAD Slovakia is also a member, drafted its own study on the<br />
EU enlargement in road transport that should correspond with the<br />
ideas of institutions such as the European Commission and ECMT<br />
(European Conference of Ministers of Transport). In this respect<br />
the IRU along with the EU try to make sure that the harmonization<br />
of the transport acquis commu<strong>na</strong>utaire (EU legislation) be<br />
upon accession to the EU at the same level in all candidate countries,<br />
in order to prevent disadvantages to any of the applicant<br />
countries.<br />
The IRU strategy considered two possible sce<strong>na</strong>rios of EU<br />
enlargement in the area of road transport:<br />
The “Big Bang” sce<strong>na</strong>rio<br />
This sce<strong>na</strong>rio assumes a full implementation of legislation by<br />
the candidate countries in the area of transport and the following<br />
full opening of the market individually for the hauliers from all countries,<br />
at once from the first day of signing the EU Accession Treaty.<br />
This sce<strong>na</strong>rio is more demanding and requires more time for the<br />
preparation and according to the IRU has several serious defects:<br />
● Artificial emergence of a temporary but serious crisis, resulting<br />
from overcapacity, immediately upon the new member states<br />
entering the special transport market,<br />
● Problems inception and significant pressure on transport companies<br />
on both sides, mainly in countries of Central and Eastern<br />
Europe, due to immediate adaptation of their inter<strong>na</strong>l structures<br />
due to having an effect in accordance with the new situation, in<br />
this respect also resistance may be put up by the industry for to<br />
open up,<br />
● Reduced possibility to provide services on the special transport<br />
market,<br />
● Possibilities of investment (e. g. the renovation of the vehicle<br />
fleet) would be strongly restricted in future for the new member<br />
states.<br />
The “step-by-step” sce<strong>na</strong>rio<br />
This sce<strong>na</strong>rio supports the enlargement without longer delays,<br />
but on the other hand, quotas for granting transport permits (either<br />
KOMUNIKÁCIE / COMMUNICATIONS 1/2003 ●<br />
53
C O M M U N I C A T I O N S<br />
I S<br />
PREHĽADY / REVIEWS<br />
Looking at the role of the coaches and buses in the economy<br />
it becomes clear that buses and coaches are not only the backbone<br />
of public transport, but also play an important role for the European<br />
tourist industry. They help to provide employment for millions<br />
of citizens. From Lisbon to Moscow, from Istanbul to Stockholm,<br />
bus and coach operators employ about 1.8 million drivers, mechanľovanie<br />
prepravných povolení (či už <strong>na</strong> úrovni ECMT, alebo bilaterálnej,<br />
nie však pre kabotáž). Kabotáž je vykonávanie vnútroštátnej<br />
cestnej <strong>dopravy</strong> <strong>na</strong> území štátu, v ktorom nie je vozidlo<br />
dopravcu registrované.<br />
Treba uviesť, že SR uzavrela kapitolu „Doprava“ v rámci prístupových<br />
rokovaní s EÚ a prijala sa „kombinovaná“ alter<strong>na</strong>tíva.<br />
To z<strong>na</strong>mená, že sa predpokladá okrem kabotáže úplné uvoľnenie<br />
v medzinárodnej cestnej doprave. V oblasti kabotáže sa prijalo prechodné<br />
obdobie dva roky s tým, že je možné ho predĺžiť o ďalšie<br />
dva roky a po vyhodnotení ešte o rok.<br />
Je možné očakávať, že po vstupe SR do EÚ <strong>na</strong>stane nárast<br />
medzinárodnej cestnej nákladnej <strong>dopravy</strong>. Ako je <strong>na</strong> tom vlastne<br />
cestná doprava Plní cestná doprava požiadavky <strong>na</strong> trvalo udržateľný<br />
rozvoj<br />
at the level of ECMT or bilateral, however not for cabotage) would<br />
be gradually adapted. The cabotage means realization of <strong>na</strong>tio<strong>na</strong>l<br />
road transport on the territory of the state where the carrier’s<br />
vehicle is not registered.<br />
It is to be said here that the Slovak Republic closed the chapter<br />
“Transport” within entry proceedings with the EU and the “combined”<br />
alter<strong>na</strong>tive was accepted. It comes to this that it expects<br />
entire release in the inter<strong>na</strong>tio<strong>na</strong>l haulage transport except for the<br />
cabotage. In the area of cabotage a transformatio<strong>na</strong>l period for 2<br />
years was accepted, which can be extended for another 2 years<br />
and another one year after the evaluation.<br />
It is possible to expect the growth of the inter<strong>na</strong>tio<strong>na</strong>l road<br />
haulage transport after incorporation of the Slovak Republic into<br />
the EU. What is the position of the road transport Does the road<br />
transport serve sustai<strong>na</strong>ble development requirements<br />
2. Požiadavky <strong>na</strong> cestnú dopravu<br />
a trvalo udržateľný rozvoj<br />
Trvalo udržateľný rozvoj je forma<br />
hospodárenia a rozvoja, ktorá zodpovedá<br />
potrebám súčasných generácií<br />
bez toho, aby boli ohrozené šance<br />
a možnosti budúcich generácií uspokojovať<br />
ich potreby.<br />
2. Road transport requirements<br />
and sustai<strong>na</strong>ble development<br />
Sustai<strong>na</strong>ble development means<br />
a form of ma<strong>na</strong>gement and development<br />
that fills the bill of present<br />
generations without threat for<br />
chances and possibilities of future<br />
generations to meet their needs.<br />
Trvalo udržateľný rozvoj je<br />
možno chápať ako zložitý mechanizmus,<br />
ktorého jednotlivé aspekty sú<br />
vzájomne previazané (pozri obr. 1).<br />
Source: IRU, 2001<br />
Obr. 1. Aspekty trvalo udržateľného rozvoja a ich vzájomný vzťah<br />
Fig. 1. Aspects of sustai<strong>na</strong>ble development and their relationship<br />
Sustai<strong>na</strong>ble development can be<br />
viewed as complicated mechanism<br />
with cohesion of individual aspects<br />
(fig. 1).<br />
2.1 Cestná doprava a ekonomické aspekty<br />
trvalo udržateľného rozvoja<br />
Obchod je životne dôležitý pre spoločenský blahobyt a cestná<br />
nákladná doprava je ne<strong>na</strong>hraditeľným prvkom obchodu všetkých<br />
ekonomík. V rámci dopravného sektora dosahuje cestná nákladná<br />
doprava <strong>na</strong>jväčší trhový podiel, ten rastie zásluhou kvalitnejších<br />
služieb cestnej <strong>dopravy</strong> z hľadiska väčšej flexibility, spoľahlivosti,<br />
rýchlosti dodania, menších nárokov <strong>na</strong> balenie tovaru a menšej<br />
pravdepodobnosti poškodenia zásielky. Hospodárstvo krajín je<br />
závislé od cestnej nákladnej <strong>dopravy</strong>, túto závislosť možno ďalej<br />
zvýrazniť <strong>na</strong>sledujúcimi faktami:<br />
● vozidlá cestnej nákladnej <strong>dopravy</strong> prepravia takmer 80 % všetkých<br />
tovarov vo vyspelých krajinách,<br />
● každý deň cestné nákladné vozidlá prepravia 70 kg tovaru <strong>na</strong><br />
každého obyvateľa žijúceho vo vyspelých krajinách,<br />
● cestné nákladné vozidlá platia <strong>na</strong> daniach a poplatkoch v Európe<br />
ročne 40 biliónov eur.<br />
Pri pohľade <strong>na</strong> úlohu autobusovej <strong>dopravy</strong> v hospodárstve<br />
krajiny je jasné, že autobusová doprava nie je len nosnou časťou<br />
verejnej <strong>dopravy</strong>, ale tiež hrá dôležitú úlohu v oblasti turistiky.<br />
Pomáha obstarať zamest<strong>na</strong>nie pre milióny obyvateľov. Od Lisabonu<br />
2.1 Road transport and economic aspects<br />
of sustai<strong>na</strong>ble development<br />
Trade is vital for our well-being and road transport is an irreplaceable<br />
component of trade in all economies. Within the transport<br />
sector, road transport’s market share is the largest and is<br />
increasing due to its superior service, in term of greater flexibility,<br />
reliability, speed and lower probability of damage. The whole<br />
economy depends on road transport that can be further highlighted<br />
by the following enumeration:<br />
●<br />
●<br />
●<br />
Trucks carry nearly 80 % of all goods in industrialized countries,<br />
Everyday trucks deliver 70 kg of goods for every person living<br />
in industrialized countries,<br />
Trucks in Europe pay about 40 billion euro in taxes per year.<br />
54 ● KOMUNIKÁCIE / COMMUNICATIONS 1/2003
C O M M U N I C A T I O N S<br />
I S<br />
PREHĽADY / REVIEWS<br />
po Moskvu, od Istanbulu po Štokholm zamestnávajú prevádzkovatelia<br />
autobusovej <strong>dopravy</strong> okolo 1,8 milió<strong>na</strong> vodičov, mechanikov,<br />
účtovníkov, marketingových expertov a pod. Okrem toho poskytujú<br />
tiež prácu pre vedúcich svetových výrobcov, spoločnosti dodávajúce<br />
súčiastky vozidiel, pre dílerov a ďalšie súvisiace aktivity ako<br />
servisné služby a poisťovanie. Okrem toho ďalších päť miliónov<br />
ľudí v Európe funguje v oblasti podnikania, ktoré je výrazne závislé<br />
od autobusovej <strong>dopravy</strong> ako cestovné kancelárie, hotely, reštaurácie,<br />
múzeá alebo drobné podnikanie [1].<br />
Obrázky 2 a 3 znázorňujú rastúce podiely objemu výkonov<br />
cestnej nákladnej <strong>dopravy</strong> v Slovenskej republike a Európskej únii.<br />
ics, accountants, marketing experts, etc. Furthermore, they also<br />
give work to the world’s leading manufacturers, companies supplying<br />
vehicle components, to dealers and to other bus- or coachrelated<br />
activities, such as inspection and insurance. In addition to<br />
that, another five million people in Europe earn their living in<br />
businesses that are strongly dependent on bus and coach services,<br />
such as travel agencies, hotels, restaurants, museums or the retail<br />
business [1].<br />
Figures 2 and 3 present growing share of the road haulage<br />
transport performance in the Slovak Republic and in the European<br />
Union.<br />
Source: Statistical yearbook of Slovak Republic, 1997, 2000<br />
Obr. 2. Porov<strong>na</strong>nie podielu jednotlivých dopravných odborov v SR <strong>na</strong> prepravnom výkone v rokoch 1993 a 2000<br />
Fig. 2. Comparison of individual modes share on transport performance in Slovak republic in 1993 and 2000<br />
Source: European Commission, EU Transport in Figures, 1998<br />
Obr. 3. Porov<strong>na</strong>nie podielu jednotlivých dopravných odborov v EÚ <strong>na</strong> prepravnom výkone v rokoch 1970 a 1997<br />
Fig. 3. Comparison of individual modes share on transport performance in European union in 1970 and 1997<br />
KOMUNIKÁCIE / COMMUNICATIONS 1/2003 ●<br />
55
C O M M U N I C A T I O N S<br />
I S<br />
PREHĽADY / REVIEWS<br />
2.2 Ekologické aspekty trvalo udržateľného rozvoja,<br />
vplyv cestnej <strong>dopravy</strong> <strong>na</strong> životné prostredie<br />
2.2 Ecological aspects of sustai<strong>na</strong>ble development,<br />
environmental impact of the road transport<br />
Vývoj takmer vo všetkých hospodárskych odvetviach okamžite<br />
ovplyvní oblasť <strong>dopravy</strong>. Inými slovami, rast hospodárstva vedie<br />
automaticky k rastu v oblasti cestnej <strong>dopravy</strong>. Automobilový priemysel<br />
produkuje vozidlá vybavené novými technológiami a prevádzkovatelia<br />
<strong>dopravy</strong> túto oblasť fi<strong>na</strong>ncujú prostredníctvom nákupu<br />
nových nákladných vozidiel a autobusov. Tento proces je<br />
plynulý. Na základe takto závislej spolupráce cestná doprava získala<br />
vedenie v zavádzaní opatrení <strong>na</strong> zachovanie<br />
trvalo udržateľného rozvoja a je možné<br />
poukázať <strong>na</strong> viacero pozoruhodných výsledkov.<br />
Za ostatných 30 rokov prostredníctvom<br />
opatrení týkajúcich sa úspory paliva<br />
došlo v priemere k zníženiu spotreby <strong>na</strong>fty<br />
pri novom 40-tonovom cestnom nákladnom<br />
vozidle z 50 <strong>na</strong> 32 litrov <strong>na</strong> 100 km.<br />
Vzhľadom <strong>na</strong> príslušné hmotnosti to<br />
z<strong>na</strong>mená, že cestná nákladná doprava sa<br />
už dopracovala k 0,9-litrovému vozidlu, čo<br />
predstavuje spotrebu 0,9 litra pohonných<br />
hmôt <strong>na</strong> prepravu 1 tony celkovej hmotnosti<br />
vozidla <strong>na</strong> vzdialenosť 100 km. Vychádzajúc<br />
zo znižovania spotreby paliva a emisií<br />
CO 2 sa ukazuje, že takýto vývoj tiež znižuje úroveň nákladov vozidiel<br />
vo vzťahu k životnému prostrediu. Ťažko možno nájsť lepší<br />
príklad toho, ako môžu ísť ruka v ruke hospodárnosť a ekológia.<br />
Vďaka obrovským investíciám automobilového priemyslu do<br />
nových technológií sa v deväťdesiatych rokoch minulého storočia<br />
podarilo znížiť mieru znečistenia životného prostredia nespálenými<br />
uhľovodíkmi (HC) a oxidmi dusíka (NO x ) <strong>na</strong> polovicu. Ďalšie<br />
závažné znečisťujúce látky – ako pevné častice (PM) a oxid uhoľ<strong>na</strong>tý<br />
(CO) sa podarilo znížiť o 75 %. Existuje viacero dôvodov<br />
takéhoto vývoja. V súčasnosti vyrábané cestné nákladné vozidlá sú<br />
úspornejšie vo vzťahu k spotrebe paliva ako staršie vozidlá. Nové<br />
vozidlá musia spĺňať čoraz prísnejšie emisné predpisy ako staršie<br />
vozidlá. Vývoj emisných predpisov možno sledovať <strong>na</strong> obrázku 5<br />
a úroveň emisií v štátoch EÚ <strong>na</strong> obrázku 6 [2].<br />
Trends in almost all sectors of economy will immediately affect<br />
the transport sector. In other words, growth in economy leads<br />
automatically to growth in transport. As a continuous process the<br />
road transport industry provided new vehicle technology and the<br />
transport operators fi<strong>na</strong>nced it by purchasing new trucks and<br />
coaches. With this mutual dependent partnership road transport<br />
took the lead to introduce measures for mainte<strong>na</strong>nce of sustai<strong>na</strong>ble<br />
development and a lot of<br />
noteworthy successes can be<br />
shown. Over the past 30 years,<br />
fuel-economy measures caused<br />
the average diesel consumption<br />
of a new 40-tonne truck to drop<br />
from 50 to 32 litres per 100 km.<br />
Source: IRU, 2001<br />
Obr. 4. Vývoj spotreby pohonných hmôt návesovej súpravy<br />
s celkovou hmotnosťou 40 ton<br />
Fig. 4. Evolution of fuel consumption 40-tonne truck<br />
Considering the weights<br />
involved, this means that the<br />
road haulage business has<br />
already caught up to the 0,9-<br />
litre car with its 0,9 litres of<br />
fuel consumption per one<br />
tonne of vehicle weight and<br />
for a distance of 100 km. The<br />
resulting decrease in energy consumption and in CO 2 emissions<br />
shows that this development has also dropped the vehicle expenses<br />
related to the environment. There can hardly be a better example<br />
of economy and ecology going hand in hand. Thanks to the giant<br />
road transport industry’s investment into the new technology, the<br />
1990s have seen pollution from trucks – hydrocarbons and nitrogen<br />
oxides – cut by half. The other major pollutants, such as smoke<br />
known as particulate and carbon monoxide have been cut by up<br />
to 75 %. There are several reasons for the above developments.<br />
Firstly, trucks built today are much more fuel-efficient than older<br />
ones. Secondly, new trucks have to meet increasingly stringent<br />
emission norms, which means they are far cleaner that older vehicles.<br />
Fig. 5 illustrates evolution of emission norms and fig. 6 illustrates<br />
emission levels in EU countries [2].<br />
Čo sa týka situácie v Slovenskej<br />
republike, k 1. 8. 2002 bol<br />
počet členov ČESMAD Slovakia<br />
zaoberajúcich sa podnikaním<br />
v medzinárodnej cestnej nákladnej<br />
doprave 1 530, v autobusovej<br />
doprave 85. V roku 2001 títo<br />
dopravcovia obnovili vozidlový<br />
park 149 vozidlami spĺňajúcimi<br />
predpisy EURO 2 a 1 051 vozidlami<br />
spĺňajúcimi predpisy EURO<br />
3. Už z týchto čísel vyplýva, že<br />
v medzinárodnej cestnej nákladnej<br />
doprave <strong>na</strong>stala „mohutná“<br />
obnova vozidlového parku ekologicky<br />
prijateľnými vozidlami.<br />
Source: EU Commission, Auto Oil II<br />
Obr. 5. Vývoj emisných predpisov cestných nákladných<br />
vozidiel v EÚ<br />
Fig. 5. Evolution of commercial vehicle standards in the EU<br />
For situation in the Slovak Republic,<br />
number of members in ČESMAD<br />
Slovakia undertaking in inter<strong>na</strong>tio<strong>na</strong>l<br />
road haulage transport was 1530, in<br />
buses and coaches 85 to 1st August<br />
2002. These operators have renewed<br />
their fleets by purchasing 149 vehicles<br />
that meet the emission norm EURO 2<br />
and 1 051 vehicles that meet the emission<br />
norm EURO 3 in 2001. These<br />
numbers talk about “massive” renewal<br />
of fleets in inter<strong>na</strong>tio<strong>na</strong>l road haulage<br />
transport by purchasing of feasible vehicles<br />
for environment. It relates with<br />
changing of legislation, with preferring<br />
of feasible vehicles for environment and<br />
56 ● KOMUNIKÁCIE / COMMUNICATIONS 1/2003
C O M M U N I C A T I O N S<br />
I S<br />
PREHĽADY / REVIEWS<br />
Súvisí to aj so zmenou legislatívy a preferovaním<br />
ekologických vozidiel a vek<br />
do 6 rokov pri prideľovaní zahraničných<br />
prepravných povolení.<br />
Taktiež pokračujúca obnova vozidlového<br />
parku cestného dopravcu ďalej<br />
znižuje dopad cestnej <strong>dopravy</strong> <strong>na</strong> životné<br />
prostredie. Cestná doprava je pripravená<br />
plynulo dosahovať ďalšie znižovanie<br />
jej <strong>vplyvu</strong> <strong>na</strong> životné prostredie prostredníctvom<br />
obrovských investícií. Do<br />
roku 2015 bude znečistenie životného<br />
prostredia nákladnými vozidlami cestnej <strong>dopravy</strong> znížené o ďalších<br />
30 %.<br />
Špeciál<strong>na</strong> zvuková izolácia a metódy regulácie hluku robia<br />
súčasné vozidlá podstatne tichšími v porov<strong>na</strong>ní s vozidlami vyrobenými<br />
pred niekoľkými rokmi. Rozsiahle investície automobilového<br />
priemyslu, <strong>na</strong>príklad do nových motorov alebo pneumatík,<br />
pomohli znížiť úroveň vibrácií o 25 %, čo je z<strong>na</strong>čný úspech pri<br />
náraste cestnej nákladnej <strong>dopravy</strong> o 40 % za ostatných desať<br />
rokov.<br />
with age of vehicles by dispatching<br />
of licences in inter<strong>na</strong>tio<strong>na</strong>l<br />
road haulage transport too. The<br />
age of vehicles should be no older<br />
than 6 years.<br />
Moreover, the ongoing fleet<br />
renewal within the transport industry<br />
reduces its impact on the environment<br />
even further. The road<br />
transport industry is prepared to<br />
continue with heavy investments<br />
to be able to achieve further<br />
reductions on the environmental impact. By the year 2015, pollution<br />
from trucks will be reduced by another 30 %.<br />
Source: EU Commission, Auto Oil II<br />
Obr. 6. Vývoj emisií v cestnej doprave v EÚ<br />
Fig. 6. Evolution of emissions from road transport in EU<br />
Special insulation and other noise-control techniques make<br />
nowadays trucks substantially quieter than those built just a few<br />
years ago. Huge investments by the road transport industry in, for<br />
example, new engines and tyres have helped reduce annoyance<br />
levels by 25 % a considerable achievement in the light of an<br />
increase of trucking by over 40 % in the last ten years.<br />
2.3 Sociálne aspekty trvalo udržateľného rozvoja<br />
vo vzťahu k cestnej doprave<br />
2.3 Social aspects of sustai<strong>na</strong>ble development<br />
and their relationships with the road transport<br />
Ľudia majú vo zvyku do istej miery zveličovať, pokiaľ ide<br />
o nebezpečenstvo alebo riziko. Vztiahnuté <strong>na</strong> oblasť cestnej <strong>dopravy</strong>,<br />
ak <strong>na</strong>stane dopravná nehoda medzi nákladným vozidlom,<br />
autobusom a osobným automobilom, verejnosť<br />
sa pravdepodobne domnieva, že priestupku<br />
sa dopustilo nákladné vozidlo. Táto<br />
mylná predstava nezodpovedá skutočnosti.<br />
Vo vyspelých krajinách s náležitou infraštruktúrou<br />
v skutočnosti len 5 až 10 % dopravných<br />
nehôd zapríčinia nákladné vozidlá,<br />
zatiaľ čo 90 až 95 % nehôd je zapríčinených<br />
osobnými automobilmi a ostatnými účastníkmi<br />
cestnej premávky. Doprava osobným<br />
automobilom je <strong>na</strong>jviac riziková, pokiaľ ide<br />
o vznik dopravnej nehody (pozri obr. 7).<br />
I keď cestné nákladné vozidlá predstavujú<br />
omnoho menšiu časť z celkového počtu cestných<br />
vozidiel ako osobné vozidlá, <strong>na</strong>priek<br />
tomu je pravdou, že nákladné vozidlá sú<br />
menej často účastníkom dopravných nehôd v pomere k počtu<br />
nehôd <strong>na</strong> cestných komunikáciách. V porov<strong>na</strong>ní s rokom 1970<br />
došlo k zníženiu počtu dopravných nehôd nákladných automobilov<br />
až o 63 %.<br />
Pokiaľ ide o autobusovú dopravu štatistiky hovoria, že autobusová<br />
doprava predstavuje jeden z <strong>na</strong>jbezpečnejších spôsobov prepravy<br />
osôb. Podiel súčasných autobusov <strong>na</strong> smrteľných dopravných<br />
nehodách je menší ako 1 %.<br />
People tend to associate largeness with danger or risk. Transferred<br />
to road traffic, if an accident occurs between a truck, a bus<br />
and another vehicle, the public is likely to presume that the truck<br />
was at fault. The poor image<br />
does not correspond with reality.<br />
In industrialized countries<br />
with proper infrastructure<br />
only 5 % to 10 % of accidents<br />
actually involve trucks,<br />
whereas 90 % to 95 % involve<br />
private cars and other road<br />
users. Transport by private<br />
car represents the most risk<br />
for creation of accident (fig.<br />
7). Even though trucks represent<br />
a much smaller propor-<br />
Source: EU Energy & Transport in Figures, 2001<br />
tion of total road traffic than<br />
private cars, it is nevertheless<br />
true that trucks are less often<br />
involved in traffic accidents in proportion to their number on the<br />
road. The accident rate of trucks has been reduced by over 63 %<br />
compared with rate levels in the 1970s.<br />
Obr. 7. Bezpečnosť prepravy osôb v krajinách EÚ v roku 1998<br />
Fig. 7. Safety in passenger transport in EU<br />
When it comes to buses and coaches, the statistics show that<br />
they represent the safest mode of transport. Today buses and<br />
coaches are involved in less than 1 % of all road accidents resulting<br />
in casualties.<br />
Vo všeobecnosti je ako faktor číslo jed<strong>na</strong> pri dopravných<br />
nehodách chápané ľudské zlyhanie. Akokoľvek doko<strong>na</strong>lá cestná<br />
Human failure is generally viewed as being the number one<br />
factor in traffic accidents. No matter what accomplished the road<br />
KOMUNIKÁCIE / COMMUNICATIONS 1/2003 ●<br />
57
C O M M U N I C A T I O N S<br />
I S<br />
PREHĽADY / REVIEWS<br />
infraštruktúra, akokoľvek optimalizované vozidlo sú zbytočné, ak<br />
vodič nie je dostatočne spôsobilý, existuje veľké riziko vzniku<br />
dopravnej nehody. Náchylnosť k dopravným nehodám je možné<br />
odvrátiť alebo odstrániť prostredníctvom dvoch druhov činností:<br />
výcvikom a vzdelávaním. IRU vydala príručky pre výcvik profesionálnych<br />
vodičov určené inštruktorom pre výcvik vodičov cestných<br />
nákladných vozidiel i autobusov, tým sa kladie dôraz <strong>na</strong><br />
potrebu praktického výcviku pre mladých vodičov <strong>na</strong> typoch vozidiel,<br />
ktoré budú používať. Je tu tiež podčiarknutá prospešnosť skupinového<br />
prístupu k výcviku.<br />
Európska komisia hodnotí vývoj<br />
v doprave ako nerovnomerný. Konštatuje,<br />
že niektoré oblasti v doprave<br />
sa požiadavkám moderného hospodárstva<br />
prispôsobili lepšie, iné<br />
horšie. Toto platí predovšetkým pre<br />
cestnú dopravu, ktorá od zavedenia<br />
voľného pohybu tovaru a osôb zaz<strong>na</strong>me<strong>na</strong>la<br />
rapídny nárast. Na druhej<br />
strane Biela kniha spomí<strong>na</strong> aj<br />
výrazné preťaženie nielen viacerých<br />
hlavných ciest a diaľnic, ale aj železničných<br />
tratí a uzlov, <strong>na</strong>jmä<br />
v mestách a pri letiskách.<br />
infrastructure is, no matter what optimisation of the vehicle is, the<br />
driver had to be competent for elimi<strong>na</strong>tion a high risk of to cause<br />
the accident. Accident-prone behaviour can be averted or<br />
remedied by two types of action: training and education. IRU has<br />
produced professio<strong>na</strong>l driver training handbooks for truck driving,<br />
as well as for coach driving instructors, thereby stressing the need<br />
for young drivers to be given practical training on vehicles of the<br />
type they would be using, and also underlining the usefulness of<br />
a group training approach.<br />
Source: IRU, 2001<br />
Obr. 8. Kľúčové faktory pre ochranu životného prostredia<br />
a bezpečnosť cestnej premávky<br />
Fig. 8. Key factors for environmental performance<br />
and road safety<br />
European Commission considers<br />
the development in transport imbalanced.<br />
It notes that some areas of<br />
transport have adapted to the requirements<br />
of modern economy better than<br />
others. This applies mainly to the road<br />
transport, which has recorded a rapid<br />
development since the introduction of<br />
free movement of goods and persons.<br />
On the other hand the White Paper<br />
mentions also an excessive burden not<br />
only of several main roads and highways,<br />
but also railways and nods,<br />
mainly in cities and close to airports.<br />
Vydanie Bielej knihy v roku 1993 varovne hodnotilo: „Dopravné<br />
zápchy nestoja len nervy, ale aj produktivitu. Úzke miesta a chýbajúce<br />
pripojenia v infraštruktúre, slabé miesta pri interoperabilite<br />
medzi dopravnými nosičmi a systémami, ako aj chýbajúce priesečníky<br />
medzi mnohými do seba uzavretými a ďaleko rozptýlenými<br />
telekomunikačnými systémami. Siete sú vďaka vnútornému<br />
trhu preťažené. Prejavuje sa to v zníženej schopnosti konkurovať<br />
a v tom, že sa premeškávajú šance <strong>na</strong> vytvorenie nových trhov<br />
a utvára sa menej pracovných miest, ako by bolo za iných podmienok<br />
možné.“<br />
Napriek tomu, že väčši<strong>na</strong> zúžených miest sa vzťahuje <strong>na</strong> mestá,<br />
je transeurópska sieť trvalo preťažená. Podľa údajov Európskej<br />
komisie vznikajú denne <strong>na</strong> 7 500 kilometroch (čo predstavuje 10 %<br />
celkovej siete) dopravné zápchy. Spolu 16 000 kilometrov železničnej<br />
siete (20 % celej siete) sa považuje za zúžené miesta. Na 16<br />
<strong>na</strong>jväčších letiskách Európskej únie dochádza pri 30 % letov<br />
k meškaniam dlhším ako štvrť hodiny. Čo sa týka cestnej <strong>dopravy</strong>,<br />
prognózy Európskej komisie <strong>na</strong> rok 2010 znejú dosť dramaticky.<br />
Očakáva sa nárast nákladov spôsobených jednotlivým firmám kvôli<br />
dopravným zápcham až o 142 %, čo predstavuje 80 miliárd eur<br />
ročne, čiže približne percento hrubého domáceho produktu členských<br />
krajín EÚ.<br />
Počet dopravných nehôd je závislý od kapacity a kvality cestnej<br />
infraštruktúry. Kapacitnejšia a kvalitnejšia cestná infraštruktúra<br />
sa prejaví znížením počtu smrteľných dopravných nehôd (pozri<br />
obr. 10). Samozrejme, <strong>na</strong> znížení počtu smrteľných dopravných<br />
nehôd sa výrazne podieľa aj automobilový priemysel prostredníctvom<br />
nových technológií pre zvyšovanie bezpečnosti vozidiel [4].<br />
The publication of White Paper in 1993 warned: “The traffic<br />
congestions do not cost us only nerves, but also productivity.” The<br />
bottleneck and missing links in infrastructure and weaknesses in<br />
interoperability between transport carriers and systems, as well as<br />
lacking intersections between many closed and dispersed telecommunication<br />
systems. Due to the single market the networks are<br />
congested. This is reflected in the reduced capacity to compete<br />
and in missing the chances to create new markets, hence less new<br />
jobs are created than would be possible under different circumstances.<br />
Despite the fact that most bottlenecks relate to cities, the<br />
trans-European network is permanently congested. According to<br />
data of the European Commission there are traffic congestions on<br />
7 500 kilometres a day (which is 10 % of the total network). A total<br />
of 16 000 kilometres of railways (20 % of the total network) is considered<br />
bottlenecks. At 16 of the largest airports of the European<br />
Union some 30 % of flights are delayed by more than 15 minutes.<br />
As regards road transport, the projections of the European Commission<br />
for the year 2010 sound quite dramatic. A growth of costs<br />
incurred by companies due to traffic congestions by as much as<br />
142 % is expected, which is 80 billion euro a year, i. e. approximately<br />
one percent of the gross domestic product of the EU member<br />
states.<br />
The number of the road accidents depends to capacity and<br />
quality of the road infrastructure. More capacitive and qualitative<br />
road infrastructure will manifest by reduction the number of fatalities<br />
(fig. 10). Of course, the road vehicle industry markedly participates<br />
on reduction of number of fatalities by new vehicle technologies<br />
for vehicle safety rising too.<br />
58 ● KOMUNIKÁCIE / COMMUNICATIONS 1/2003
C O M M U N I C A T I O N S<br />
I S<br />
PREHĽADY / REVIEWS<br />
Source: IRU, 2001<br />
Obr. 9. Vplyv preťaženosti cestnej siete <strong>na</strong> spotrebu pohonných hmôt<br />
vozidla cestnej nákladnej <strong>dopravy</strong><br />
Fig. 9. Road congestion increases fuel consumption of road haulage<br />
transport vehicle<br />
Source: EU Energy & Transport in Figures, 2001<br />
Obr. 10. Vzťah medzi vývojom diaľničnej infraštruktúry<br />
a bezpečnosťou cestnej premávky v EÚ<br />
Fig. 10. Evolution of motorway infrastructure<br />
and road safety in EU<br />
Udržateľnosť = prospešnosť Tab. 1<br />
Moduly IRU Výhody pre životné prostredie Výhody pre prevádzkovateľa cestnej <strong>dopravy</strong><br />
Vzdelávanie a výcvik vodičov ● Menej dopravných nehôd ● Menšie prestoje vozidla<br />
● Nižšia spotreba pohonných hmôt<br />
● Nižšie náklady <strong>na</strong> poistenie<br />
● Nižšia miera emisií CO 2<br />
● Väčšia spoľahlivosť<br />
● Nižšie náklady <strong>na</strong> pohonné hmoty<br />
Systémy riadenia životného prostredia ● Nižšia miera emisií (CO, NOx, HC, PM) ● Nižšie poplatky a dane<br />
● Menšie množstvo odpadov<br />
● Nižšie náklady <strong>na</strong> pohonné hmoty<br />
● Nižšia spotreba vody, pohonných hmôt<br />
● Nižšie účty za vodu<br />
a ďalšieho materiálu<br />
● Nižšie náklady <strong>na</strong> energiu<br />
Sustai<strong>na</strong>bility = profitability Table 1<br />
IRU Modules Benefits for the environment Benefits for the road transport operator<br />
Education and training of drivers ● Less accidents ● Less vehicle downtime<br />
● Lower fuel consumption<br />
● Lower insurance costs<br />
● Less CO 2 emissions<br />
● More reliability<br />
● Lower fuel costs<br />
Environmental ma<strong>na</strong>gement systems ● Less emissions (CO, NOx, HC, PM) ● Lower taxes and charges<br />
● Less waste<br />
● Lower fuel costs<br />
● Less consumption of water, fuel and<br />
● Lower water bill<br />
other resources<br />
● Lower power cost<br />
Source: IRU, 2000<br />
3. Záver<br />
Podľa záverov Európskej komisie by bolo <strong>na</strong>jjednoduchším<br />
riešením stlmiť celkovú mobilitu osôb a tovaru. Takáto predstava je<br />
nereál<strong>na</strong> už len preto, lebo EÚ nedisponuje ani dostatočnými právomocami,<br />
ale ani prostriedkami predpisovať obmedzenia <strong>dopravy</strong><br />
v jednotlivých mestách, prípadne <strong>na</strong> cestách. Okrem toho sa viaceré<br />
členské štáty zásadne vyslovili proti spoločnému zákazu jázd počas<br />
víkendov – čo je aj z hľadiska <strong>na</strong> individuálne podmienky a situáciu<br />
v regiónoch pochopiteľné.<br />
Biela kniha si do roku 2010 stanovila štyri hlavné ciele:<br />
1. premiestniť rovnováhu medzi jednotlivými druhmi <strong>dopravy</strong>,<br />
3. Conclusion<br />
The conclusions of the European Commission suggest that the<br />
easiest solution would be to slow down the total mobility of people<br />
and goods. This idea is unrealistic, since the EU does not have sufficient<br />
powers nor means to stipulate transport restrictions in individual<br />
cities or on roads. Apart from that several member states<br />
have clearly expressed themselves against the common prohibition<br />
of driving at weekends – which is understandable also given<br />
the individual conditions and situations in the regions.<br />
The White Paper has set four main goals until the year 2010:<br />
1. Relocate the equilibrium among individual modes of transport,<br />
KOMUNIKÁCIE / COMMUNICATIONS 1/2003 ●<br />
59
C O M M U N I C A T I O N S<br />
I S<br />
PREHĽADY / REVIEWS<br />
2. eliminovať úzke miesta,<br />
3. umiestniť používateľa do centra dopravnej politiky, ktoré sa<br />
tiež zaoberá zaťažením infraštruktúry,<br />
4. riadiť globalizáciu <strong>dopravy</strong>.<br />
Z ekonomického hľadiska a pri prihliadnutí <strong>na</strong> právomoci<br />
Európskej únie sú <strong>na</strong> uskutočnenie týchto cieľov pripravené tri<br />
varianty:<br />
a) Najväčší dôraz sa bude klásť <strong>na</strong> cestnú dopravu, ktorá by sa<br />
stala hlavným predmetom reštriktívnych opatrení, ako <strong>na</strong>príklad<br />
zvýšenie daní, poplatkov.<br />
b) Stredobodom pozornosti by bolo opäť spoplatňovanie cestnej<br />
<strong>dopravy</strong> a sprievodné opatrenia, ktoré by zvyšovali efektívnosť<br />
iných dopravných odvetví (<strong>na</strong>pr. zlepšenie kvality služieb a logistiky,<br />
presadenie technických opatrení). Tento variant však<br />
nezahŕňa ďalšie investície do novej infraštruktúry.<br />
c) Tretí variant, o ktorý sa opiera Biela kniha, zahrňuje rad opatrení,<br />
ktoré podporujú spoplatňovanie aj revitalizáciu iných<br />
dopravných odvetví nielen cestnej <strong>dopravy</strong>. Súčasne sa počíta<br />
s cielenými investíciami do transeurópskej siete. Táto verzia sa<br />
delí <strong>na</strong> 60 opatrení do roku 2010, ktoré by mali zabezpečiť<br />
rovnomernosť medzi rastom v hospodárstve a v doprave bez<br />
toho, aby sa obmedzila mobilita osôb a tovaru (jeden z pilierov<br />
EÚ). Nárast v cestnej doprave by vzhľadom <strong>na</strong> lepšie využitie<br />
iných dopravných odvetví nemal vyvrcholiť do obávaných<br />
čísel (<strong>na</strong>miesto +50 % by to v období medzi 1998 a 2010 bolo<br />
+38 %).<br />
Z iniciatívy IRU vznikol dokument „Smerovanie k trvalo udržateľnému<br />
rozvoju“, ktorý pripravuje cestu pre prijímanie konkrétnych<br />
opatrení všetkých strán zúčastnených <strong>na</strong> dosahovaní tohto<br />
spoločného cieľa. Smerovanie k trvalo udržateľnému rozvoju definuje<br />
tri nevyhnutné podmienky pre realizáciu trvalo udržateľného<br />
rozvoja.<br />
I. Inovácia<br />
Ekologickejšie a tichšie vozidlá s úspornejšou spotrebou paliva,<br />
kvalitnejšie pohonné hmoty a zlepšená organizácia prepravy, to je<br />
len niekoľko opatrení pre zlepšenie <strong>vplyvu</strong> cestnej <strong>dopravy</strong> <strong>na</strong><br />
životné prostredie.<br />
II. Motivácia<br />
Automobilový priemysel potrebuje iniciatívnu podporu pri<br />
zavádzaní technológií a postupov trvalo udržateľného rozvoja zo<br />
strany jednotlivých krajín. Pri poz<strong>na</strong>ní výz<strong>na</strong>mných minulých<br />
a budúcich výsledkov, automobilový priemysel bude pokračovať<br />
v znižovaní jeho vplyvov <strong>na</strong> životné prostredie súbežne s rozvojom<br />
hospodárstva. Avšak za dosahovanie trvalo udržateľného rozvoja<br />
budú musieť zobrať <strong>na</strong> seba svoj diel zodpovednosti obchodní<br />
partneri a vláda vo vzťahu k cestnej doprave.<br />
III. Infraštruktúra<br />
Dopravné zápchy spôsobujú škody hospodárstvu, spoločnosti<br />
i životnému prostrediu. Lepšie využívanie existujúcej cestnej infraštruktúry<br />
zahŕňajúce uprednostňovanie <strong>dopravy</strong> pre obchodné účely<br />
2. Elimi<strong>na</strong>te bottlenecks,<br />
3. Place the user at the centre of transport policy, that is also<br />
dealing with the burden on infrastructure,<br />
4. Ma<strong>na</strong>ge the globalisation of transport.<br />
From the economic point of view and taking account of the<br />
powers of the European Union three alter<strong>na</strong>tives were prepared<br />
for the implementation of these goals:<br />
a) Most emphasis will be placed on road transport that should<br />
become the main subject of restrictive measures, such as taxes<br />
or fees increases,<br />
b) The tariffs on road transport and accompanying measures<br />
should be at the centre of attention, to enhance the efficiency<br />
of other transport sectors (e. g. enhancing the quality of services<br />
and logistics, implementation of technical measures).<br />
This alter<strong>na</strong>tive however does not include investment into<br />
new infrastructure.<br />
c) The third alter<strong>na</strong>tive, supported by the White Paper<br />
includes a series of measures favouring the tariffs on roads and<br />
revitalisation of other transport sectors, not only road transport.<br />
At the same time, targeted investments into the trans-European<br />
network are expected. This version is subdivided into 60 measures<br />
until the year 2010, which should ensure a balanced<br />
growth in the economy and transport without restricting the<br />
mobility of persons and goods (one of the pillars of the EU).<br />
Given the better use of other modes of transport, the growth<br />
in road transport should not culmi<strong>na</strong>te in those feared figures<br />
(instead of + 50 % it would only be + 38 % between 1998 and<br />
2010).<br />
The proactive IRU initiative “Driving towards sustai<strong>na</strong>ble<br />
development”, which paves the way for concrete actions to be taken<br />
by all parties concerned in achieving this common goal. Driving<br />
towards sustai<strong>na</strong>ble development defines the three prerequisites<br />
to implement sustai<strong>na</strong>ble development.<br />
I. Innovation<br />
More ecological, more quiet and more fuel-efficient vehicles,<br />
better fuel quality and improved logistics are just a few measures<br />
for improving environmental performance of road transport.<br />
II. Incentive<br />
The road transport industry needs governments to encourage<br />
rapid implementation of sustai<strong>na</strong>ble development technologies<br />
and practices with positive incentives. Recognizing the significant<br />
past and future successes of these efforts, the road transport industry<br />
will continue to reduce its environmental effects while driving<br />
economic development. However, to achieve sustai<strong>na</strong>ble development,<br />
road transport’s commercial and governmental partners<br />
will have to take responsibility for their fair share.<br />
III. Infrastructure<br />
There are a lot of damages caused by the traffic congestions for<br />
the <strong>na</strong>tio<strong>na</strong>l economy, the society and the environment. Making<br />
better use of the existing road infrastructure, including giving priority<br />
to commercial traffic for economic reasons, and investing in<br />
60 ● KOMUNIKÁCIE / COMMUNICATIONS 1/2003
C O M M U N I C A T I O N S<br />
I S<br />
PREHĽADY / REVIEWS<br />
z hospodárskych dôvodov a investovanie do nevyhnutného rozvoja<br />
cestnej infraštruktúry sú nevyhnutné podmienky pre dosiahnutie<br />
všeobecných cieľov a zásad trvalo udržateľného rozvoja [4].<br />
Je potrebné, aby sa tieto ciele rozpracovali do konkrétnych<br />
úloh <strong>na</strong>pĺňajúcich aktuálne zásady štátnej dopravnej politiky SR.<br />
the necessary road infrastructure development, are sine qua non<br />
conditions for achieving the general goals and principles of sustai<strong>na</strong>ble<br />
development [4].<br />
It is necessary to elaborate these goals into the concrete<br />
problems that respect actual principles of state transport policy of<br />
Slovak Republic.<br />
Literatúra – References<br />
[1] GNAP, J. a kol.: Ekonomické a kvalitatívne vplyvy implementácie legislatívy EÚ do legislatívy SR v oblasti cestnej <strong>dopravy</strong>, Výskumná<br />
úloha VEGA č. 1/8183/01, Žilinská <strong>univerzita</strong> v Žiline, Žili<strong>na</strong> 2001<br />
[2] PERNÝ, V.: Trendy a vývoj emisních limitů pro motorová vozidla, In zborník príspevkov z 1. medzinárodnej konferencie „Cestná<br />
a mestská doprava a trvalo udržateľný rozvoj”, Žili<strong>na</strong> 12. – 13. 6 2001, Žilinská <strong>univerzita</strong> v Žiline, Žili<strong>na</strong> 2001<br />
[3] TISOVSKÝ, J.: Dopravná politika, jej stratégie a nástroje pre trvale udržateľný rozvoj, In zborník príspevkov z 1. medzinárodnej konferencie<br />
„Cestná a mestská doprava a trvalo udržateľný rozvoj”, Žili<strong>na</strong> 12. – 13. 6 2001, Žilinská <strong>univerzita</strong> v Žiline, Žili<strong>na</strong> 2001<br />
[4] www.iru.org<br />
[5] Biela kniha – Európska dopravná politika do r. 2010 – čas rozhodnutia, Úradný vestník Európskej komisie, Brusel 2001<br />
KOMUNIKÁCIE / COMMUNICATIONS 1/2003 ●<br />
61
C O M M U N I C A T I O N S<br />
I S<br />
PREHĽADY / REVIEWS<br />
Peter Patek – Jaroslav Borský – Ivan Kotvan *<br />
PLAVIDLO PRE KOMPLEXNÉ ZÁSOBOVANIE<br />
A ZBER ODPADOV LODÍ NA DUNAJI<br />
A VESSEL FOR THE COMPLEX SUPPLYING AND WASTES COLLECTION<br />
OF INLAND SHIPS ON THE DANUBE<br />
Bezpečné a spoľahlivé zásobovanie palivami a zber odpadov je<br />
dôležité pre nepretržitú plavbu a ochranu životného prostredia. Na<br />
tieto účely bolo <strong>na</strong>vrhnuté a postavené zásobovacie plavidlo. Investorom<br />
je Slovenská plavba a prístavy Bratislava a staviteľom H.A.W.K.<br />
Bratislava. Projekt a konštrukcia boli vyhotovené <strong>na</strong> Katedre automobilov,<br />
lodí a motorov Slovenskej technickej univerzity v Bratislave.<br />
Príspevok predstavuje projekt a celkové riešenie takéhoto plavidla.<br />
Safe and reliable outgoing/filling of fuels and collection of sewage<br />
is important for continuous <strong>na</strong>vigation and environmental protection.<br />
The supply vessel on the base of DEIIb barge was designed and built up<br />
for these purposes. The investor is the Division Port of Slovak Navigation<br />
and Ports Comp. and the builder is H.A.W.K. Comp. in Bratislava.<br />
The design and construction are made by the Department of Cars,<br />
Ships and Engines, Slovak University of Technology in Bratislava.<br />
This contribution demonstrates the project and general arrangement<br />
of this vessel.<br />
1. Úvod<br />
Termi<strong>na</strong>l bol <strong>na</strong>vrhnutý a postavený <strong>na</strong> báze čl<strong>na</strong> DEIIb –<br />
rekonštrukcia <strong>na</strong> tankový čln ako čerpacia stanica palivovej <strong>na</strong>fty<br />
(trieda K3, i. č. 1202) a mazacích olejov a kompletný odber<br />
a úprava tekutých a pevných odpadov, obr. 1, 3. Rekonštrukcia <strong>na</strong><br />
hladkopalubový čln (sily sú odrezané v úrovni paluby) bola projektovaná<br />
v zmysle pravidiel GL, ČSLR a ADN. Plnenie tankov je<br />
1. Introduction<br />
The supplying termi<strong>na</strong>l was designed and built up on the base<br />
of the barge DEIIb as a reconstruction to the tank barge for supplying<br />
the ships with diesel fuel (Class K3, i.number 1202) and<br />
lubrication oils and for complex collection of liquid and solid<br />
wastes, Fig. 1, 3. Reconstruction to the trunkless barge (hatch<br />
coamings were cut on the deck level) was projected by GL, ČSLR<br />
Obr. 1 Celková dispozícia plavidla<br />
Fig. 1 General arrangement of the vessel,<br />
* 1 Peter Patek, 1 Jaroslav Borský, 2 Ivan Kotvan<br />
1 Department of Cars, Ships and Engines, Faculty of Mechanical Engineering, Slovak University of Technology, Nám. slobody 17, 81231 Bratislava,<br />
Tel.: 0257296379, E-mail: patek@sjf.stuba.sk,<br />
2 Slovak Navigation and Ports, Division Port Bratislava, Tel.: 0253414532, E-mail: kotvan.portba@spap.sk<br />
62 ● KOMUNIKÁCIE / COMMUNICATIONS 1/2003
C O M M U N I C A T I O N S<br />
I S<br />
PREHĽADY / REVIEWS<br />
ako základné riešené z brehu ako aj s možnosťou plnenia <strong>na</strong>fty aj<br />
z lodí <strong>na</strong> návodnom boku, obr. 2.<br />
Ku korme je pripojený zásobovací pontón pre malé plavidlá<br />
tak, aby výška boku cca 0,6 m bola stabilná bez ohľadu <strong>na</strong> <strong>na</strong>loženie<br />
hlavného čl<strong>na</strong>. Tento pontón slúži hlavne pre malovýdaj <strong>na</strong>fty<br />
a benzínov.<br />
Prístup <strong>na</strong> termi<strong>na</strong>l zabezpečujú dve lávky šírky 1,0 a 2,5 m<br />
z ľavého brehu rieky.<br />
and ADN rules. Tanks filling (diesel and lubrications) is designed<br />
from the river bank connection primarily and from tankships on<br />
the water side of vessel secondary, Fig. 2.<br />
The supplying pontoon for small craft is connected with aft<br />
with condition: the pontoon freeboard of approximately 0.6 m must<br />
be constant regardless of the main vessel loading. This pontoon<br />
serves for the supplying of mainly small craft with diesel and petrol<br />
fuel.<br />
The access to the termi<strong>na</strong>l vessel is provided by two footbridges<br />
1.0 and 2.5 m beam from the left bank of the river.<br />
Obr. 2 Rozmiestnenie tankov<br />
Fig. 2 Tanks arrangement<br />
Obr. 3 Obslužné plavidlo v Bratislavskom prístave<br />
Fig. 3 Supply vessel in Bratislava port<br />
2. Hlavné údaje<br />
Hlavné rozmery Tab. 1<br />
Dĺžka maximál<strong>na</strong> L OA 76,5 m<br />
Dĺžka <strong>na</strong> HVR pri ponore T 2,5 m L HVR 74,9 m<br />
2. Main data<br />
Main dimensions Table 1<br />
Length over all L OA 76.5 m<br />
Length on CWL at drought T 2,5 m L HVR 74.9 m<br />
KOMUNIKÁCIE / COMMUNICATIONS 1/2003 ●<br />
63
C O M M U N I C A T I O N S<br />
I S<br />
PREHĽADY / REVIEWS<br />
Šírka maximál<strong>na</strong> B 11,0 m<br />
Výška boku / telesa trupu H 3,2 / 3,7 m<br />
Výška maximál<strong>na</strong> H fix m 8,31 m<br />
Ponor (max.) T 2,2 m<br />
Výtlak čl<strong>na</strong> pri stred. ponore 2,2 m D 1710 t<br />
Výtlak prázdneho čl<strong>na</strong> Do 523 t<br />
Stredný ponor prázdneho čl<strong>na</strong> To 0,71 m<br />
Voľný bok pri plnom <strong>na</strong>ložení FB 0,96 m<br />
Plavebná zó<strong>na</strong> 2<br />
Celkový objem tankov, podľa ciach. V TANKS 1394,3 m 3<br />
Maximal beam B 11.0 m<br />
Depth (side)/ hull body H 3.2 / 3.7 m<br />
Maximal high from BL H fix m 8.31 m<br />
Drought (max.) T 2.2 m<br />
Displacement at mid. drought 2,2 m D 1710 t<br />
Displacement light Do 523 t<br />
Light drought of barge To 0.71 m<br />
Freeboard at full load FB 0.96 m<br />
Navigation zone 2<br />
Total tank capacity, by the gauge V TANKS 1394.3 m 3<br />
Objemy tankov Tab. 2<br />
Z celkového objemu 1394,3 m 3 : <strong>na</strong>fta 1093,4 m 3 8 tankov<br />
oleje 55,0 m 3 3 tankov – 3 druhy<br />
benzín 5,5 m 3 pre jachty<br />
opotreb. oleje 31,9 m 3<br />
drenážne vody 141,8 m 3<br />
fekálie 61,3 m 3 2 prepojené tanky<br />
odlúčené oleje 5,4 m 3<br />
pevné odpady<br />
6 nádob<br />
Tanks capacity Table 2<br />
From total capacity 1394.3 m 3 : diesel 1093.4 m 3 8 tanks<br />
lubrication oils 55.0 m 3 3 tanks – 3 kinds<br />
petrol 5.5 m 3 for small craft<br />
used oils 31.9 m 3<br />
bilge waters 141.8 m 3<br />
black&gray waters 61.3 m 3 2 connected tanks<br />
separated oils 5.4 m 3<br />
solid wastes<br />
6 contain.<br />
3. Celková koncepcia<br />
3. General conception<br />
Obr. 4 Koncepcia hlavného rebra a <strong>na</strong>dstavby<br />
Fig. 4 Midship section and superstructure conception<br />
Plavidlo bolo postavené z trupu tlačného čl<strong>na</strong> DEIIb juhoslovanskej<br />
výroby (priečny systém vystuženia d<strong>na</strong>) <strong>na</strong> tankový čln<br />
dvojplášťovej konštrukcie typu N (ADN) pre látky triedy K3 (GL).<br />
Vnútro pôvodného priestoru je rozdelené sústavou priečnych a pozdĺžnych<br />
predelov <strong>na</strong> 17 tankov. Doplnené sú koferdamy <strong>na</strong> čele<br />
The vessel was built up from the hull of the Jugoslavian push<br />
barge DEIIb (transversal bottom construction system) as a reconstruction<br />
to a twoskin tank barge, ADN type N for goods GL<br />
Class K3 (diesel fuel). The inner space of the origi<strong>na</strong>l hatch compartment<br />
was divided by a system of longitudi<strong>na</strong>l and transversal<br />
64 ● KOMUNIKÁCIE / COMMUNICATIONS 1/2003
C O M M U N I C A T I O N S<br />
I S<br />
PREHĽADY / REVIEWS<br />
a korme, <strong>na</strong>dstavba <strong>na</strong> korme, prístrešok <strong>na</strong> čele a kompletná čerpacia<br />
a sig<strong>na</strong>lizačná technológia. Návrh zabezpečuje aj komplexný<br />
odber a spracovanie odpadov z plavidiel ako aj predaj prevádzkových<br />
tovarov.<br />
Termi<strong>na</strong>l je bez elektrocentrály a zdroj elektrickej energie<br />
a prívod vody sa zabezpečuje brehovou prípojkou.<br />
Plavidlo je <strong>na</strong>vrhnuté pre trvalé vyviazanie k brehu s <strong>na</strong>pojením<br />
<strong>na</strong> potrubné sústavy <strong>na</strong>fty a olejov z brehu.<br />
bulkheads to 17 tanks. There are: fore and aft cofferdams, superstructure<br />
on aft, porch on fore and complete pump, control and<br />
sig<strong>na</strong>l technology. The design ensures the complex collection of<br />
wastes from ships and the sale of other operatio<strong>na</strong>l goods, too.<br />
The termi<strong>na</strong>l has no generators and electricity source and fresh<br />
water conduction is ensured from the left bank connections.<br />
The vessel is designed for permanent bank mooring with connections<br />
with pipe systems of diesel fuel and lubrication oils from<br />
the river bank.<br />
4. Konštrukcia trupu<br />
4. Hull construction<br />
Prebudovanie trupu čl<strong>na</strong> spočíva vo vytvorení nákladového<br />
priestoru tankov jedným centrálnym predelom od r. č. 40 po r. č.<br />
138 a štyrmi priečnymi predelmi<br />
v hlavnom nákladovom priestore.<br />
Takto vznikne 8 tankov <strong>na</strong> <strong>na</strong>ftu s objemom<br />
do 1110 m 3 . Predely tankov<br />
sú rozmiestnené s cieľom dosiahnutia<br />
približne rov<strong>na</strong>kého objemu každého<br />
tanku.<br />
Tanky olejov sú v rozsahu r. č. 35<br />
po r. č. 40 rozdelené dvoma pozdĺžnymi<br />
predelmi v rozstupe 6400 mm<br />
<strong>na</strong> tri tanky.<br />
V rozsahu r. č. 32 až 35 je po<br />
celej šírke pôvodného nákladového<br />
priestoru tank <strong>na</strong> opotrebované oleje.<br />
Úsek r. č. 6 až 32 je vyčlenený <strong>na</strong><br />
zber tekutých odpadov. Pozdĺžne<br />
predely v rozstupe 6400 mm vyčleňujú<br />
trup <strong>na</strong> stredový tank zberu<br />
drenážnych vôd a priestor pre čističky.<br />
Po bokoch po vnútorné boky sú<br />
rozmiestnené tanky fekálií, tank <strong>na</strong><br />
odlúčené oleje a nádrž <strong>na</strong> benzín. Fekálne<br />
tanky po bokoch sú vzájomne<br />
prepojené dvoma potrubiami DN<br />
300.<br />
Pôvodné teleso je riešené v zmiešanom type vystuženia: dno –<br />
priečny systém, boky a paluba/ochodze – pozdĺžny systém. Korma<br />
a čelo sú v priečnom systéme vystuženia. Všetky predely a koferdamy<br />
sú z plechov hrúbky 6 mm a vystužené sú zvislými výstuhami<br />
L80606 mm po 500 mm. Hladká paluba tankov (bez<br />
tronku) je z lístkového plechu v strednej časti 8 mm a ku koncom<br />
znížená <strong>na</strong> 6 mm. Vystuženie paluby je riešené v pozdĺžnom<br />
systéme profilmi L80606. Palubníky v rozstupe a r 2000 mm<br />
po celej palube sú tvorené zhranenými profilmi L2601006.<br />
Pôvodný sil bol zrezaný v úrovni paluby.<br />
Celkové riešenie je vidieť <strong>na</strong> obr. 1 a 3. Na deviatich veľkých<br />
tankoch sú umiestnené expanzné šachty s objemom po 1,06 m 3<br />
(min 0,75 % objemu tanku) s obrubnicou 6 mm výšky 800 mm.<br />
Nadstavba je riešená ako dvojpodlažná, klasickým lodným spôsobom<br />
z plechu 4 mm. Spodné podlažie v úrovni hlavnej paluby<br />
The barge hull reconstruction is based on the performance of<br />
tanks cargo compartments with one central longitudi<strong>na</strong>l bulkhead<br />
from fr. No. 40 to fr. No. 138 and<br />
four transversal bulkheads in a cargo<br />
compartment. The result is 8 tanks<br />
for diesel fuel with a total capacity of<br />
1100 m 3 . Transversal bulkheads are<br />
located for approximately equal capacity<br />
of each tank.<br />
The tanks for lubrication oils are<br />
located between fr. No. 35 to fr. No.<br />
40 and they are divided by two long.<br />
bulkheads with spacing of 6400 mm<br />
to three tanks.<br />
There is a tank for used oils on<br />
full origi<strong>na</strong>l cargo space between fr.<br />
No. 32 to fr. No. 35.<br />
The compartment fr. No. 6 to fr.<br />
No. 32 is designed for liquid wastes<br />
collection. The longitudi<strong>na</strong>l bulkheads<br />
with spacing of 6 400 mm divided hull<br />
to the central tank for bilge waters<br />
collection and compartment for two<br />
sewage plants. The tanks for black&<br />
gray waters, separated oils and petrol<br />
Obr. 5 Paluba plavidla<br />
tank are located on both sides. Black&<br />
Fig. 5 Vessel deck,<br />
gray tanks on sides are connected with<br />
two DN300 pipes.<br />
The origi<strong>na</strong>l hull was built up in a mixed construction system:<br />
bottom – transversal system, sides and deck/gangboards – longitudi<strong>na</strong>l<br />
system. The fore and aft are in a transversal construction<br />
system. All bulkheads are made from 6 mm thickness plates and<br />
reinforced with vertical L80606 mm in 500 mm spacing. The<br />
smooth deck (without trunk) is welded from leaf plates of 8 mm<br />
in the mid part and on the ends the thickness is reduced to 6 mm.<br />
The deck reinforcement is made in a longitudi<strong>na</strong>l construction<br />
system with profiles of L80606. The deck beams from bend<br />
profiles of L2601006 have spacing a r 2000 mm, origi<strong>na</strong>l<br />
hatch coamings were cut on the deck level.<br />
The general arrangement is in Figs. 1 and 3. The expansion<br />
hatches with a capacity of 1.06 m 3 (min. 0.75 % capacity of the<br />
tank) and 800 mm high coaming are located on nine large tanks.<br />
The two-deck superstructure is designed as a classical ship<br />
construction from 4 mm plates. The down deck in the main deck<br />
KOMUNIKÁCIE / COMMUNICATIONS 1/2003 ●<br />
65
C O M M U N I C A T I O N S<br />
I S<br />
PREHĽADY / REVIEWS<br />
Obr. 6 Prestavba lode<br />
Fig. 6 Rebuilding of the ship<br />
kryje priestor čističiek a druhá paluba slúžia ako klimatizovaný<br />
velín, sklad a WC. Oba boky sú prepojené priebežnou chodbou<br />
š. 1000 mm. Hrubé riešenie je vidieť <strong>na</strong> obr. 1. Čističky sú umiestnené<br />
vo výreze hlavnej paluby 64004500 mm v zvýšenej úrovni<br />
<strong>na</strong>d vnútorným dnom pre zabezpečenie odtoku čistej vody za<br />
pravý bok.<br />
Okolo <strong>na</strong>dstavby je zvýšená ochodza 650 mm <strong>na</strong>d palubou,<br />
z ktorej je prístup <strong>na</strong> 3 schodištia <strong>na</strong>dstavby. Vytvorená je pororoštami<br />
1000 mm.<br />
V dôsledku zvýšeného sústredeného zaťaženia pod výdajným<br />
ramenom sú dobudované príslušné základy a zosilnená konštrukcia<br />
paluby v mieste uchytenia základov profilmi 2601006 a stĺpikmi<br />
TR.1146,3.<br />
Obr. 7 Poloha čerpadiel olejov<br />
Fig. 7 Position of lubrication oil pumps<br />
Výdaj <strong>na</strong>fty sa uskutočňuje cez<br />
tankovacie rameno Marine Loader<br />
B0028 – 4“ (DN 100) firmy<br />
EMCO WHEATON GmbH, Germany.<br />
Dosah rame<strong>na</strong> cca 8 m <strong>na</strong><br />
dĺžke cca 12 m, manipulácia s ramenom<br />
môže byť vďaka protizávažiu<br />
ručná. Kapacita cca 1000<br />
l/min cez dve čerpadlá, snímaciu<br />
a meraciu automatiku s vyhodnotením<br />
do centrálneho PC. Výdajné<br />
potrubie je DN 100. Stáčanie<br />
z brehu resp. z lodí je cez cenlevel<br />
covers the compartment of sewage plants, the upper deck is<br />
an air-conditioned control station, storage and toilette. Both sides<br />
are connected with a transversal passage of 1000 mm breadth.<br />
The conception is in Fig.3. The sewage plants are located in the<br />
deck cut with 64004500 mm in position approx. 800 mm from<br />
inner bottom.<br />
There is a higher gangboard of 650 mm around the superstructure<br />
over the main deck and from there three stairways are<br />
accessible to the superstructure. This gangboard is made from<br />
pore grates of 1000 mm.<br />
Deck under the marine loader is reinforced due to high loading<br />
forces. Foundations are made from profiles 2601006 and<br />
pipes 1146.3.<br />
5. Potrubné sústavy<br />
Projektové riešenie potrubných sústav bol projekčnou dodávkou<br />
firmy EXPRO, s.r.o. Šaľa a tu bude vymenované súhrnne.<br />
Ostatná technológia stáčania a výdaja pozostáva z <strong>na</strong>sledujúcich<br />
prevádzkových súborov.<br />
Technológia plnenia<br />
a výdaja <strong>na</strong>fty<br />
5. Pipes systems<br />
The project solution of pipes systems was delivered by EXPRO,<br />
s.r.o. Šaľa and it will be generally described here. Technology of<br />
the filling and issuing is assembled from these operatio<strong>na</strong>l files.<br />
Technology of diesel fuel filling<br />
and issuing<br />
Obr. 8 Plniace a výdajné potrubie<br />
Fig. 8 Filling and issuing pipes<br />
Diesel fuel issuing is made<br />
over issuing arm of Marine Loader<br />
B0028 – 4” (DN 100) EMCO<br />
WHEATON GmbH, Germany.<br />
The arm range is 8 m on the portside<br />
vessel at the length of 12 m<br />
approximately and with manual<br />
handling. The maximal flow capacity<br />
is 1000 l/min through two<br />
pumps with automatic detection<br />
and measuring devices and evaluation<br />
to the central PC. The diameter<br />
of issuing pipe is DN100. The<br />
66 ● KOMUNIKÁCIE / COMMUNICATIONS 1/2003
C O M M U N I C A T I O N S<br />
I S<br />
PREHĽADY / REVIEWS<br />
trálne potrubie DN 150. Ovládanie a regulácia je pomocou guľových<br />
servoventilov. Pohon servoventilov je pneumatický, kompresor<br />
je v <strong>na</strong>dstavbe v priestore ČOV.<br />
Technológia plnenia a výdaja olejov, malovýdaj <strong>na</strong>fty<br />
a benzínu pre malé plavidlá<br />
Oleje troch druhov (2 motorové a 1 hydraulický) sú vydávené<br />
z troch stojanov hadicami <strong>na</strong> bubnoch. Stojany s čerpacou technikou<br />
sú umiestnené v rozsahu r. č. 35 – 40 priamo <strong>na</strong>d tankami<br />
olejov O1 až O3. Prívod z brehu potrubím DN 80.<br />
Malovýdaj <strong>na</strong>fty a benzínu pre malé plavidlá je umiestnený <strong>na</strong><br />
korme dvojhadicovým stojanom cez dva bubny, prietok 40 l/min.<br />
filling pipe from the bank or tankers has DN 150 central pipe. The<br />
control and regulations are performed by servo ball-valves with<br />
pneumatic driving. The compressor is located under superstructure<br />
in sewage plants compartment.<br />
Technology of lubrication oils and filling and issuing, diesel<br />
and petrol issuing for smal craft<br />
Lubrication oils of three kinds (2 engine and 1 hydraulic) are<br />
issued from three oil pumps with hoses on drums. The oil issue<br />
station is located in range fr.No. 35 – 40 over oil tanks O1 – O3.<br />
The pipes connections from the bank have DN 80.<br />
The small diesel and petrol issuing for small craft is located<br />
on aft with two hoses pumps and drums, capacity of 40 l/min.<br />
Obr. 9 Dispozícia vyviazania termi<strong>na</strong>lu v prevádzke (prístav Bratislava)<br />
Fig. 9 Termi<strong>na</strong>l mooring arrangement in operation (Bratislava port)<br />
Technológia zberu tekutých a pevných odpadov<br />
Zahŕňa zber tekutých odpadov (drenážne vody, opotrebované<br />
oleje, odlúčené oleje, fekálie) a pevné odpady. Drenážne vody sú<br />
z lodí stáčané do tanku drenážnych vôd a odtiaľ vedené do odlučovača<br />
ropných látok AS-TOP 3 S1. Výkonnosť cca do 3 l/s záruka<br />
koncentrácie pod 5 mg/l s AS-Fibroilom do až do 1 mg/l. Vyčistená<br />
voda pôjde za bort do rieky a odlúčené oleje do tanku odlúčených<br />
olejov 5 m 3 . Príkon s čerpadlami cca 1,0 kW.<br />
Fekálie sú odoberané do dvoch vzájomne prepojených fekálnych<br />
tankov 230 m 3 . Z pravého fekálneho tanku sú vedené do<br />
biologickej čističky odpadových vôd splaškového charakteru AS-<br />
-ANACOMB 50s výkonnosťou 8 m 3 /deň. Na výstupe sú garantované<br />
<strong>na</strong>sledovné parametre vyčistenej vody: BSK5 do 20 mg/l,<br />
CHSK do 80 mg/l, NL do 20 mg/l, N-NH4 do 15 mg/l. V takom<br />
stave je vodu možné viesť za bort (Nar. vlády 242/1993 Zb. z).<br />
Príkon aj s čerpadlami je cca 1,2 kW. Obe čističky sú v uzavretom<br />
priestore <strong>na</strong>dstavby, polozapustené do hlavnej paluby.<br />
Technology of liquid and solid wastes collection<br />
The system contents collection of liquid wastes (bilge waters,<br />
used oils, separated oils and black&gray waters) and collection of<br />
solid wastes. Bilge waters are collected to the bilge waters tank<br />
and from there they are led to the sewage plant – oils separator AS-<br />
TOP 3 S1. The separator cleaning capacity is 3 l/s approx. and concentration<br />
is maximum 5 mg/l and with AS-Fibroil is max. 1 mg/l.<br />
Cleaned water is led overboard and separated oils are led to 5 m 3<br />
separated oils tank. Electricity consumption is 1.0 kW approximately.<br />
Black&gray waters from ships are collected in two sewage tanks<br />
230 m 3 . From the starboard tank they are led to a biology sewage<br />
plant AS-ANACOMB 50s with a maximal capacity of 8 m 3 per day.<br />
Cleaned water at the output guarantees the following parameters:<br />
BSK5 to 20 mg/l, CHSK to 80 mg/l, NL to 20 mg/l, N-NH4 to<br />
15 mg/l. Water can be led overboard (Gov. decree 242/1993 Zbor.z.).<br />
Electricity consumption is 1.2 kW approx. Both sewage plants are<br />
KOMUNIKÁCIE / COMMUNICATIONS 1/2003 ●<br />
67
C O M M U N I C A T I O N S<br />
I S<br />
PREHĽADY / REVIEWS<br />
Projekt, dodávka a montáž čistiacich staníc sú predmetom firmy<br />
ASIO-SK, s. r. o. Bytča. Odvoz zvyškov a opotrebovanej biomasy<br />
sa predpokladá cca raz za mesiac.<br />
Pevné odpady sú ukladané do kontajnerov (KUKA – kontajnery)<br />
v prístrešku <strong>na</strong> čele čl<strong>na</strong>. Navrhnuté bolo triedenie pevných<br />
odpadov (kapacita cca 6 kontajnerov) a odvoz podľa potreby.<br />
Meracia a registračná časť tankov<br />
Obsahuje kontinuálne meranie hladín, max. stavu 97 % s havarijnou<br />
sig<strong>na</strong>lizáciou a odpojením čerpania, teploty náplní tankov,<br />
systém centrálneho riadenia výdaja a stáčania, systém GSM dátovej<br />
prípojky pre platobné karty, fakturáciu a diaľkový prenos údajov<br />
obslužnej polohy PMO pre centrálne riadenie. Obsluha je sústredená<br />
do klimatizovaného velí<strong>na</strong> v kormovej časti lode s dobrým<br />
výhľadom <strong>na</strong> celú palubu.<br />
Protipožiar<strong>na</strong> sústava plavidla<br />
Základom je centrál<strong>na</strong> protipožiar<strong>na</strong> magistrála DN 50 po<br />
celej dĺžke plavidla s hadicovými rýchlospojkami, <strong>na</strong>pojená <strong>na</strong><br />
vodovodné potrubie. Na palube sú umiestnené dva požiarne hydranty<br />
PH 52(C) s hadicami 20 m, ďalej to je 6 ks penových prístrojov<br />
9l,3 protipožiarne súpravy a 3 debny s pieskom a požiarnymi<br />
plachtami.<br />
in the closed insulated compartment of the superstructure, half-sank<br />
to the main deck.<br />
The project, delivering and mounting of sewage plants were<br />
performed by ASIO-SK, s.r.o. Bytča. The pick-up of rests of<br />
biomass is approximately once a month.<br />
Solid wastes are collected in KUKA containers in a porch on<br />
the fore. The sorting of solid wastes and their removal was designed<br />
by requirement.<br />
Measuring and recording systems of tanks<br />
This system includes: continual gauge of the tanks volumes,<br />
97% levels gauge with disconnecting of the pumping, emergency<br />
sig<strong>na</strong>lization, devices for measuring temperature of tanks contents,<br />
system for central controlling of issuing and filling, system for<br />
GSM data connection, invoicing and remote data transfer between<br />
supply vessel and port head office. The operation is concentrated<br />
on the air-conditioned central control station with good outlook<br />
over deck.<br />
Firefighting system of the vessel<br />
The base is a central firefighting magistral DN 50 on all length<br />
of the deck with hoses connections, pipe is connected with water<br />
system. There are two firefighting hydrants PH 52(C) with 20 m<br />
hoses, 6 pcs 9 l individual foam extinguisher, 3 firefighting sets<br />
and 3 sand boxes with fire sheets on the deck.<br />
6. Pontón pre malé plavidlá<br />
Výdaj pohonných látok benzínu a <strong>na</strong>fty pre malé plavidlá<br />
umožňuje malý pontón výkyvne a výškove posuvne uchytený <strong>na</strong><br />
zrkadle hlavného plavidla. Uchytenie riešia 4 kladky vedené v HEB<br />
profiloch. Tým je zabezpečená zhruba konštantná výška voľného<br />
boku cca 600 mm pre možnosť pristávania malých plavidiel cca<br />
do dĺžky 12 m. Podlaha je po celej ploche vytvorená pororoštami,<br />
prístup umožňuje zavesená lávka. Dvojhadicový stojan pre <strong>na</strong>ftu/<br />
benzín je umiestnený <strong>na</strong> hlavnom<br />
plavidle. Zemnenie je vyvedené <strong>na</strong><br />
hlavný čln.<br />
6. Pontoon for small craft<br />
The small pontoon connected to main vessel transom e<strong>na</strong>bles<br />
the filling of small craft with diesel and petrol fuel. Hinge and<br />
sliding connection is performed by four pulleys led in HEB profiles.<br />
This solution ensures approximately constant 600 mm freeboard of<br />
pontoons for mooring of small craft to 12 m length approximately.<br />
The deck is made from poro-rostes. The access to pontoon e<strong>na</strong>bles<br />
the footbridge hanged on the main vessel. The pump with two<br />
hoses (diesel and petrol) is located<br />
on the main vessel, the grounding<br />
is led to the main barge.<br />
7. Záver<br />
7. Conlusions<br />
Projekty a stavba plávajúceho<br />
termi<strong>na</strong>lu sú spoločným dielom<br />
viacerých firiem, ktoré spoločne<br />
koordinovali pri vývoji tohto plavidla.<br />
Komplexné riešenie a lodná<br />
časť boli vyvinuté a vyprojektované<br />
<strong>na</strong> Katedre automobilov, lodí<br />
a motorov SjF STU, Bratislava.<br />
Kooperáciu výrobných a technologických<br />
častí zabezpečoval IDOPS,<br />
družstvo Bratislava. Projekty technologických<br />
častí plnenia, výdaja<br />
Obr. 10 Vyväzovací pontón pre malé plavidlá (cca do 12 m)<br />
Fig. 10 Mooring pontoon for small crafts (to 12 m approx.)<br />
The projects and building of<br />
the floating termi<strong>na</strong>l is a common<br />
result of some coordi<strong>na</strong>ting companies.<br />
The complex project and<br />
construction were developed at the<br />
Department of cars, ships and<br />
engines of the Faculty of Mechanical<br />
Engineering in Bratislava. The<br />
cooperation of production and<br />
technology parts was performed<br />
by IDOPS, Bratislava. The projects<br />
and documentations of technol-<br />
68 ● KOMUNIKÁCIE / COMMUNICATIONS 1/2003
C O M M U N I C A T I O N S<br />
I S<br />
PREHĽADY / REVIEWS<br />
a elektro sú dielom firmy EX-<br />
PRO, Šaľa. Tankovacie rameno<br />
dodala firma EMCO WHEA-<br />
TON, Germany, obe čističky sú<br />
dodávkou firmy ASIO-SK,<br />
Bytča.<br />
Stavbu realizovala firma<br />
H.A.W.K., Pezinok-Bratislava,<br />
ktorá má dobré skúsenosti so<br />
stavbou a rekonštrukciou tankových<br />
plavidiel. Investorom<br />
celej akcie a zadávateľom technických<br />
podmienok bola Divízia<br />
Prístav, Slovenská plavba<br />
a prístavy, a. s. Bratislava, kde je<br />
aj termi<strong>na</strong>l umiestnený. Dodávateľmi<br />
jednotlivých komponentov ako čerpacia technika, armatúry,<br />
snímacie a regulačné prístroje a i. je celý rad ďalších firiem.<br />
Stavba začala v 10/1999 a v súčasnosti má už za sebou jeden rok<br />
prevádzky.<br />
Obr. 11 Čerpacia poloha malých plavidiel<br />
Fig. 11. Pumping position for small crafts,<br />
ogy parts (filling, issuing, measurements,<br />
electro) were performed by<br />
EXPRO in Šaľa. The marine fuel<br />
loader was delivered by the company.<br />
EMCO WHEATON, Germany. Both<br />
sewage plants are products of the<br />
company ASIO-SK in Bytča.<br />
The building is realised by<br />
H.A.W.K in Pezinok-Bratislava, the<br />
company with good experience with<br />
building and reconstruction of tank<br />
vessels. The order and technical conditions<br />
were submited by investment<br />
company – Port Division of Slovak<br />
Navigation and Ports in Bratislava.<br />
The supply vessel is located in Port<br />
Bratislava. Other Slovak companies delivered pumps technology,<br />
fittings, detectors control devices and other components. The<br />
building of vessel started 10/1999 and the vessel has been in operation<br />
for a year.<br />
Plavidlo sa takto, okrem poskytovateľa komerčných a zásobovacích<br />
služieb, stalo aj výz<strong>na</strong>mným prínosom pre ochranu životného<br />
prostredia a vôd v rajóne rieky Du<strong>na</strong>j. Samozrejme, že po<br />
doriešení územných ko<strong>na</strong>ní nie je problém premiestniť ho a prevádzkovať<br />
aj v inej lokalite.<br />
The termi<strong>na</strong>l as a significant provider of commercial and supply<br />
services is a significant benefit for environmental and water protection<br />
in the large Danube river area. The suplly vessel may be<br />
located in any place on the river after the solution of the territorial<br />
process.<br />
Literatúra – References<br />
[1] Rules for classification and building of inland ships (Pravidla pro klasifikaci a stavbu lodí vnitrozemské plavby), Československý<br />
lodní register, č. II. Lodní teleso, část VII. Soustavy a potrubí, č. V. Požární ochra<strong>na</strong>, ČSLR Praha, 1984-1985. (in Czech)<br />
[2] Klasifikation -und Bauvorschriften Schiffstechnik, Teil 2 Binnenschiffe, Hamburg 1990, Version CD from 1997.<br />
[3] Economic Commission for Europe, Inland Transport Committee: Inter<strong>na</strong>tio<strong>na</strong>l Carriage of Dangerous Goods by Inland Waterway<br />
(ADN) UN New York & Geneva 1997.<br />
[4] PATEK, P., BORSKÝ, J.: Service position PMO (Obslužná poloha PMO, Reconstruction of DEIIb barge, Project of Ship Part, KSL VS-<br />
100, HZ 73/99, SjF STU Bratislava, Febr. 2000. (in Slovak)<br />
KOMUNIKÁCIE / COMMUNICATIONS 1/2003 ●<br />
69
C O M M U N I C A T I O N S<br />
I S<br />
PREHĽADY / REVIEWS<br />
Blahoslav Harman – Viktor Ferencey *<br />
VYUŽITIE PSEUDO-STOCHASTICKÉHO MODELU TERÉNU PRE<br />
SIMULÁCIU VIBRÁCIÍ A OTRASOV CESTNÝCH DOPRAVNÝCH<br />
PROSTRIEDKOV<br />
UTILIZATION OF A PSEUDO-STOCHASTIC MODEL OF TERRAIN IN SIMULATION<br />
OF VIBRATIONS AND SNUBBING IN ROAD MEANS OF TRANSPORT<br />
Physical and geometrical properties of environment lead to mathematical<br />
models of terrain – vehicle relationship. The basic idea of<br />
the presented approach is to construct a two – dimensio<strong>na</strong>l funnction,<br />
whose three – dimensio<strong>na</strong>l graph has properties similar to the terrain<br />
to be modeled. The idea of the paper is expected to be used in simulation<br />
of phenome<strong>na</strong> connectedwith impacts of vibrations and snubbing<br />
to humans as well as on technological factors.<br />
Keywords: Pseudo-stochastic model, terrain, mathematical models,<br />
two-dimensio<strong>na</strong>l function, three dimensio<strong>na</strong>l graph, single components,<br />
model function, linear combi<strong>na</strong>tion, experimental verification.<br />
Physical and geometrical properties of environment lead to mathematical<br />
models of terrain- vehicle interaction. The basic idea of the<br />
presented approach is to construct a two – dimensio<strong>na</strong>l function whose<br />
three-dimensio<strong>na</strong>l graph has properties similar to the terrain to be<br />
modeled. The idea of the paper is expected to be used in simulation<br />
of phenome<strong>na</strong> connected with impacts of vibrations and snubbing to<br />
humans as well as on technological factors.<br />
Keywords: Pseudo-stochastic model, terrain, mathematical models,<br />
two-dimensio<strong>na</strong>l function, three dimensio<strong>na</strong>l graph, single components,<br />
model function, linear combi<strong>na</strong>tion, experimental verification.<br />
1. Úvod<br />
Cestujúci v dopravných prostriedkoch sú vystavovaní vibráciám<br />
a otrasom, ktoré rôznym spôsobom môžu ovplyvňovať ich<br />
zdravotný stav. Záleží pri tom <strong>na</strong> spôsobe prenosu vibrácií <strong>na</strong><br />
ľudský organizmus a <strong>na</strong> fyzikálnych vlastnostiach vibrácií. Pôsobením<br />
vibrácií <strong>na</strong> vodiča dochádza uňho k ú<strong>na</strong>ve, ktorá ovplyvňuje<br />
jeho výkon a reakčné schopnosti, čo zvyšuje taktiež nebezpečie<br />
vzniku dopravných nehôd. Pre zmenšenie účinkov vibrácií dopravnej<br />
techniky <strong>na</strong> človeka a zároveň <strong>na</strong> spätné <strong>na</strong>máhanie vozovky<br />
je potrebné a<strong>na</strong>lyzovať dy<strong>na</strong>mické sily medzi kolesami vozidla<br />
a povrchom vozovky resp. terénu.<br />
Väčši<strong>na</strong> mechanických konštrukcií a v ich rámci i motorové<br />
vozidlá sú v prevádzke vystavené dy<strong>na</strong>mickým účinkom, ktoré sú<br />
spôsobené predovšetkým nerovnosťami povrchu vozovky resp.<br />
nerovnosťami povrchu terénu. A<strong>na</strong>lýza uvedených dy<strong>na</strong>mických<br />
účinkov má svoje vážne opodstatnenie, pretože výz<strong>na</strong>mne ovplyvňujú<br />
<strong>na</strong>jdôležitejšie prevádzkové a konštrukčné vlastnosti motorových<br />
vozidiel. Pretože ku kmitaniu dochádza predovšetkým vplyvom<br />
nerovností vozovky, resp. terénu, musíme v prvom rade matematicky<br />
popísať tieto nerovnosti [1].<br />
Do súboru kvantitatívnych vyjadrení <strong>na</strong>jvýz<strong>na</strong>mnejších faktorov<br />
prevádzky motorových vozidiel patrí matematický model profilu<br />
terénu. Vzhľadom <strong>na</strong> to, že sa automobil pohybuje po nerovnos-<br />
1. Introduction<br />
Passengers in road means of transport are exposed to vibrations<br />
and snubbing, which can affect their health conditions in<br />
various ways. The process of affection depends on a transmission<br />
mode of vibrations to the human organism and on their physical<br />
properties. Due to the effect of vibrations the driver is faced to<br />
fatigue which is followed by his performance of driving skill and<br />
reaction abilities. As a consequence a risk of road accident is<br />
increased. In order to depress the road transport means vibration<br />
effects to the human as well as to the to the road endurance, it is<br />
necessary to a<strong>na</strong>lyze the dy<strong>na</strong>mic forces between vehicle wheels<br />
and a roadway surface or terrain.<br />
The most of mechanical constructions are exposed to dy<strong>na</strong>mical<br />
impacts during a process of their running. In case of motorcars<br />
those impacts are caused by roadway or terrain undulations. The<br />
above-mentioned dy<strong>na</strong>mical effects essentially affect the most important<br />
operating and construction properties of road means of transport;<br />
hence an a<strong>na</strong>lysis of them is well founded. Because sources<br />
of vibrations are mainly the roadway or terrain undulations, it is<br />
necessary, first of all, to describe them mathematically [1].<br />
A mathematical model of a shape of terrain belongs to the basic<br />
set of theoretical tools connected to the study of motorcars operation.<br />
As the vehicle is moving on the roadway or terrain having<br />
* Blahoslav Harman, Viktor Ferencey<br />
Department of Mathematics, Department of Automobiles, Ships and Inter<strong>na</strong>l Combustion Engines, Faculty of Mechanical Engineering,<br />
Slovak University of Technology, Bratislava, E-mail: harman@sjf.stuba.sk, ferencey@sjf.stuba.sk<br />
70 ● KOMUNIKÁCIE / COMMUNICATIONS 1/2003
C O M M U N I C A T I O N S<br />
I S<br />
PREHĽADY / REVIEWS<br />
tiach, ktoré majú náhodný charakter, je potrebné aplikovať stochastické<br />
prístupy k určovaniu profilu povrchu vozovky prípadne<br />
terénu. V príspevku je dokumentovaný postup vytvorenia pseudostochastického<br />
modelu profilu terénu, ktorý je využiteľný pre operatívnu<br />
simuláciu interakcie vozidla s povrchom vozovky, resp.<br />
terénu.<br />
Priebeh terénu medzi tromi uzlovými bodmi každého čiastkového<br />
úseku je <strong>na</strong>hradzovaný kružnicou, ktorá prechádza všetkými<br />
uzlovými bodmi. Po vypočítaní súradníc ľubovoľného bodu kružnice<br />
je potrebné matematicky určiť, ktorá časť kružnice bude využiteľná.<br />
V prípade členitého terénu dochádza k veľkým rozdielom<br />
medzi skutočným a <strong>na</strong>hradeným profilom terénu v oblastiach<br />
náhlych zmien skutočného profilu. Tento nedostatok sa dá zmierniť<br />
vhodnou voľbou uzlových bodov. Interpolačnou krivkou môže<br />
byť kvadratická parabola. Pri použití paraboly vo všeobecnej polohe<br />
by bolo potrebné vyko<strong>na</strong>ť transformáciu súradnic pre každú pararandom<br />
characteristics, it is necessary to apply stochastic-oriented<br />
approaches and methods. The aim of the paper is to present one<br />
of the possible approaches of pseudo-stochastic model of terrain.<br />
It can be used in process of vehicle-terrain or vehicle-roadway<br />
interaction simulation.<br />
2. Súčasné prístupy k matematickému popisu<br />
profilu terénu<br />
V súčasnosti existuje niekoľko metód pre vytvorenie matematického<br />
modelu jazdnej dráhy pre motorové vozidlá [3]. Jednou<br />
z často preferovaných metód je zjednodušená metóda popisu terénu<br />
v smere jazdy vozidla a vo zvislej rovine. Zjednodušenie popisu<br />
profilu terénu spočíva v predpoklade, že pri prekonávaní nerovností<br />
plošného a dĺžkového charakteru je ich profil v priečnom<br />
smere rov<strong>na</strong>ký a bez markantných zmien. Pre popis profilu terénu<br />
sa používa určité „vyhladenie terénu“, ktoré spočíva v:<br />
● Popise profilu pomocou uzlových bodov so súradnicami (x i , y i ).<br />
● Nahradení profilu terénu medzi uzlovými bodmi buď interpolačnou<br />
funkciou prechádzajúcou uzlovými bodmi, alebo aproximačnou<br />
funkciou, získanou z uzlových bodov. Takto získaný<br />
matematický popis profilu terénu je ukázaný <strong>na</strong> obrázku 2.1.<br />
2.1. Nahradenie profilu<br />
terénu lineárnou<br />
interpoláciou<br />
2. Contemporary approaches in mathematical<br />
description of profile of terrain<br />
In the present time there exist several methods of setting up<br />
a mathematical model of motor-car roads [3]. One of them, quite<br />
often used, is a simplified method of terrain description in which<br />
a vehicle is moved in a vertical plane belonging to the trajectory<br />
of movement. This construction is based on an assumption that<br />
transverse balances caused by vehicle movement, connected to the<br />
undulations overrunning, are constant and without notable variations.<br />
Moreover, the profile of terrain is ‘smoothed’. The <strong>na</strong>ture of<br />
this smoothing lies in:<br />
● Description of terrain using nodal points having coordi<strong>na</strong>tes<br />
(x i , y i ).<br />
● The real terrain behavior between each two neighbor nodal<br />
points is replaced by an interpolation function identical with<br />
terrain in nodal points, or profile of terrain is replaced by an<br />
approximation function driven from the<br />
nodal points. The above-mentioned<br />
mathematical description of terrain<br />
profile is shown in figure 2.1.<br />
Profil terénu sa delí <strong>na</strong><br />
čiastkové úseky tak, aby v každom<br />
boli dva uzlové body,<br />
jeden <strong>na</strong> začiatku a druhý <strong>na</strong><br />
konci úseku. Priebeh terénu<br />
medzi uzlovými bodmi je <strong>na</strong>hradený<br />
úsečkou, ktorá uzlové<br />
body spája. Pri vhodne zvolených<br />
vzdialenostiach medzi uzlovými bodmi vzhľadom <strong>na</strong> skutočný<br />
profil terénu je možné dosiahnuť minimálne rozdiely medzi<br />
skutočným a vypočítaným profilom.<br />
Obr. 2.1 Matematický popis profilu terénu<br />
Fig. 2.1 Mathematical description of terrain profile<br />
2.1. Replacement a terrain profile<br />
using linear interpolation<br />
A profile of terrain is divided into<br />
partial segments, each of them contains<br />
two nodal points. The real course of<br />
terrain is replaced by abscissa connecting<br />
the neighbor nodal points. If the distances<br />
between the nodal points are appropriately chosen, then it<br />
is possible to obtain a sufficiently small difference between a real<br />
and a modeled terrain behavior.<br />
2.2. Nahradenie profilu terénu kvadratickou<br />
interpoláciou<br />
2.2. Replacement a terrain profile using quadratic<br />
interpolation<br />
A profile of terrain is divided into partial segments, each of<br />
them contains three nodal points. A real course that corresponds<br />
to three neighbor nodal points is replaced by a circle going through<br />
them. In case of very rangy terrain a large difference between reality<br />
and its interpolation is obtained. The situation in areas of abrupt<br />
terrain changes is especially unfavorable. This drawback is possible<br />
to reduce by choosing suitable nodal points. Instead of circle a parabolic<br />
interpolation can be used. From a general point of view, such<br />
interpolation depends on the coordi<strong>na</strong>te system. Use of parabolas<br />
whose axes are, e.g. parallel to the axis x, (the meaning of the axes<br />
KOMUNIKÁCIE / COMMUNICATIONS 1/2003 ●<br />
71
C O M M U N I C A T I O N S<br />
I S<br />
PREHĽADY / REVIEWS<br />
bolu. Pri použití paraboly s osou rovnobežnou s osou „x“ súradného<br />
systému dochádza k z<strong>na</strong>čným rozdielom (odchylkám) oproti profilu<br />
skutočného terénu. Z tohto dôvodu sa používa ako interpolačná<br />
krivka parabola s osou rovnobežnou s osou „y“ súradného systému.<br />
Interpolácia profilu terénu pomocou ostatných kužeľosečiek, t. j.<br />
elipsou, prípadne hyperbolou sa ukázala ako nevhodná. Dôvodom<br />
je skutočnosť, že pre <strong>na</strong>hradenie skutočného profilu terénu elipsou<br />
alebo hyperbolou je potrebné uvažovať minimálne so 4 uzlovými<br />
bodmi terénu. Tieto body však nemusia vždy vyhovovať rovnici<br />
elipsy či hyperboly. Praktické skúsenosti potvrdzujú, že <strong>na</strong>hradenie<br />
profilu terénu pomocou kružníc je <strong>na</strong>jmenej vhodné. Interpolácia<br />
parabolami je vhodná pre úseky s pravidelne sa opakujúcim<br />
profilom.<br />
x and y is the same as in fig. 2.1.) the result is not sufficiently satisfying.<br />
The approach in which the parabolas, whose axes are parallel<br />
to the axis y gives better results. The interpolation based on<br />
the use of other quadratic curves (ellipse or hyperbola) has shown<br />
to be unsuitable. The main reason for this statement is the fact<br />
that we should work with four neighbor nodal points which correspond<br />
to one segment. The chosen one requires to satisfy a relatively<br />
complicated condition – there exists a quadratic curve passing<br />
through them. With respect to practical experience it is possible<br />
to say that even an interpolation based on the use of circles is not<br />
an acceptable one. Concerning the parabolas, the method is relatively<br />
acceptable when a part of the terrain profile is regularly<br />
repeated.<br />
2.3. Nahradenie profilu terénu Lagrangeovym<br />
a Newtonovým polynómom<br />
2.3. Replacement a terrain profile using Lagrange<br />
and Newtonian polynomial<br />
Profil terénu sa rozdelí <strong>na</strong> čiastkové úseky tak, aby v každom<br />
bolo „n2“ uzlových bodov, kde „n“ je použitý stupeň polynómu.<br />
Profil terénu medzi uzlovými bodmi v čiastkovom úseku je <strong>na</strong>hradený<br />
Lagrangeovým polynómom stupňa „n“, ktorý v uzlových<br />
bodoch <strong>na</strong>dobúda zadané hodnoty. Medze úseku sa volia mimo<br />
prvý a posledný uzlový bod preto, aby bola zabezpečená <strong>na</strong>dväznosť<br />
vypočítaného profilu čiastkových úsekov. Lagrangeov polynóm má<br />
tvar:<br />
P n (X) n<br />
Y k B k (X) , (2.1)<br />
kde:<br />
k0<br />
Okrem Lagrangeovho polynómu sa <strong>na</strong>hradzuje profil terénu<br />
Newtonovým polynómom. Počet uzlových bodov sa volí „n2“ pre<br />
každý čiastkový úsek profilu. Pritom prvý bod, ktorým býva prekladaný<br />
interpolačný polynóm leží <strong>na</strong> začiatku úseku, „n2“ bod<br />
leží <strong>na</strong> konci úseku.<br />
Polynóm je prekladaný „n“ bodmi a „n“ je súčasne stupeň polynómu.<br />
Newtonov polynóm pre interpoláciu v čiastkových úsekoch<br />
s ekvidištančnými hodnotami má tvar:<br />
Terrain profile is divided into segments, each of them contains<br />
n2 nodal points. Integer number n is a degree of a polynomial<br />
to be used. A behavior of terrain on each single segment is replaced<br />
by Lagrange polynomial passing through corresponding nodal<br />
points. In order to assure the join between neighbor segments, the<br />
borders of each segment are chosen out of a first and last nodal<br />
point. The form of a Lagrange polynomial is the following:<br />
where:<br />
P n (X) n<br />
k0<br />
Y k B k (X) , (2.1)<br />
(X X 0 )(X X 1 ) … (X X k1 )(X X k1 ) … (X X n )<br />
B k (X) <br />
(2.2)<br />
(X k X 0 )(X k X 1 ) … (X k X k1 )(X k X k1 ) … (X k X n )<br />
2<br />
Besides the Lagrange polynomial replacement of profile of<br />
terrain, the replacement using Newtonian polynomial of the n-th<br />
degree is used. For each segment n2 equidistantly spread nodal<br />
points are used. The first nodal point is placed at the beginning of<br />
a segment and an (n2)-th one at the end of segment. The form of<br />
Newtonian interpolation polynomial for equidistant values in each<br />
single segment is as follows:<br />
S n (X) Y 1 y 1<br />
(X X<br />
h 1 ) y1<br />
<br />
2<br />
(X X<br />
2h<br />
1 )(X X 2 ) … y1<br />
<br />
n<br />
(X X<br />
n!h<br />
1 )(X X 2 ) … (X X n1 ) , (2.3)<br />
n<br />
kde k y 1 je možné všeobecne definovať diferencie vzťahom:<br />
k k k<br />
y 1 Y k Y k1 Y k2 … (1) k Y 1 (2.4)<br />
1 2<br />
v ktorom:<br />
k<br />
k!<br />
. (2.5)<br />
i i!(k i)!<br />
Interpolácie Lagrangeovým polynómom a Newtonovým polynómom<br />
sa úspešne používajú pre úseky terénu s plynulými zme<strong>na</strong>mi.<br />
Taktiež je úspešné ich použitie v úsekoch s pravidelne sa opakujúcim<br />
profilom. Ale pre úseky s náhlymi zme<strong>na</strong>mi ako <strong>na</strong>pr. zlomy<br />
where k y 1 difference is possible to define the used general formula<br />
k k k<br />
y 1 Y k Y k1 Y k2 … (1) k Y 1 (2.4)<br />
1 2<br />
in which<br />
k<br />
k!<br />
. (2.5)<br />
i i!(k i)!<br />
The expressions i!, k! represent combi<strong>na</strong>torial numbers.<br />
Interpolations realized by means of Lagrange and Newtonian<br />
interpolations are successfully applicable especially in situations<br />
when terrain waves are smoothly changing or when a shape of<br />
72 ● KOMUNIKÁCIE / COMMUNICATIONS 1/2003
C O M M U N I C A T I O N S<br />
I S<br />
PREHĽADY / REVIEWS<br />
a pod., nie je vhodné aplikovať interpolácie<br />
Lagrangeovým resp. Newtonovým<br />
polynómami. Interpolácia<br />
Newtonovým polynómom sa i cez<br />
požadované ekvidištantné rozloženie<br />
uzlových bodov ukazuje ako jed<strong>na</strong><br />
z <strong>na</strong>jčastejšie používaných metód<br />
interpolácie profilu terénu.<br />
Obr. 2.2 Interpolácia Newtonovým polynómom<br />
Fig. 2.2 Interpolation by Newton polynomial<br />
terrain segments is periodically<br />
repeated. The use of the above<br />
mentioned methods is not suitable<br />
in case of terrain having abrupt<br />
changes, breaks, etc. For all that,<br />
they are ones of the most often<br />
methods used in an a<strong>na</strong>lysis based<br />
on a terrain interpolation.<br />
2.4. Nahradenie profilu terénu nelineárnou<br />
aproximáciou<br />
Východiskovými údajmi pre výpočet sú zadané súradnice uzlových<br />
bodov profilu terénu. Úsek terénu je rozdelený <strong>na</strong> čiastkové<br />
úseky tak, aby v každom bolo „n2“ uzlových bodov, kde „n“ je<br />
počet uzlových bodov pre výpočet aproximačnej funkcie. Profil<br />
terénu medzi uzlovými bodmi je <strong>na</strong>hradený aproximačnou funkciou<br />
tak, aby súčet štvorcov odchýlok od uzlových bodov bol minimálny.<br />
Ako aproximujúca funkcia sa používa algebraický polynom<br />
„r-tého“ stupňa v tvare [2]:<br />
P r (x) a 0 a 1 x 1 … a r x r . (2.6)<br />
Koeficienty a 0 , a 1 , … a r sa vypočítavajú obvyklým spôsobom<br />
zo sústavy rovníc. Medze úsekov sú volené mimo prvý a posledný<br />
preto, aby bola zabezpečená <strong>na</strong>dväznosť vypočítaného profilu čiastkových<br />
úsekov. Pri nelineárnej aproximácii metódou <strong>na</strong>jmenších<br />
štvorcov rozptyl a priemerná odchylka bývajú pomerne malé.<br />
Z tohto je zrejmé, že i keď je zachovaný celkový charakter terénu,<br />
tento spôsob aproximácie dáva taktiež iba približné hodnoty.<br />
3. Pseudostochastický model terénu<br />
Ďalší možný prístup je založený <strong>na</strong> a<strong>na</strong>lyticky definovanej<br />
funkcii. Základnou myšlienkou je konštrukcia takej funkcie dvoch<br />
premenných z f(x, y), ktorej graf má vlastnosti podobné vlastnostiam<br />
modelovaného terénu. Takáto funkcia môže byť vytvorená<br />
ako lineár<strong>na</strong> kombinácia (superpozícia) „štrukturálnych“ zložiek,<br />
ktoré reprezentujú jednotlivé druhy členitosti terénu (terénne vlny,<br />
nerovnosti vozovky, drsnosť povrchu s ktorým je vozidlo v kontakte<br />
a pod.). Kvantitatívnou mierou váhy jednotlivých zložiek sú<br />
hodnoty koeficientov tejto lineárnej kombinácie. Z charakteru<br />
modelu je zrejmé, že stačí uvažovať len lineárne kombinácie s kladnými<br />
koeficientmi. Modelová funkcia f(x, y) má teda tvar<br />
f(x, y) N<br />
a k f k (x, y). (3.1)<br />
k1<br />
Ak tvar grafu tejto funkcie má zodpovedať modelu reálnej situácie,<br />
potom je zrejmé, že jednotlivé štrukturálne zložky musia mať<br />
diametrálne odlišné dvojrozmerné spektrá a hodnoty k nim zodpovedajúcich<br />
koeficientov lineárnej kombinácie budú taktiež rádovo<br />
odlišné. Kvôli prehľadnosti je vhodné postupnosť funkcií f 1 (x, y),<br />
f 2 (x, y), …, f N (x, y) voliť od nižších (pomaly sa meniace funkcie –<br />
<strong>na</strong>pr. terénne vlny) spektier k vyšším. Je zrejmé, že v takomto prípade<br />
budú koeficienty a 0 , a 1 , … a n tvoriť rýchlo klesajúcu postupnosť.<br />
2.4. Replacement a terrain profile using nonlinear<br />
approximation<br />
The input data used in a<strong>na</strong>lysis are coordi<strong>na</strong>tes of the terrain<br />
nodal points. The whole range of terrain is divided into partial<br />
segments, each of them contains (n2) nodal points. An approximation<br />
function is driven from n points using the root mean square<br />
method. It is chosen among the class of r-degree (rn) polynomials<br />
[2]. Such polynomial can be expressed in a form<br />
P r (x) a 0 a 1 x 1 … a r x r (2.6)<br />
The coefficients a 0 , a 1 , … a r are computed in a usual way<br />
based on a solution the system of linear algebraic equations. A<strong>na</strong>logously<br />
to the preceding case, in order to assure the join between<br />
the neighbor segments, the borders of each segment are chosen<br />
out of a first and last nodal point.<br />
3. Pseudo-stochastic model of terrain<br />
Further possible approach is based on the a<strong>na</strong>lytically defined<br />
function. The basic idea is to construct a two-dimensio<strong>na</strong>l function<br />
z f(x, y), whose three dimensio<strong>na</strong>l graph has properties similar<br />
to the terrain to be modeled. Such a function can be created in the<br />
form of a linear combi<strong>na</strong>tion (superposition) of “structural” components,<br />
which represent single types of ranginess of terrain (terrain<br />
waves, undulation of the pavement, etc.) The quantitative measure<br />
of importance of single components is proportio<strong>na</strong>l to the values<br />
of coefficients of the above mentioned linear combi<strong>na</strong>tion. Due to<br />
the <strong>na</strong>ture of model, it is easy to see that the positive coefficients<br />
can be assumed. Hence, the model function f(x, y) is of the form<br />
f(x, y) N<br />
k1<br />
a k f k (x, y) (3.1)<br />
As the shape of the graph of this function should correspond<br />
to the model of a real situation it is evident that the two-dimensio<strong>na</strong>l<br />
spectrums of single structural components have to be diametrically<br />
different. Moreover, the corresponding coefficients of<br />
a linear combi<strong>na</strong>tion have to be different in order of magnitude.<br />
For the a<strong>na</strong>lysis to be more transparent, it is suitable to order the<br />
sequence of functions f 1 (x, y), f 2 (x, y), …, f N (x, y) having from<br />
lower (the slowly changing functions – e.g. terrain waves) spectrums<br />
to the higher ones. Evidently, the sequence a 0 , a 1 , … a n of<br />
coefficients will be rapidly decreasing.<br />
KOMUNIKÁCIE / COMMUNICATIONS 1/2003 ●<br />
73
C O M M U N I C A T I O N S<br />
I S<br />
PREHĽADY / REVIEWS<br />
Z matematického hľadiska spomenieme dva spôsoby možnej<br />
konštrukcie modelovej funkcie f(x, y).<br />
V prvom prípade sa definujú jednotlivé zložky f 1 (x, y), f 2 (x, y),<br />
…, f N (x, y) individuálne. Tento prístup je pomerne náročný, pretože<br />
a<strong>na</strong>lýza musí vychádzať z podrobnej z<strong>na</strong>losti globálnej topologickej<br />
štruktúry konkrétneho modelovaného terénu.<br />
Druhý prístup je založený <strong>na</strong> zavedení vhodnej základnej deterministickej<br />
funkcie (x, y) s dostatočne stochastickým chovaním.<br />
Jednotlivé zložky f k (x, y) definujeme v tvare<br />
f k (x, y) ( kx , ky ), pričom 0 1 2 … N ,<br />
0 1 2 … N . (3.2)<br />
Vhodným príkladom je funkcia definovaná <strong>na</strong>sledovne:<br />
From the mathematical point of view let us notion two possible<br />
approaches of the model function f(x, y) construction.<br />
In the first case the single components f 1 (x, y), f 2 (x, y), …,<br />
f N (x, y) are defined individually. This a little bit demanding approach<br />
requires having a detailed information concerning the global topological<br />
structure of the specific modeled terrain.<br />
The second approach is based on assuming the appropriate<br />
fundamental deterministic function (x, y) having sufficiently<br />
pseudo-stochastic behavior. The single components are f k (x, y)<br />
defined in the form<br />
f k (x, y) ( kx , ky ), where 0 1 2 … N ,<br />
0 1 2 … N . (3.2)<br />
The following function is a suitable example:<br />
(x, y) cos(2cos(0.111x)) sin(3cos(0.201y)) 0.5 1 (x, y) 2 (x, y) 0.1( 1 (x, y) 2 (x, y)) (3.3)<br />
kde:<br />
where<br />
1 (x, y) 0.4cos(2sin x 3sin y) 0.5cos(0.5cos(7sin x 3) 0.49sin(3sin(5sin y))) (3.4)<br />
2 (x, y) 1.2sin(5sin x 6sin y cos x sin y) 0.8sin(cos(5sin x cos 3y cos(x y) 4)) 0.1cos(x y)<br />
Pre simuláciu pohybu vozidla má funkcia f(x, y) principiálny<br />
výz<strong>na</strong>m. Za účelom názornej demonštrácie prezentovanej metódy<br />
bol s využitím programovacieho jazyka Borland Pascal 7 spracovaný<br />
experimentálny program TERPOH4 pri použití <strong>na</strong>sledovných<br />
rámcových geometrických a technických parametrov:<br />
– Uvažované vozidlo je trojnápravové s dvoma skĺbenými nezávislými<br />
ploši<strong>na</strong>mi.<br />
– Rovi<strong>na</strong> prednej resp. zadnej plošiny je určená strednou hodnotou<br />
okamžitej výšky stredných kolies a jednotlivými výškami<br />
predných resp. zadných kolies.<br />
– Vzdialenosť medzi strednou a prednou nápravou je zhodná so<br />
vzdialenosťou medzi strednou a zadnou nápravou.<br />
– Šírka a dĺžka vozidla sú voliteľné.<br />
– Vozidlo sa pohybuje v rovine x, y po voliteľnej priamke v rámci<br />
voliteľného rovinného výseku s voliteľným ekvidištančným krokom.<br />
– Modelom terénu je trojrozmerný graf f(x, y) funkcie vytvorený<br />
pomocou vyššie uvedenej ilustračnej funkcie (x, y) s parametrom<br />
N 2 a voliteľnými koeficientmi a 1 , a 2 .<br />
– Program umožňuje získať orientačnú predstavu o tvare modelovaného<br />
terénu znázornením grafu funkcie f(x, y) pomocou<br />
farebne odlíšených vrstevníc s voliteľným krokom.<br />
– Naklonenie jednotlivých plošín je farebne odlíšené a jeho dy<strong>na</strong>miku<br />
je možno priebežne sledovať znázornením koncových<br />
bodov ich jednotkových normálových vektorov so začiatočným<br />
bodom v strede vozidla.<br />
Experimentálne počítačové overenie prezentovanej metódy<br />
ukazuje, že <strong>na</strong> nej založená simulácia pohybu vykazuje dostatočne<br />
stochastické chovanie. Zacyklenie výstupu alebo náz<strong>na</strong>ky periodicity<br />
sa neobjavili ani pri mnohonásobne opakovanej simulácii pri<br />
Importance of the function f(x, y) in vehicle simulation purposes<br />
is the principal one. In order to demonstrate transparently<br />
the described method, a special experimental computer program<br />
in programming language Borland Pascal 7 developed. The following<br />
frame geometric and technical parameters are used:<br />
– A tree-axle vehicle with two independent joint platforms is<br />
assumed.<br />
– The front platform plane is determined by the mean value of<br />
the height of central axle wheels and by the height of the front<br />
axle wheels. The rear platform plane is determined in an a<strong>na</strong>logue<br />
way.<br />
– Distances between central and front axles and central and rear<br />
axles are the same.<br />
– The width and length of vehicle are optio<strong>na</strong>l.<br />
– The vehicle moves in the x, y plane along an optio<strong>na</strong>l straight line,<br />
inside an optio<strong>na</strong>l plane segment. The scanning step is equidistant.<br />
– The model of the terrain is represented by a three-dimensio<strong>na</strong>l<br />
graph of the function f(x, y) generated by means of the above<br />
mentioned illustrative function (x, y) having parameter and<br />
optio<strong>na</strong>l coefficients a 1 , a 2 .<br />
– In order to obtain an orientation vision about the shape of the<br />
modeled terrain, the graph of the function f(x, y)can be imaged.<br />
The color-distinguished contour lines with optio<strong>na</strong>l steps are used.<br />
– The slope of the single platforms is color-distinguished. It is possible<br />
to observe their time dy<strong>na</strong>mics by means of the end points<br />
of the normal vectors. The origi<strong>na</strong>l point of vectors is fixed to<br />
the center of vehicle.<br />
An experimental verification of the presented method demonstrates<br />
that behavior of the corresponding simulation is sufficiently<br />
stochastic. Cycling or periodicity indications did not occur after<br />
74 ● KOMUNIKÁCIE / COMMUNICATIONS 1/2003
C O M M U N I C A T I O N S<br />
I S<br />
PREHĽADY / REVIEWS<br />
rôznych počiatočných podmienkach. Treba však poz<strong>na</strong>me<strong>na</strong>ť, že<br />
experimenty boli realizované <strong>na</strong> stredne výkonnej výpočtovej technike.<br />
Prípadné vyššie uvedené simulačné artefakty je možné teoreticky<br />
anulovať v ľubovoľnej miere s využitím metód ergodickej<br />
teórie. V prípade pozitívneho ohlasu odbornej verejnosti, prezentovaný<br />
príspevok môže byť podnetom pre ďalší výskum v oblasti<br />
modelovania a simulácie.<br />
multiple repeated simulations using various initial conditions.<br />
However, it is necessary to notice that the experiments were executed<br />
using a moderate-powerful computer. In case of necessity it<br />
is theoretically possible to depress the above mentioned simulation<br />
drawbacks under an arbitrary low level by application of ergodic<br />
theory tools. If the presented contribution is positively accepted,<br />
it can became a source of inspiration and further development in<br />
the field of modeling and simulation<br />
4. Záver<br />
V súčasnosti sa uprednostňujú matematické modely terénu,<br />
ktoré sú založené <strong>na</strong> a<strong>na</strong>lyticky definovanej funkcii a ktoré môžu<br />
kombinovať sklon, druh a stav terénu resp. vozovky, t. j. nerovnosti<br />
mikroprofilu a makroprofilu povrchu terénu súčasne s kvalitou<br />
povrchu terénu. Takto spracovaný model dobre vyhovuje<br />
simuláciám dy<strong>na</strong>mického <strong>na</strong>máhania motorového vozidla za jazdy<br />
a simuláciám <strong>na</strong>máhania agregátov h<strong>na</strong>cieho mechanizmu vozidla.<br />
Kvalitný matematický model terénu resp. vozovky spoločne so<br />
základnými konštrukčnými vlastnosťami motorového vozidla, výkonovými<br />
parametrami a parametrami hospodárnosti vozidla potom<br />
slúžia pre vypracovanie prevádzkového spektra zaťaženia hlavných<br />
agregátov motorového vozidla. Príspevok dokumentuje postup pri<br />
tvorbe pseudostochastického modelu terénu, ktorý umožní operatívne<br />
priblížiť výsledky simulácií dy<strong>na</strong>mického <strong>na</strong>máhania k výsledkom<br />
reálneho <strong>na</strong>máhania v skutočnej prevádzke motorového<br />
vozidla. Pre komplexné riešenie <strong>vplyvu</strong> nerovností vozovky <strong>na</strong><br />
vibrácie a otrasy dopravných prostriedkov je potrebné doplniť<br />
v príspevku popisovaný matematický model profilu terénu o riešenie<br />
otázok štatistických vlastností nerovností povrchu vozovky,<br />
resp. terénu.<br />
4. Conclusion<br />
Nowadays, mathematical models based on a<strong>na</strong>lytically defined<br />
functions are preferred. They allow describing various combi<strong>na</strong>tions<br />
of geometric characteristics such as a slope, type and state of<br />
terrain, undulation or microstructure of a road surface and many<br />
other qualitative and quantitative parameters. The above mentioned<br />
classical way of modeling is satisfactory for simulation of dy<strong>na</strong>mical<br />
strain of vehicle-construction during its drive operation and<br />
for simulation of strain of its motive aggregates. The qualitative<br />
mathematical model of terrain or roadway surface in conjunction<br />
with a set of main technical characteristics of motorcar e<strong>na</strong>bles to<br />
predict expectable operatio<strong>na</strong>l properties and efficiency parameters.<br />
Using stochastic approach presented in the paper it is possible<br />
to take into account an incomparably wider spectrum of potential<br />
terrain attributes and consequently gain a broad spectrum of results.<br />
Due to the probabilistic <strong>na</strong>ture of vibrations and snubbing it is the<br />
only way how to simulate them. On the other hand, this approach<br />
is a challenge for research oriented into the area of statistical properties<br />
of terrain and, from the theoretical point of view, the challenge<br />
for development of new methods of construction of special<br />
mathematical structures having a priori expected probabilistic<br />
behavior.<br />
Literatúra – References<br />
[1] BEKKER, M., G.: Introduction to Terrain – Vehicle Systems. The University of Michigan Press, Michigan, 1969.<br />
[2] ELLIS, J., R.: Vehicle Dy<strong>na</strong>mics. Business Books Limited. London, 1985.<br />
[3] VLK, F.: Dy<strong>na</strong>mika motorových vozidel. Nakladatelství a vydavatelství VLK. 1. vydání, ISBN 80-238-5273-6. Brno, 2000<br />
KOMUNIKÁCIE / COMMUNICATIONS 1/2003 ●<br />
75
C O M M U N I C A T I O N S<br />
I S<br />
Roman Marcinkowski *<br />
POSUDZOVANIE KVALITY ČASOVÝCH PLÁNOV STAVIEB<br />
QUALITY ASSESSMENT OF CONSTRUCTION SCHEDULES<br />
Príprava časových plánov je tvorivá činnosť. Podľa predstavivosti a vy<strong>na</strong>liezavosti rôznych riešiteľov sa môžu vytvoriť rôzne verzie plánov<br />
rov<strong>na</strong>kého projektu. Potom je potrebné sa pýtať, ktorý plán je <strong>na</strong>jlepší, s ktorým scenárom vyko<strong>na</strong>nia prác je účinok prác <strong>na</strong>vrhnutých riešiteľov<br />
<strong>na</strong>jvýhodnejší. Tento článok uvádza formalizovanú metódu posudzovania kvality <strong>na</strong>vrhnutých časových plánov. Jej metodický základ je založený<br />
<strong>na</strong> modeli procesu plánovania výroby v stavebnej výkonnej jednotke. Posúdenie plánu je vztiahnutie <strong>na</strong> absolútnu stupnicu (v intervale 0,1)<br />
a je objektivizované s využitím nákladov <strong>na</strong> stredné straty pri realizácii.<br />
Preparing a schedule is a creative activity. Depending on the planner’s imagi<strong>na</strong>tion and inventiveness different visions of the plan of the<br />
same project are created. At this stage it is worth asking which plan is the best, with which sce<strong>na</strong>rio for the works execution the effect of the<br />
contractor’s construction operation is the most desirable. This article presents a formalized method of construction schedules’ quality assessment.<br />
Its methodical basis is constituted by the model of production scheduling process in a construction execution unit. The assessment of<br />
schedules is referred to the absolute scale (in interval 0,1) and is objectified using the costs of realization means outage.<br />
1. Introduction<br />
Schedule is a tool of material and time planning. In present<br />
times, in construction production planning, a computer with selected<br />
software for planning and controlling the project execution is<br />
used to prepare schedules. It allows constant updating of the vision<br />
of the operations, monitoring the progress of works, the engagement<br />
of resources, and an assessment of the effects.<br />
Computer planning technique e<strong>na</strong>bles experimenting on<br />
models. The set of tasks defined by the organizer – planner can<br />
be modified in many different ways, thus generating different sce<strong>na</strong>rios<br />
for the operations. Preparing a schedule is a creative activity.<br />
Depending on the planner’s imagi<strong>na</strong>tion and inventiveness different<br />
visions of the plan of the same project are created. At this<br />
stage it is worth asking which plan is the best, with which sce<strong>na</strong>rio<br />
for the works execution the effect of the contractor’s construction<br />
operation is the most desirable. The answer to this question poses<br />
certain difficulties. Production schedules, and project schedules<br />
can be assessed using different criteria [l]. The criteria are a set of<br />
preferences, whose parts are most often mutually contradictory.<br />
In this case it is necessary to combine the criteria using usability<br />
functions or employing the technique of reaching compromise<br />
evaluations.<br />
It must be stated that in the case of real production programs<br />
of construction execution units it is not possible to create optimal<br />
schedules in the exact meaning of the word. However, for each<br />
prepared production schedule it is possible to devise characteristics<br />
e<strong>na</strong>bling its value assessment. In order to compare a few schedules<br />
a synthetic assessment index is required, which is always disputable<br />
because it is defined on the basis of partial characteristics.<br />
This article will present a formalized method of construction<br />
schedules’ quality assessment. Its methodical basis is constituted<br />
by the model of production scheduling process in a construction<br />
execution unit. The assessment of schedules is referred to the<br />
absolute scale (in interval 0,1) and is objectified using the costs<br />
of realization means outage.<br />
2. Model of the scheduling process<br />
Planning, in order to be concrete and reliable, must be based<br />
on real data. These data concern work consumption of construction<br />
processes as well as material and prefabricated units consumption,<br />
which are termed, in construction terminology, the<br />
resources input. In order to ma<strong>na</strong>ge the resources we need to know<br />
their reliably defined input. In construction production planning<br />
practice is used a catalog construction database of material input<br />
KNR, e<strong>na</strong>bling a computer cost calculation of construction works<br />
and computer project planning. For each task and construction<br />
project, whose technologies of work processes execution and their<br />
scope are known, one is able to determine the resource input for<br />
their realization in a relatively quick and reliable (which is the<br />
most important) way. The only problem is employing the information<br />
in ma<strong>na</strong>ging the resources, allocating the resources to tasks,<br />
and defining the deadlines for works realization. All this is the<br />
subject of harmonizing construction production. Let us present<br />
a model of the scheduling process created with the use of a computer<br />
technique utilizing a catalog database of material input.<br />
* Roman Marcinkowski Ph.D.<br />
Institute of Military Engineering, Military University of Technology, Warsaw, Tel.: (48-22) 683-91-41, E-mail: romanm@sec.polbox.pl<br />
76 ● KOMUNIKÁCIE / COMMUNICATIONS 1/2003
C O M M U N I C A T I O N S<br />
I S<br />
Let us assume that all the catalog database tasks make up the<br />
set O {o 1 , o 2 , …, o i , …, o I }. For each task is determined a quantity<br />
survey unit j i (i 1, 2, …, I) and the usage of the material<br />
input – resources. Let us also assume that the resources constitute<br />
the set: S {s 1 , s 2 , …, s k , …, s K }, in which the r of the first<br />
numbers constitute active resources. The remaining resources in<br />
set S are passive resources. We can further assume that the register<br />
of the active resources <strong>na</strong>mes makes up the subset: and the<br />
<strong>na</strong>mes of the passive resources constitute the subset: S b {s b 1, s b 2,<br />
…, s b q, …, s b Q} The resource input per task unit is characterized by:<br />
– labor consumption of the tasks defined in matrix N [n ik ] IK<br />
by parts n il for 1 l, 2, …, r, representing the resource consumption<br />
l : s 1 S a per task realization unit i : o i O.<br />
– passive resource consumption defined in matrix N [n ik ] IK<br />
by parts n il for q r 1, r 2, …, K, representing the resource<br />
consumption q : s q S b per task realization unit i : o i O.<br />
The active resources found in the database of tasks should<br />
help characterize the production potential of the tasks’ contractor<br />
(or the contractors), defining their “state of possessions.” Let us<br />
assume, for the sake of generality, that we will be considering many<br />
“contractors” and that for each of them we will be examining the<br />
quality of the schedule, of course as it relates to the given contractor.<br />
Such an approach is necessitated by the planning and construction<br />
realization practice. In any construction process are engaged<br />
many subjects – construction execution units, for which the issue<br />
of scheduling quality is a separate problem. Obviously, there is<br />
also a problem of global assessment – of harmonizing the work for<br />
all the contractors.<br />
Let us assume that in the model the contractors constitute set<br />
R {r 1 , r 2 , r z , …, r Z }. The contractors’ state of possessions will<br />
be described by matrix P [p zl ] Zr , in which p zl will determine<br />
the amount of the l-th resource in the z-th organizatio<strong>na</strong>l unit of<br />
the set of contractors. Sets S, O, R and matrixes N, P, and the<br />
unitary vector J constitute a computer database, which is very useful<br />
for planning a<strong>na</strong>lysis in organizing the operations. A block algorithm<br />
of organizatio<strong>na</strong>l proceedings with computer facilitation is<br />
presented in fig. l. In the process presented there one can distinguish<br />
three stages:<br />
– the assessment of the labor consumption and of the material needs<br />
to carry out the tasks planned for realization;<br />
– harmonizing the operations along with an assessment of the needs<br />
as to the means of the operations;<br />
– planning the use of the contractors’ production potential (exami<strong>na</strong>tion<br />
of loading and reserves in the active resources work).<br />
It is not difficult to carry out the first two stages using the<br />
existing computer programs (programs for a<strong>na</strong>lyzing the input,<br />
cost calculation, planning and controlling the project realization).<br />
Commonly used in construction, the technique of transmitting data<br />
from one application to another allows conducting the primary<br />
a<strong>na</strong>lysis of the operation’s plan, that is tasks’ realization schedule,<br />
efficiently and reliably.<br />
The task database helps to quickly define the kind (set O k )<br />
and the scope (vector J k ) of works in the discussed projects and<br />
of the automation of material input calculation for their execution.<br />
Defined by the planner, set O k , vector J k and the calculated inputs-<br />
N k [n k ik] I k K ; of work consumption n k il (l 1, 2, …, r); of passive<br />
resources usage - n k iq (q r 1, r 2, …, K), constitute an indirect<br />
database for the task scheduling stage. On their basis the set<br />
of harmonized tasks O h is created, and the resource input is calculated<br />
for a newly defined task structure.<br />
In this procedure are created subsets Y i (i 1, 2, …, I h ) of set<br />
O k . Each of subset determines the labor consumption and the<br />
usage of a passive harmonized tasks input (of set O h ). The labor<br />
consumption for these tasks (consuming the hours of work of the<br />
people and equipment), in the case of determining the composition<br />
of the execution team, is a decisive factor for the tasks deadline<br />
t i :<br />
h<br />
t i max nil<br />
for z : o h<br />
lS a i O h (1)<br />
x i l<br />
where: nil<br />
h – the labor consumption of the i-th task in relation to<br />
the l-th (l : s l S a ),<br />
x il – the amount of resources of the l-th type directed to<br />
realizing the i-th task.<br />
In the case of defining time t i, the amount of the needed<br />
active resources is generated:<br />
h<br />
il<br />
x il n for i : o h i O h , l : s<br />
t l S a (2)<br />
i<br />
However, if the composition oft he execution team bas been<br />
determined – x il and the time of task execution – t i, it is possible<br />
to calculate the maximum task labor consumption:<br />
n il<br />
h = x il t i for i : o h i O h , l : s l S a (3)<br />
If this labor consumption is lower than the one required, the<br />
chosen values need to be verified, so that:<br />
n il<br />
h nil h for i : o h i O h , l : s l S a (4)<br />
Both the task and resource input are visualized in time scale,<br />
after the deadlines, time, and the mutual dependence of tasks are<br />
defined, generating the task execution and resource needs schedule.<br />
A generated schedule gives an overview of the sequence and<br />
timing of the operations execution. It lacks, however, any insight<br />
into the contractors’ efforts towards these tasks. For this end, a dual<br />
a<strong>na</strong>lysis of the operations plan is used.<br />
3. Planning the contractors’ resources usage<br />
Creating work schedules of each of the contractors’ resources<br />
is a relatively problematic task, when conducted with the use of the<br />
commonly known applications. The programs for project planning<br />
exhibit certain flaws in this respect. If, for example, it is possible<br />
to monitor the labor consumption of the resources, at this particular<br />
stage of the program’s work, there is no way of defining the<br />
tasks for the contractors. This problem can be solved as follows.<br />
KOMUNIKÁCIE / COMMUNICATIONS 1/2003 ●<br />
77
C O M M U N I C A T I O N S<br />
I S<br />
Fig. 1 Block scheme of planning the organization of operations with computer facilitation<br />
78 ● KOMUNIKÁCIE / COMMUNICATIONS 1/2003
C O M M U N I C A T I O N S<br />
I S<br />
For each of the contractors, we filter the initially created<br />
schedule (for a the tasks). Thus we create separate schedules for<br />
the contractors, at the same time bearing in mind that the terms<br />
appearing in the general schedule should be defined. The available<br />
programs for project planning most often do not e<strong>na</strong>ble determining<br />
the allocation of the resources to the tasks defined in the<br />
Taking-off quantities<br />
No Basis Description Quantity-survey unit Quantity survey<br />
1 KNR 2-01 0405-01 + KNR 2-01 0406-02 Preparing the subsoil for the earth-dam m^3 346<br />
embankments<br />
2 KNR 2-01 0202-02 + KNR 2-01 0214-04 Acquiring and transport of the soil m^3 1500<br />
3 KNR 2-01 0407-01 Forming and thickening the earth dams m^3 2340<br />
4 KNR 2-01 0229-02 + KNR 2-01 0229-05 Moving earth masses with bulldozers m^3 350<br />
5 KNR 2-31 0103-02 Preparing the subsoil for macadam m^2 7*35 = 245.00<br />
6 KNR 2-31 0204-05 + KNR 2-31 0204-01 Laying the macadam m^2 7*35 = 245.00<br />
Material tasks’ schedule<br />
Schedule of the resources’ work<br />
Workload of brigade 1 resources<br />
Workload of brigade 2 resources<br />
Fig. 2. Diagram of methodology of construction tasks scheduling<br />
KOMUNIKÁCIE / COMMUNICATIONS 1/2003 ●<br />
79
C O M M U N I C A T I O N S<br />
I S<br />
schedule, along with providing the information on their labor consumption.<br />
An example of such an a<strong>na</strong>lysis is presented in fig. 2,<br />
where in the MS Project program, the workload of the organizatio<strong>na</strong>l<br />
units was examined. The schedules of the tasks carried out<br />
by both the units were generated by filtering the project general<br />
schedule (the technique of filtering is essentially compatible with<br />
the commonly-known technique of filtering the data in spread<br />
sheets). The schedule contains all the data referring to the task<br />
labor consumption and the material resources usage (not shown<br />
in the schedule).<br />
The screen “Resource Usage” shows the work of the resources<br />
in time and “after the tasks.” Thus we are offered an extremely<br />
synoptic view of the production potential of each of the contractors.<br />
The sheet can be completed with information defining the<br />
unused potential of the contractor’s resources labor consumption.<br />
It is the result of subtraction of the maximum and the needed<br />
labor consumption of each of the resources at the contractor’s disposal.<br />
Resources shortages can be sig<strong>na</strong>led on the screen.<br />
The presented method of scheduling the work of the resources<br />
can be carried out using a properly prepared program for planning<br />
projects, or a special spread sheet. In both cases, it must be remembered<br />
that the schedule should be generated by the primary computer<br />
transformation of the prepared schedule. Of course, here<br />
the planner has an important role to play, as it is him who defines<br />
the tasks for the contractors, monitoring the results of his decisions<br />
on the schedules of their resources usage.<br />
The schedules of the resources work created using the dual<br />
a<strong>na</strong>lysis of the plan carry very important information for the person<br />
directing the operations, since he can quickly evaluate which<br />
resources of which of the contractors are overloaded, and which<br />
are not used. A diagram of methodology of scheduling construction<br />
works is presented in fig. 2.<br />
4. Resources-usage assessment as schedule-quality<br />
assessment<br />
The basic problem in resource ma<strong>na</strong>gement is assigning harmonized<br />
tasks (set O h ) to the contractors of engineer and construction<br />
projects (set R). A planner should be aiming at the fullest<br />
use of the contractors’ production means, that is assigning sets of<br />
tasks which require engaging the contractors’ entire execution<br />
potential. This objective poses certain problems. The tasks are not<br />
dividable, are characterized by a specific sequence of execution,<br />
engage various sets of resources and have time-constraints (specified<br />
by instructions and implied in the schedule). Additio<strong>na</strong>lly, in many<br />
situations, “tearing” the contractors’ structures (their resources<br />
assignment) is not practiced. In such situations, organizatio<strong>na</strong>l units,<br />
for example, military sections receive sets of tasks to perform<br />
which do not engage their whole execution potential. Assigning<br />
tasks to contractors should depend on:<br />
– the availability of the contractors’ resources,<br />
– executing tasks or tasks’ stages within the deadlines set by the<br />
instructions.<br />
Both these conditions can be effectively monitored by a program<br />
for planning and controlling project execution. Such programs<br />
make possible defining the deadlines for task realization specified<br />
by instructions, as well as calculating the resource needs and comparing<br />
them with the level of the resources availability in each<br />
time unit. However, how can one assess the quality of the plans as<br />
far as the resource use is concerned<br />
Resources (means of work) are of varied character. The outage<br />
of one means can be of negligible importance in the face of<br />
making a better use of another. This is why a synthetic index of the<br />
assessment of the resources’ work time use is needed. It is advised<br />
that the index be determined based on the cost of losses incurred<br />
by the work means’ outage. Each active resource, when working,<br />
brings the contractor (employer) given fi<strong>na</strong>ncial benefits. The<br />
benefits are result of indirect costs and profit calculated based on<br />
the direct costs of labor and equipment’s work. A percentage index<br />
of these costs oscillates between 45 and 80 per cent of the direct<br />
costs. Knowing the piecework rate for workers and machines, it is<br />
not difficult to determine the cost of losses as a loss of the potential<br />
income from the resources’ work costs surcharge. So, for<br />
example, an hour of a digger’s outage can result in a potential loss<br />
of about 20-35 PLN, and a worker’s outage can cost 5-8 PLN.<br />
Let us assume that towards an estimate of the schedules’<br />
quality, an a<strong>na</strong>lyst is able to determine the cost of losses c l (l : s l <br />
S a ) caused by the work means’ outage per time unit.<br />
For the purpose of comparing the schedules for different contractors,<br />
one should strive to determine the index in the absolute<br />
scale. However, because work harmonization varies in the time<br />
scale, and the production activity of each of the contractors is<br />
practically never-ending, such an index should be determined in<br />
the function of time. Here, is meant both the time period for which<br />
we are examining the quality of work harmonization and the calendar<br />
time, and also the moments in the considered time scale.<br />
In order to assess the quality of work organization, it is suggested<br />
to determine the index of the contractors’ work harmonization<br />
in the examined time interval T; T t for period t<br />
according to the formula:<br />
0<br />
zl (t) c l p zl<br />
C z lS<br />
(t) <br />
a 0<br />
(z,l)<br />
(c l p zl 0) (5)<br />
lS<br />
c l p zl<br />
a<br />
where: zl (t) – is the coefficient of the work-time use of the l-th<br />
resource in time t.<br />
The coefficient of the work-time use oft he l-th resource of the<br />
z-th contractor, for whom p zl 0, in time t 0 is determined<br />
according to the formula:<br />
zl (t) N zl(<br />
t)<br />
(6)<br />
p z l t<br />
where: N zl (t) – work-time input of the l-th resource of the z-th contractor<br />
in time t determined based on the schedule<br />
in the examined time period – T; T t.<br />
80 ● KOMUNIKÁCIE / COMMUNICATIONS 1/2003
C O M M U N I C A T I O N S<br />
I S<br />
Index C z (t) does not describe the real costs of the losses in<br />
plan realization. It is only a quantity expression of the project realization<br />
schedule’s quality, and more specifically, of work harmonization<br />
for the contractors. When the index approaches “1”, it<br />
manifests a good planning decision, and when it reaches zero, it is<br />
a sig<strong>na</strong>l that the resources’ work has not been harmonized. An<br />
exami<strong>na</strong>tion of the resources use can be carried out for each of the<br />
contractors and for the whole task realization schedule, and in<br />
both cases - in optio<strong>na</strong>lly defined time periods. Such a<strong>na</strong>lyses are<br />
described in the example that follows.<br />
5. Example of schedule quality assessment<br />
In order to assess the quality of a schedule, the following data<br />
referring to specified contractors should be known:<br />
– state of resource availability (workers and machines) – amount<br />
of resources allocated to performing works specified in the<br />
material tasks schedule (if this availability changes in time, the<br />
resource availability profiles in the time scale should be known);<br />
– work input (labor consumption) for each of the resources in the<br />
function of time (for example, on each day of the considered<br />
schedule);<br />
– costs of the resources outage – potential loss incurred by the<br />
outage (non-usage) of each resources in unitary time (for<br />
example, during l hour).<br />
For the schedule shown in fig. 2 and the labor consumption<br />
characterized there, we will carry out an a<strong>na</strong>lysis of resourceswork<br />
harmonization in the case of two brigades. The work input<br />
of the resources of both brigades is presented in table l. The state<br />
of the brigades’ resources (resource availability) was determined<br />
in table 2. The table presents the profiles (the amount of resources<br />
changing in the time scale) of the availability of each of the work<br />
means. It also contains the assumed costs of losses incurred by<br />
the outage of each means during l hour. In table 3 are shown the<br />
results of work-time-use a<strong>na</strong>lysis by the available resources – coefficients<br />
zl (t) needed to calculate the synthetic index of the workharmonization<br />
quality assessment for the considered contractors.<br />
In figure 3 is presented the histogram of assessment of the<br />
contractors’ resources work harmonization for each day of project<br />
execution. The diagram was made using formulas (5) and (6) for<br />
an 8-hour resources’ workday. For each day were calculated the<br />
coefficients of work-time use on the part of the contractor’s each<br />
resource, and next was determined the harmonization assessment<br />
index.<br />
In figure 4 are presented graphs of the function of resourcework-harmonization<br />
assessment in variable time period counted<br />
from the commencement of the project until the time defined on<br />
the axis of ordi<strong>na</strong>tes. One can read from the graphs that the coefficients<br />
of resource use in the entire project are 0.43 for Brigade l,<br />
and 0.71 for Brigade 2. The planner, however, will not always take<br />
under consideration the whole schedule of works. In particular,<br />
this will be the case when the scope of works for the single contractor<br />
is changing as a result of adding a realization system for tasks<br />
not included in the a<strong>na</strong>lyzed schedule. More important in this sit-<br />
Fig. 3. A histogram of the assessment of the resources’ work<br />
harmonization for individual contractors on the individual days<br />
of project execution<br />
Work input of the specified contractors in project execution<br />
Table l<br />
Resources<br />
Resource-work input in [h] on each day of project execution<br />
10 11 12 13 14 15 16<br />
Input in total<br />
Brigade 1<br />
Workers 4.17 15.24 15.24 24.68 49.71 36.1 145.14<br />
Bulldozer 74 KW (100 KM) 5.81 5.81<br />
Self-propelled static roller 15 t 2.19 3.3 5.49<br />
Self-propelled static roller 10 t 2.19 0.55 2.74<br />
Brigade 2<br />
Workers 21 70.56 159.95 159.95 159.95 159.95 110.39 841.75<br />
Caterpillar bulldozer 55 KW 8 6.53 14.53<br />
Bulldozer 74 KW (100 KM) 15.35 15.35 15.35 15.35 15.35 76.75<br />
Self-propelled vibrating roller 9 t 5.7 8 8 8 8 6.38 44.08<br />
Caterpillar digger 0.4 m 3 17.31 17.31 17.31 17.31 17.31 86.55<br />
Self-unloading truck up to 5 t 145.56 145.56 145.56 145.56 145.56 727.8<br />
Vibrating combustion thickener 8 8 8 8 6.38 38.38<br />
KOMUNIKÁCIE / COMMUNICATIONS 1/2003 ●<br />
81
C O M M U N I C A T I O N S<br />
I S<br />
Resource availability for the specified contractors in project execution and costs of outage Table 2<br />
Resources<br />
Amount of resources available on each day of project execution<br />
Costs of outage<br />
10 11 12 13 14 15 16 during 1 h<br />
Brigade 1<br />
Workers 2 2 2 6 6 6 5 PLN<br />
Bulldozer 74 KW (100 KM) 1 1 25 PLN<br />
Self-propelled static roller 10 t 1 1 1 28 PLN<br />
Self-propelled static roller 10 t 1 1 1 25 PLN<br />
Brigade 2<br />
Workers 10 10 20 20 20 20 20 5 PLN<br />
Caterpillar bulldozer 55 KW 1 1 30 PLN<br />
Bulldozer 74 KW (100 KM) 2 2 2 2 2 25 PLN<br />
Self-propelled vibrating roller 9 t 1 1 1 1 1 1 1 25 PLN<br />
Caterpillar digger 0.4 m 3 2 2 2 2 2 2 2 30 PLN<br />
Self-unloading truck up to 5 t 20 20 20 20 20 20 20 23 PLN<br />
Vibrating combustion thickener 1 1 1 1 1 17 PLN<br />
Results of the work-time use by the available resources – coefficients zl (t) Table 3<br />
Resources<br />
Values of the work-time use coefficients by the available resources on each day<br />
19 20 21 22 23 24 25<br />
Brigade 1<br />
Workers 0.2606 0.9525 0.9525 0.5142 1.0356 0.7521 0<br />
Bulldozer 74 KW (100 KM) 0.7262 0 0 0 0 0 0<br />
Self-propelled static roller 10 t 0 0 0 0.2738 0.4125 0 0<br />
Self-propelled static roller 10 t 0 0 0 0.2738 0.0688 0 0<br />
Brigade 2<br />
Workers 0.2625 0.882 0.9997 0.9997 0.9997 0.9997 0.6899<br />
Caterpillar bulldozer 55 KW 1 0.8163 0 0 0 0 0<br />
Bulldozer 74 KW (100 KM) 0 0 0.95945 0.9594 0.9594 0.9594 0.9594<br />
Self-propelled vibrating roller 9 t 0.7125 0 1 1 1 1 0.7975<br />
Caterpillar digger 0.4 m 3 0 1.0819 1.0819 1.0819 1.0819 1.0819 0<br />
Self-unloading truck up to 5 t 0 0.9098 0.9098 0.9098 0.9098 0.9098 0<br />
Vibrating combustion thickener 0 0 1 1 1 1 0.7975<br />
uation will be a harmonization of the resources’ work in the near<br />
time horizon. The discussed graphs contain the information needed<br />
in this case.<br />
Fig. 4. Graphs of the function of the resources’ work harmonization<br />
assessment in a period counted from the commencement of the project<br />
6. Conclusion<br />
The presented method of harmonizing the contractors’ work<br />
can be applied for assessing and comparing the quality of schedules,<br />
including ones prepared by a number of independent planners<br />
and destined for the same scope of operations. The essence of the<br />
described approach is making the evaluation dependent on the time<br />
and reducing it to a uniform scale from zero to one, in which “1”<br />
denotes the state of full harmony in utilizing the means of work,<br />
and zero stands for the contractor’s complete idleness.<br />
It is possib1e to carry out an assessment using a synthetic<br />
index, as proposed here, only in a situation when one can perform<br />
a valuation of outage (idleness) – which is not conducive for the<br />
harmonizing process – of various work means (active resources).<br />
82 ● KOMUNIKÁCIE / COMMUNICATIONS 1/2003
C O M M U N I C A T I O N S<br />
I S<br />
It is worth bearing in mind that in practice it is rare1y possib1e to<br />
ensure constant work for all the resources. Most often, an elimi<strong>na</strong>tion<br />
of the discontinuity in employing one resource results in<br />
breaks of the work of another. This is why there arises a need for<br />
a valuation of the resources’ work, or strictly speaking, their idleness,<br />
which is derived from a valuation of work with costs taken<br />
under consideration. Here, was adopted a rule that the more expensive<br />
resource, whose work generates greater return, is more important<br />
for ensuring a constancy of work than the one whose work<br />
brings smaller fi<strong>na</strong>ncial benefits. Of course, a valuation of the idleness<br />
of various resources does not have to be determined by these<br />
rules. The process of valuation can be performed by the planner,<br />
based on the criteria of assessing the importance of constancy of<br />
work known to him.<br />
References<br />
[1] JAWORSKI, K. M.: “Wielokryterial<strong>na</strong> a<strong>na</strong>liza jakości harmonogramów budowlanych.” [Multi-criterial a<strong>na</strong>lysis of construction schedules’<br />
quality] Przegląd Budowlany, No 1, Jan. 2002.<br />
[2] JAWORSKI, K. M.: Metodologia projektowania realizacji budowy. [Methodology of designing construction execution] Warszawa:<br />
PWN, 1999.<br />
[3] Informatyka stosowa<strong>na</strong> w inżynierii produkcji budowlanej. [Applied informatics in construction production engineering] Ed. O. Kaplinski.<br />
Poz<strong>na</strong>n: Wydawnictwo Politechniki Poz<strong>na</strong>ńskiej, 1996.<br />
[4] MARCINKOWSKI, R.: “Problemy planowania działań inżynieryjnych w sytuacjach kryzysowych.” [Problems of planning engineer operations<br />
in crisis situations] Conference proceedings – Technologiczne, organizacyjne i ekonomiczne aspekty rozwoju budownictwa [Technological,<br />
organizatio<strong>na</strong>l and economic aspects of the development of construction] Olsztyn: Uniwersytet Warmińsko-Mazurski,<br />
2002.<br />
[5] ZIELIŃSKI, B.: Microsoft Project 98. Zarządzanie przedsięwzięciami. [Project ma<strong>na</strong>gement] Warszawa: Wyd. MIKOM, 2000.<br />
KOMUNIKÁCIE / COMMUNICATIONS 1/2003 ●<br />
83
C O M M U N I C A T I O N S<br />
I S<br />
Niektoré problémy suchého trenia<br />
V marci r. 2002 vydala Žilinská <strong>univerzita</strong> v Žiline vo vydavateľstve EDIS monograficky spracovanú<br />
obsahovo hodnotnú odbornú publikáciu autorov Vladimíra Hlavňu a Rudolfa Řezníčeka<br />
s názvom Niektoré problémy suchého trenia.<br />
Publikácia sa venuje niektorým problémom suchého trenia vo vzťahu k jeho využitiu v trecích<br />
brzdách dopravnej techniky, <strong>na</strong>jmä však koľajových vozidiel a automobilov.<br />
Zaoberá sa niektorými termomechanickými problémami suchého trenia v súvislosti s ich prejavmi<br />
v praxi, experimentálnym zariadením pre výskum trecích bŕzd a reálnou problematikou brzdenia<br />
a trecích bŕzd koľajových a kolesových vozidiel.<br />
Je rozdelená do dvoch častí. Autori v nich prezentujú výsledky niekoľkoročných teoretických<br />
i praktických skúseností z oblasti suchého trenia.<br />
Časť A podáva prehľad dosiahnutých poz<strong>na</strong>tkov v teoretickej a experimentálnej oblasti termomechanických<br />
charakteristík suchého trenia. Kladie dôraz <strong>na</strong> popis tzv. termoelastickej nestability<br />
suchého trenia a jej dôsledky v technickej praxi. Zaoberá sa tiež popisom zotrvačníkového brzdového<br />
stavu Katedry koľajových vozidiel, motorov a zdvíhadiel SjF ŽU. Tento brzdový stav bol <strong>na</strong><br />
katedre vybudovaný a je schválený subkomisiou UIC „Brzdenie“ (UK 5T) ako univerzálny brzdový<br />
stav kategórie D (do rýchlosti 350 km.h 1 ) pre vykonávanie medzinárodných homologačných skúšok<br />
obložení a klátikov železničných bŕzd podľa predpisov UIC 541-3 a UIC 541-4. V UIC je vedený pod<br />
hlavičkou ŽSR. V časti A je tiež pre priblíženie skúšobnej problematiky čitateľovi popísaná metodika<br />
a výsledky skúšok životnosti obložení a diskov železničnej kotúčovej brzdy <strong>na</strong> uvedenom brzdovom<br />
stave.<br />
V časti B sú rozobraté niektoré problémy vyplývajúce z teórie brzdenia kolesových vozidiel,<br />
nielen z pohľadu požiadaviek <strong>na</strong> ich konštrukciu, ale aj z pohľadu a<strong>na</strong>lýz dopravných nehôd. Táto<br />
kapitola sa zaoberá aj otázkami prevádzkových a laboratórnych skúšok brzdových obložení. Tieto<br />
v plnej miere využívajú výsledky teórie suchého trenia. V tejto časti sú definované legislatívou stanovené<br />
skúšky a pre názornosť uvedené výsledky konkrétnych meraní. Časť je venovaná aj modulom<br />
(stanovištiam) spomí<strong>na</strong>ného brzdového skúšobného stavu, ktoré sa využívajú pri laboratórnych<br />
skúškach brzdových obložení kolesových vozidiel.<br />
Kniha je určená odborníkom z oblasti dopravnej techniky, študentom univerzít, výskumným<br />
pracovníkom a z<strong>na</strong>lcom v odbore koľajové vozidlá a doprava cestná.<br />
Publikácia je príspevkom do rozvoja poz<strong>na</strong>tkov v oblasti suchého trenia. Jej erudovanosť a vierohodnosť<br />
je garantovaná výsledkami vedeckovýskumnej práce autorov.<br />
prof. Ing. Milan Mikleš, DrSc.<br />
84 ● KOMUNIKÁCIE / COMMUNICATIONS 1/2003
C O M M U N I C A T I O N S<br />
I S<br />
Názov doktorandskej<br />
dizertačnej práce: Vyšetrovanie vlastností a identifikácia parametrov spí<strong>na</strong>ného<br />
reluktančného motora<br />
Autor:<br />
Ing. Pavol Rafajdus<br />
Vedný odbor: 26-32-9 silnoprúdová elektrotechnika<br />
Školiace pracovisko: Elektrotechnická fakulta Žilinskej univerzity<br />
Školiteľ:<br />
prof. Ing. Valéria Hrabovcová, PhD.<br />
Dizertačná práca sa zaoberá problematikou a<strong>na</strong>lýzy vlastností a identifikáciou parametrov spí<strong>na</strong>ného<br />
reluktančného motora. O tento motor je čoraz väčší záujem vo viacerých odvetviach priemyslu,<br />
ako jedného z kandidátov <strong>na</strong> náhradu doteraz používaných „klasických“ elektrických strojov<br />
vzhľadom <strong>na</strong> jeho robustnosť, jednoduchosť a lacnú konštrukciu. Prvá časť práce je zameraná <strong>na</strong><br />
teoretickú a<strong>na</strong>lýzu jednotlivých konštrukčných usporiadaní SRM, odvodenie okamžitého a stredného<br />
momentu <strong>na</strong> základe elektromechanickej premeny energie v SRM. Je vypracovaný a odvodený lineárny<br />
a nelineárny matematický model <strong>na</strong> riešenie prechodových dejov SRM. V ďalšej časti sa práca<br />
zaoberá podrobnou identifikáciou dôležitých parametrov reálneho SRM, ktorými sú indukčnosť,<br />
spriahnutý magnetický tok a statické charakteristiky momentu. Ako nástroje identifikácie uvedených<br />
parametrov boli použité meracie metódy, metóda konečných prvkov a a<strong>na</strong>lytický výpočet. Práca sa<br />
zaoberá taktiež a<strong>na</strong>lýzou strát a účinnosti SRM meraním a straty v železe sú a<strong>na</strong>lyticky vypočítané<br />
z odvodených tvarov spriahnutého magnetického toku pre jednotlivé časti motora. Ďalšia časť práce<br />
je venovaná optimalizácii veľkosti stredného elektromagnetického momentu SRM vplyvom zmeny<br />
tvaru rotora a pri zachovaní rozmerov statora. V závere sa uvádzajú základné zásady metodiky<br />
konštrukčného návrhu SRM, ktorá zabezpečí, že vyrobený motor bude vykazovať predpokladané<br />
vlastnosti.<br />
Autor:<br />
Školiteľ:<br />
ŽILINSKÁ UNIVERZITA V ŽILINE<br />
Elektrotechnická fakulta<br />
doktorandská dizertačná práca<br />
VYŠETROVANIE VLASTNOSTÍ<br />
A IDENTIFIKÁCIA PARAMETROV<br />
SPÍNANÉHO RELUKTANČNÉHO MOTORA<br />
Vedný obor:<br />
26-32-9 Silnoprúdová elektrotechnika<br />
Ing. Pavol RAFAJDUS<br />
prof. Ing. Valéria Hrabovcová, PhD.<br />
Žili<strong>na</strong> 2002<br />
Názov doktorandskej<br />
dizertačnej práce: Stratégia rozvoja ľudského potenciálu v ma<strong>na</strong>žmente moderného podniku<br />
Autor:<br />
Ing. Josef Vodák<br />
Vedný odbor: 62-90-9 podnikový ma<strong>na</strong>žment<br />
Školiace pracovisko: Strojnícka fakulta Žilinskej univerzity<br />
Školiteľ:<br />
Prof. dr. hab. Inž. Józef Matuszek, KIP Politechnika Bielsko Biala<br />
Dizertačná práca obsahuje myšlienku zdoko<strong>na</strong>lenia prepojenia stratégie podniku s rozvojom<br />
jeho ľudských zdrojov pri využití metodiky Balanced Scorecard. Tento nový prístup umožní zvýšiť<br />
efektívnosť dosahovania podnikových cieľov a je podporený a<strong>na</strong>lyzovaním výkonnostných problémov<br />
a je vyjadrený návrhom modelu rozvoja ľudského potenciálu. Predkladaný návrh vychádza z a<strong>na</strong>lýzy<br />
súčasného stavu a metód práce s rozvojom ľudských zdrojov v podnikoch. Základné východiská sú<br />
členené do častí podnik, ma<strong>na</strong>žment, stratégia, implementácia stratégie a ľudské zdroje. Navrhovaná<br />
metodika je podporovaná aj využitím prístupov multivariantnej a<strong>na</strong>lýzy.<br />
V práci je <strong>na</strong>vrhnutý nový prístup pre zdoko<strong>na</strong>lenie prepojenia stratégie podniku s rozvojom ľudských<br />
zdrojov, ako jeho <strong>na</strong>jvýz<strong>na</strong>mnejším aktívom s cieľom zvýšiť efektívnosť dosahovania podnikových<br />
cieľov pomocou rozvoja ľudského potenciálu. Tento prístup je vyjadrený návrhom modelu. Práca<br />
rozpracováva a formuluje základné východiská a postupy pre uplatnenie nového prístupu k rozvoju<br />
ľudského potenciálu pomocou <strong>na</strong>vrhnutého modelu a prispieva svojím prístupom k rozšíreniu palety<br />
použiteľných postupov a metód. Práca prináša aj nový prístup k vyhodnocovaniu rozvojových tréningových<br />
projektov pomocou predloženej 7-krokovej metódy, v práci je prezentovaná aj možnosť využitia<br />
prístupov multivariantnej a<strong>na</strong>lýzy ako vhodného matematického aparátu pre objektivizáciu vyhodnocovania<br />
rozvojových programov.<br />
Výhodou použitia <strong>na</strong>vrhovaného modelu pre podnik je vyššie zacielenie rozvojových vzdelávacích<br />
programov pri <strong>na</strong>pĺňaní jeho stratégie, možnosť lepšie vyhodnocovať vy<strong>na</strong>ložené prostriedky do rozvoja<br />
ľudí, a tým zvýšiť efektívnosť a návratnosť investícií do rozvoja ľudských zdrojov.<br />
Navrhovaný model umožňuje preukázateľne skvalitniť podnikanie a priniesť majiteľom a ma<strong>na</strong>žmentu<br />
fi<strong>na</strong>nčný efekt oveľa efektívnejšie ako doterajšie prístupy.<br />
Autor:<br />
Školiteľ:<br />
ŽILINSKÁ UNIVERZITA V ŽILINE<br />
Strojnícka fakulta<br />
Kandidátska dizertačná práca<br />
STRATÉGIA ROZVOJA ĽUDSKÉHO<br />
POTENCIÁLU V MANAŽMENTE<br />
MODERNÉHO PODNIKU<br />
Vedný obor:<br />
62-90-9 Podnikový ma<strong>na</strong>žment<br />
Ing. Josef Vodák<br />
Prof. dr. hab. Inž. Józef Matuszek<br />
Žili<strong>na</strong> 2002<br />
KOMUNIKÁCIE / COMMUNICATIONS 1/2003 ●<br />
85
C O M M U N I C A T I O N S<br />
I S<br />
POKYNY PRE AUTOROV PRÍSPEVKOV DO ČASOPISU<br />
KOMUNIKÁCIE – vedecké listy Žilinskej univerzity<br />
1. Redakcia prijíma iba príspevky doteraz nepublikované alebo inde nezaslané <strong>na</strong> uverejnenie.<br />
2. Rukopis musí byť v jazyku anglickom (týka sa autorov zo Slovenska). Príspevok by nemal<br />
prekročiť 7 strán (formát A4, písmo Times Roman 12 bodové). K článku dodá autor<br />
resumé v rozsahu maximálne 10 riadkov anglickom jazyku).<br />
3. Príspevok prosíme poslať: e-mailom, ako prílohu spracovanú vo Word-e, <strong>na</strong> adresu holesa@<br />
nic.utc.sk alebo poled<strong>na</strong>k@fsi.utc.sk príp. vrablova@nic.utc.sk alebo doručiť <strong>na</strong> diskete 3,5 vo<br />
Word-e a jeden výtlačok článku <strong>na</strong> adresu Žilinská <strong>univerzita</strong>, OVaV, Moyzesova 20, 010 26<br />
Žili<strong>na</strong>.<br />
4. Skratky, ktoré nie sú bežné, je nutné pri ich prvom použití rozpísať v plnom znení.<br />
5. Obrázky, grafy a schémy, pokiaľ nie sú spracované v Microsoft WORD, je potrebné<br />
doručiť buď v digitálnej forme (ako GIF, JPG, CDR, BMP súbory), prípadne <strong>na</strong>kresliť<br />
kontrastne <strong>na</strong> bielom papieri a predložiť v jednom exemplári. Pri požiadavke <strong>na</strong> uverejnenie<br />
fotografie priložiť ako podklad kontrastnú fotografiu alebo diapozitív.<br />
6. Odvolania <strong>na</strong> literatúru sa oz<strong>na</strong>čujú v texte alebo v poznámkach pod čiarou príslušným<br />
poradovým číslom v hra<strong>na</strong>tej zátvorke. Zoz<strong>na</strong>m použitej literatúry je uvedený za príspevkom.<br />
Citovanie literatúry musí byť podľa záväznej STN 01 0197 (ISO 690) „Bibliografické<br />
odkazy“.<br />
7. K rukopisu treba pripojiť plné meno a priezvisko autora a adresu inštitúcie v ktorej pracuje,<br />
e-mail adresu a číslo telefónu alebo faxu.<br />
8. Príspevok posúdi redakčná rada <strong>na</strong> svojom <strong>na</strong>jbližšom zasadnutí a v prípade jeho zaradenia<br />
do niektorého z budúcich čísiel podrobí rukopis recenziám a jazykovej korektúre. Pred<br />
tlačou bude poslaný autorovi <strong>na</strong> definitívnu kontrolu.<br />
9. Termíny <strong>na</strong> dodanie príspevkov do čísiel v roku sú: 30. september, 31. december, 31. marec<br />
a 30. jún.<br />
10. V roku 2003 budú tieto nosné témy jednotlivých čísiel: Komunikácia fyziky a technickými<br />
vedami, Informatika a riadenie.<br />
COMMUNICATIONS – Scientific Letters of the University of Žili<strong>na</strong><br />
Writer’s Guidelines<br />
l. Submissions for publication must be unpublished and not be a multiple submission.<br />
2. Manuscripts written in English language must include abstract also written in English. The<br />
submission should not exceed 7 pages (format A4, Times Roman size 12). The abstract<br />
should not exceed 10 lines.<br />
3. Submissions should be sent: by e-mail (as attachment in system Microsoft WORD) to one<br />
of the following addresses: holesa@nic.utc.sk or vrablova@nic.utc.sk or poled<strong>na</strong>k@fsi.utc.sk<br />
with a hard copy (to be assessed by the editorial board) or on a 3.5“ diskette in (Microsoft<br />
WORD) with a hard copy to the following address: Zilinska <strong>univerzita</strong>, OVaV, Moyzesova<br />
20, SK-10 26 Zili<strong>na</strong>, Slovakia.<br />
4. Abbreviations, which are not common, must be used in full when mentioned for the first<br />
time.<br />
5. Figures, graphs and diagrams, if not processed by Microsoft WORD, must be sent in electronic<br />
form (as GIF, JPG, CDR, BMP files) or drawn in contrast on white paper, one copy<br />
enclosed. Photographs for publication must be either contrastive or on a slide.<br />
6. References are to be marked either in the text or as footnotes numbered respectively.<br />
Numbers must be in square brackets. The list of references should follow the paper (according<br />
to ISO 690).<br />
7. The author’s exact mailing address, full <strong>na</strong>mes, e-mail address, telephone or fax number, and<br />
the address of the organisation where the author works and contact information must be enclosed.<br />
8. The editorial board will assess the submission in its following session. In the case that the<br />
article is accepted for future volumes, the board submits the manuscript to the editors for<br />
review and language correction. After reviewing and incorporating the editor’s remarks, the<br />
fi<strong>na</strong>l draft (before printing) will be sent to authors for fi<strong>na</strong>l review and adjustment.<br />
9. The deadlines for submissions are as follows: September 30, December 31, March 31 and<br />
Juny 30.<br />
10. In the year 2003 each issue will be dedicated to one of the following topics: Communication<br />
of Physics with Technical Sciences, Information and Ma<strong>na</strong>gement Sciences.<br />
C O M M U N I C A T I O N S<br />
I S<br />
VEDECKÉ LISTY ŽILINSKEJ UNIVERZITY<br />
SCIENTIFIC LETTERS OF THE UNIVERSITY OF ŽILINA<br />
Šéfredaktor – Editor-in-chief:<br />
Prof. Ing. Pavel Poledňák, PhD.<br />
Redakčná rada – Editorial board:<br />
Prof. Ing. Ján Bujňák, CSc. – SK<br />
Prof. Ing. Karol Blunár, DrSc. – SK<br />
Prof. Ing. Otakar Bokůvka, CSc. – SK<br />
Prof. RNDr. Peter Bury, CSc. – SK<br />
Prof. RNDr. Jan Černý, DrSc. – CZ<br />
Prof. Ing. Ján Čorej, CSc. – SK<br />
Prof. Eduard I. Danilenko, DrSc. – UKR<br />
Prof. Ing. Branislav Dobrucký, CSc. – SK<br />
Prof. Dr. Stephen Dodds – UK<br />
Dr. Robert E. Caves – UK<br />
Dr.hab Inž. Stefania Grzeszczyk, prof. PO – PL<br />
PhDr. An<strong>na</strong> Hlavňová, CSc. – SK<br />
Prof. Ing. Vladimír Hlavňa, PhD. – SK<br />
Prof. RNDr. Jaroslav Janáček, CSc. – SK<br />
Dr. Ing. Helmut König, Dr.h.c. – CH<br />
Prof. Ing. Gianni Nicoletto – I<br />
Prof. Ing. Ľudovít Parilák, CSc. – SK<br />
Ing. Miroslav Pfliegel, CSc. – SK<br />
Prof. Ing. Pavel Poledňák, PhD. – SK<br />
Prof. Bruno Salgues – F<br />
Prof. Andreas Steimel – D<br />
Prof. Ing. Miroslav Steiner, DrSc. – CZ<br />
Prof. Ing. Pavel Surovec, CSc. – SK<br />
Prof. Ing. Hynek Šertler, DrSc. – CZ<br />
Prof. Josu Takala – SU<br />
Prof. Dr. Zygmund Szlachta – PL<br />
Prof. Ing. Hermann Knoflacher – A<br />
Adresa redakcie:<br />
Address of the editorial office:<br />
Žilinská <strong>univerzita</strong><br />
Oddelenie pre vedu a výskum<br />
Office for Science and Research<br />
Moyzesova 20, Slovakia<br />
SK 010 26 Žili<strong>na</strong><br />
Tel.: +421/41/5620 392<br />
Fax: +421/41/7247 702<br />
E-mail: poled<strong>na</strong>k@fsi.utc.sk, holesa@nic.utc.sk<br />
Každý článok bol oponovaný dvoma oponentmi.<br />
Each paper was reviewed by two reviewers.<br />
Časopis je excerpovaný v Compendexe<br />
Jour<strong>na</strong>l is excerpted in Compendex<br />
Vydáva Žilinská <strong>univerzita</strong><br />
v EDIS - vydavateľstve ŽU<br />
J. M. Hurba<strong>na</strong> 15, 010 26 Žili<strong>na</strong><br />
pod registračným číslom 1989/98<br />
ISSN 1335-4205<br />
It is published by the University of Žili<strong>na</strong> in<br />
EDIS - Publishing Institution of Žili<strong>na</strong> University<br />
Registered No: 1989/98<br />
ISSN 1335-4205<br />
Objednávky <strong>na</strong> predplatné prijíma redakcia<br />
Vychádza štvrťročne<br />
Ročné predplatné <strong>na</strong> rok 2002 je 500,- Sk<br />
Order forms should be returned to the editorial office<br />
Published quarterly<br />
The subscription rate for year 2002 is 500 SKK.<br />
Jednotlivé čísla časopisu sú uverejnené tiež <strong>na</strong>:<br />
Single issues of the jour<strong>na</strong>l can be found on:<br />
http://www.utc.sk/komunikacie<br />
86 ● KOMUNIKÁCIE / COMMUNICATIONS 1/2003