Download Report - San Francisco Municipal Transportation Agency
Download Report - San Francisco Municipal Transportation Agency
Download Report - San Francisco Municipal Transportation Agency

Create successful ePaper yourself
Turn your PDF publications into a flip-book with our unique Google optimized e-Paper software.
SFMTA<br />
Bicycle Strategy<br />
April 2013<br />
S<br />
p
TABLE OF CONTENTS<br />
Message from Ed Reiskin, Director of <strong>Transportation</strong> 2<br />
SFMTA Strategic Plan Vision and Goals 3<br />
Introduction & Overview 4<br />
<br />
Encouraging Mode Shifts 7<br />
Needs Assessment 9<br />
Connectivity, Safety, and Convenience 11<br />
Comfort and Connectivity Analysis 16<br />
<br />
<br />
Implementation Strategy 22<br />
Strategic Approach 22<br />
Funding and Prioritization 23<br />
Strategic Goals & Objectives 25<br />
Next Steps 32<br />
Message from Ed Reiskin, Director of <strong>Transportation</strong><br />
<strong>San</strong> <strong>Francisco</strong> is at a transportation crossroads. The SFMTA's new Strategic Plan<br />
makes key policy decisions about how the City will meet current and future demands<br />
on its transportation network. Over the next decade, the city will change in ways that<br />
<br />
usual will not take advantage of the new opportunities presented by these changes.<br />
Enacting our vision of a people-centered city that prioritizes walking, bicycling,<br />
transit and less driving will ensure our residents and visitors continue to meet their<br />
transportation needs by enhancing connections among neighborhoods, jobs and social<br />
activities.<br />
<br />
<br />
<br />
investments to reach quality of life goals.<br />
While this document sets the stage for success, the SFMTA cannot do it alone. We need the partnership<br />
of other members of the City family, businesses, neighbors and policy makers to achieve our vision. Now<br />
is the time to make our city a leader among global cities in excellent transportation choices. Now is<br />
the time to make bicycling a part of everyday life in <strong>San</strong> <strong>Francisco</strong>.<br />
Page 2
SFMTA's Strategic Plan Vision<br />
<strong>San</strong> <strong>Francisco</strong>: great city, excellent transportation choices.<br />
<br />
<br />
<br />
<br />
Strategic Plan Goal 1: Create a safer<br />
transportation experience for everyone<br />
Strategic Plan Goal 2: Make transit, walking,<br />
bicycling, taxi, ridesharing, and car sharing the<br />
preferred means of travel.<br />
Strategic Plan Goal 3: Improve the environment<br />
and quality of life in <strong>San</strong> <strong>Francisco</strong><br />
Objective 1.3: Improve the safety of the<br />
transportation system.<br />
Objective 2.1: Improve customer service and<br />
communications.<br />
Objective 2.2: Increase use of all non-private auto<br />
modes.<br />
Objective 3.2:<br />
positive impact to the economy.<br />
Objective 3.3: Allocate capital resources effectively<br />
<br />
everyday life in <strong>San</strong> <strong>Francisco</strong>. The key actions are designed to meet the SFMTA 2013-2018 Strategic Plan mode<br />
share goal: 50 percent of all trips made using sustainable modes (walking, bicycle, public transit, and vehicle<br />
sharing).<br />
<br />
estimates that half of this shift can be accommodated by the bicycle mode within this time frame, resulting in a<br />
citywide bicycle mode share of 8 to 10 percent by 2018 - 2020. This results in more than a doubling of today's<br />
bicycle mode share of 3.5 percent.<br />
2010 Mode Split 2018 Mode Split Potential<br />
The mode shares of transit,<br />
walking, and bicycling will<br />
grow substantially between<br />
now and 2018.<br />
Because the overall number<br />
of trips will increase, vehicle<br />
sharing (taxis, carsharing,<br />
and ridesharing) will grow<br />
in absolute numbers, but<br />
will likely maintain its one<br />
percent mode share of trips<br />
within the city.<br />
2013-2018 Bicycle Strategy Process<br />
Page 3
Bicycling in <strong>San</strong> <strong>Francisco</strong><br />
10 YEARS OF CONTINUING PROGRESS<br />
71%<br />
GOLD<br />
# 3<br />
SAFE<br />
<br />
previous decade to 3.4 percent of all trips.<br />
<br />
Communities” in the U.S., as designated by the League of<br />
<br />
<br />
Third highest in bicycling and walking levels (out of 51)<br />
Fourth highest in bicycle commute rate (out of 51)<br />
Sixth safest for riding bicycles (out of 51)<br />
Eighth lowest in walk / bicycle fatality rates (out of 51)<br />
2011 Bicycle Counts<br />
1400<br />
20<br />
JFK<br />
10<br />
Since 2008, the SFMTA has<br />
Installed 1400 additional bicycle racks on sidewalks and in<br />
bicycle corrals, for a total of nearly 8800 racks citywide<br />
Installed 20 miles of bicycle lanes and designated 41 miles of<br />
shared use paths, for a citywide network of 215 total miles.<br />
<br />
with the Recreation and Parks Department<br />
Expanded the Sunday Streets program to ten annual events<br />
Incorporated temporary bicycle treatments into special event<br />
<br />
BIG CHANGES NEEDED IN THE NEXT 10 YEARS<br />
Bicycle trips are 3.5 percent of all trips taken<br />
in the city. The average trip length is 2.5<br />
miles, which is similar to auto trips in the city.<br />
2/3<br />
Although seventeen percent of <strong>San</strong> <strong>Francisco</strong> residents take at least one trip per week by bicycle, two-thirds of<br />
<strong>San</strong> Franciscans (66 percent) never use a bicycle at all.<br />
Instances of bicycle crashes are rising, although the rise is proportional to the increase in bicycle activity across<br />
the city.<br />
10%<br />
Ten percent (20 miles) of the 215 mile bicycle network has buffered bicycle lanes, and cycle tracks that meet most<br />
people's level of comfort.<br />
The SFMTA has installed three bicycle signals, but is targeting another 200 signalized intersections for bicycle<br />
signals and bicycle boxes.<br />
P<br />
<br />
<br />
Only 15 out of 150 public schools in the city receive bicycle safety education.<br />
The bicycle network is fragmented and not legible to all current and potential users.<br />
250%<br />
<br />
Page 4
How does <strong>San</strong> <strong>Francisco</strong> compare<br />
<strong>San</strong> <strong>Francisco</strong><br />
Pop: 805K, Density: 17K / sqmi<br />
Regional pop: 4.3M<br />
<br />
<br />
<br />
Average gas price: $4 / gal<br />
<br />
Amsterdam<br />
Pop: 820K, Density: 9K / sqmi<br />
Regional pop: 2.3M<br />
<br />
<br />
<br />
Average gas price: $9.50 / gal<br />
Auto parking: Limited in city center<br />
Copenhagen<br />
Pop: 552K, Density: 16K / sqmi<br />
Regional pop: 1.9M<br />
<br />
2010)<br />
<br />
<br />
Average gas price: $9 / gal<br />
Copenhagen<br />
Vancouver BC<br />
Portland<br />
<strong>San</strong> <strong>Francisco</strong><br />
Montreal<br />
Amsterdam<br />
Paris<br />
Berlin<br />
Munich<br />
Beijing<br />
Wuhan<br />
Bogotà<br />
Melbourne<br />
Munich<br />
Pop: 1.4M, Density: 11.5K / sqmi<br />
Regional pop: 2.6M<br />
<br />
<br />
<br />
Average gas price: $7.75 / gal<br />
Bogotá<br />
Pop: 7.4M, Density: 12K / sqmi<br />
Regional pop: 10.1M<br />
<br />
<br />
<br />
Average gas price: $6 / gal<br />
Car free zones, parking restricted<br />
Berlin<br />
Pop: 3.5M, Density: 10K / sqmi<br />
Regional pop: 6M<br />
<br />
<br />
<br />
Average gas price: $7.75 / gal<br />
<br />
Melbourne<br />
Pop: 98K, Density: 16K / sqmi<br />
Regional pop: 4.2M<br />
<br />
<br />
<br />
Average gas price: $6 / gal<br />
<br />
Portland OR<br />
Pop: 594K, Density: 1.7K / sqmi<br />
Regional pop: 2.3M<br />
<br />
2008)<br />
<br />
<br />
Average gas price: $4 / gal<br />
Vancouver BC<br />
Pop: 603K, Density: 13.5K / sqmi<br />
Regional pop: 2.3M<br />
<br />
<br />
<br />
Average gas price: $6 / gal<br />
<br />
Source: Journeys. Nov. 2011.<br />
Passenger Transport Modes in World Cities.<br />
Page 5
Starter, Climber, and Champion<br />
Cities<br />
Moving from Starter to Climber by 2018<br />
The EU's PRESTO (Promoting Cycling for<br />
Everyone as a Daily Transport Mode) project<br />
<br />
Champions based on their degree of bicycling<br />
development. <strong>San</strong> <strong>Francisco</strong> is a Starter city<br />
based on the two primary indicators: bicycling<br />
conditions and bicycle mode share.<br />
<br />
characteristics to become a Climber city<br />
<br />
an urban density similar to Amsterdam,<br />
<br />
and Copenhagen's bicycle networks have<br />
the same order magnitude of mileage as <strong>San</strong><br />
<strong>Francisco</strong> (~200+ miles). These cities also<br />
have other outside factors that affect bicycle<br />
activity, primarily higher automobile ownership<br />
fees, gasoline prices, and parking pricing.<br />
Derived from: Presto Cycling Policy Guide.<br />
If <strong>San</strong> <strong>Francisco</strong> moves in the same direction<br />
with our overall transportation policy and<br />
continues improving the bicycle network, it<br />
is reasonable to see <strong>San</strong> <strong>Francisco</strong> with an<br />
8 to 10 percent bicycle mode share by 2018.<br />
Maintaining this trajectory for the next 15 to 20<br />
years will allow <strong>San</strong> <strong>Francisco</strong> to eventually<br />
become a Champion city.<br />
Sequencing our efforts<br />
PRESTO provides guidance on how to<br />
sequence bicycle improvements and<br />
programs, based on outstanding need.<br />
<br />
PRESTO suggests focusing efforts on<br />
improving infrastructure, with an emphasis on<br />
creating and improving safe and direct routes.<br />
As the city transitions into a Climber city, our<br />
bicycle efforts will likely transition towards<br />
additional promotion efforts, network<br />
aesthetics, and network coherency.<br />
Source: Presto Cycling Policy Guide.<br />
Page 6
Encouraging Mode Shifts<br />
Key decision factors for people shifting modes<br />
Decision Factor<br />
Auto to Transit<br />
Increasing congestion & cost;<br />
vulnerability to crashes<br />
Transit to Bicycles<br />
Crowded & unreliable,<br />
especially in the peak hour of<br />
service<br />
Encouragement<br />
Auto to Transit<br />
Improving reliability & reducing<br />
crowding makes transit more<br />
attractive<br />
Transit to Bicycles<br />
Improving comfort &<br />
convenience of bicycling<br />
infrastructure creates more<br />
bicycling demand<br />
Virtuous Cycle begins<br />
Freed capacity on transit<br />
attracts new riders<br />
Shift of peak period transit<br />
riders to bicycling provides<br />
space on transit<br />
Continuing the virtuous cycle of Complete Streets integration<br />
Action<br />
Investment in parking and<br />
demand management<br />
Investment in transit<br />
improvements, reliability,<br />
and convenience<br />
Investment in bicycling<br />
infrastructure, facilities &<br />
support programs<br />
Investment in walking<br />
infrastructure, facilities, and<br />
support programs<br />
Effect<br />
Taxis and rideshare demand increases.<br />
People shifting from transit to bicycles create more room on<br />
peak transit for new riders, improving transit performance.<br />
Greater numbers of people on bicycles increases overall air<br />
quality, public health, and economic activity.<br />
Greater numbers of people travelling by transit and bicycles<br />
leads to greater numbers of people walking, improving<br />
overall quality of life and economy.<br />
"Business as usual" or<br />
a "siloed" investment<br />
approach, is limiting<br />
our transportation<br />
system's potential to<br />
meet the city's needs.<br />
If we integrate<br />
investments, the<br />
city will see reduced<br />
<br />
crashes, congestion<br />
and pedestrian and<br />
bicyclist injuries.<br />
Implications of “business as usual” fragmented investments<br />
Continued investment<br />
focused on driving<br />
facilities.<br />
Underinvestment in<br />
walking<br />
More<br />
on streets<br />
users<br />
choose<br />
to drive<br />
More<br />
Collisions<br />
users choose to drive<br />
users choose to walk<br />
Crowded<br />
System<br />
Less<br />
Comfortable<br />
Separate investments<br />
for transit. Lost<br />
opportunity for<br />
complete streets<br />
projects<br />
Underinvestment in<br />
bicycling<br />
Page 7
Bicycling in Context<br />
<br />
sustainable modes. It is the most convenient, affordable, quickest, and healthiest way to make the average trip within the<br />
city (2 to 3 miles).<br />
1. Bicycling is an affordable and convenient transportation option for those who rely on sustainable modes.<br />
With low initial cost and negligible operating costs, bicycling is substantially cheaper than driving.<br />
<br />
with disabilities.<br />
2. More connected neighborhoods, safer street intersections and quieter neighborhood circulation.<br />
<br />
People on bicycles establish a personal presence, creating safer neighborhoods by adding eyes on the street.<br />
3. Transit and bicycling create multiple synergies that increase public transit's performance<br />
<br />
Transit operates better when short peak trips are diverted to the bicycle.<br />
Transit complements bicycling for long trips outside the bicycle's comfortable range.<br />
<br />
4. Improved air quality and public health.<br />
<br />
<br />
<br />
and ambient noise.<br />
<br />
fun way to travel, bicycling can reduce personal stress and improve mood.<br />
Page 8
Needs Assessment<br />
Methodology<br />
As presented in the previous sections, there is a compelling case for improving bicycle conditions throughout the city. The<br />
<br />
The following Needs Assessment summarizes the following background data:<br />
<br />
Citywide bicycle travel patterns based on trip origins and destinations, and topography<br />
<br />
<br />
<br />
<br />
The Needs Assessment concludes by presenting a new methodology for assessing the bicycle comfort of individual<br />
facilities across the city, and the connectivity of the bicycle network based on comfort level.<br />
The sections after the Needs Assessment include:<br />
<br />
<br />
A summary of existing funding sources and the funding gaps for each improvement package<br />
A methodology for project prioritization<br />
<br />
Stakeholder workshops<br />
Next steps and schedule for implementation<br />
Page 9
Needs Assessment<br />
Accommodating Bicycle Growth in the Core<br />
<br />
Area" have a 7 percent bicycle mode share. The Western<br />
Addition and Mission neighborhoods have bicycle mode<br />
shares now approaching or exceeding 10 percent. Other<br />
<br />
<br />
in bicycle mode share and will likely reach 10 percent in<br />
the next 6 years.<br />
Bicycle Commute Mode Share (2010)<br />
<br />
<br />
rapid change in bicycle rates is likely due to changing<br />
demographics and improvements to the bicycle network.<br />
The area demographics, land use, and density are<br />
prime for further bicycle activity. The existing bicycle<br />
infrastructure and support facilities in these neighborhoods<br />
are already highly utilized.<br />
Improving the quality and density of the<br />
system will be critical for fostering further bicycle activity in<br />
this “core” bicycle area, which could push the bicycle mode<br />
share in these key areas to 20 percent.<br />
Projected City Bicycle Mode Share<br />
Destination Land Uses<br />
Page 10
Needs Assessment<br />
Connecting to Neighborhoods Together<br />
<br />
bicycle area generally follow several patterns:<br />
Topography and Bicycle Travel Patterns<br />
<br />
<br />
<br />
Travel along the city periphery<br />
Travel to / from the city core<br />
Travel within the neighborhood<br />
Peripheral Connections<br />
The availability of a bicycle facility determines the preferred<br />
path for trips around the city periphery. The Embarcadero<br />
<br />
recreational riders traveling to / from the Golden Gate<br />
<br />
Fragmented, uncomfortable, and poorly<br />
<br />
Crosstown Connections<br />
Topography plays a large role in determining the preferred<br />
path for trips to / from the city core. East-west trips<br />
generally follow Golden Gate Park - the Panhandle -<br />
The Wiggle - Market Street. North-south trips to / from<br />
<br />
Avenue - Valencia Street - Polk Street. These Crosstown<br />
<br />
but may have areas where the facilities are inadequate or<br />
unsafe.<br />
Network gaps, areas with drops in rider<br />
<br />
facilities that emphasize an identity of a "core" route.<br />
Citywide Bicycle Network Framework<br />
Neighborhood Connections<br />
The density and quality of bicycle facilities determines<br />
the preferred path for bicycle trips within and between<br />
neighborhoods. Network coverage varies across the city,<br />
with dense coverage in the city core and sparse coverage<br />
in the city periphery.<br />
Facilities in the city core that emphasize<br />
<br />
<br />
network for most users.<br />
Page 11
Needs Assessment<br />
Improving Bicycle Safety<br />
The number of people bicycling has increased<br />
<br />
collision rate has remained constant. Collisions between<br />
people in automobiles and people bicycling represent<br />
the far majority of severe injuries and fatalities.<br />
Bicycle Crashes and Activity (2006-2011)<br />
People who engage in unsafe bicycle riding behaviors,<br />
such as sidewalk bicycle riding and wrong-way bicycle<br />
riding, remain a minority of overall users (less than four<br />
percent). Anecdotally, many of these behaviors take<br />
place on roadways that typically lack bicycle facilities.<br />
Among reported crashes, most occur in the Core<br />
Area, which has the highest amount of bicycle activity.<br />
<br />
the Outer Neighborhoods with a concentration of highseverity<br />
crashes.<br />
Core Area crashes<br />
<br />
<br />
locations with a higher-than-average occurrence of<br />
crashes.<br />
Bicycle Crash Distribution<br />
<br />
<br />
treatments at crash-prone areas that emphasize bicycle<br />
<br />
crash-prone areas.<br />
Outer Neighborhood crashes<br />
<br />
occur at major intersections on high-speed, multi-lane<br />
arterial streets.<br />
Safety measures at crash-prone<br />
<br />
<br />
crash-prone areas.<br />
Page 12
Needs Assessment<br />
Providing Safe and Convenient Bicycle Parking<br />
Much like automobiles, traveling by bicycle requires<br />
secure storage facilities at each trip end. Inadequate<br />
bicycle parking is a two-prong problem:<br />
Core Area Bicycle Parking<br />
<br />
<br />
Inadequate parking can create problems with theft,<br />
which discourages bicycling.<br />
Inadequate parking in areas with high bicycle activity<br />
can create sidewalk clutter.<br />
Core Area bicycle parking<br />
The city continues to install bicycle parking in the core<br />
areas of Downtown, SoMa, and the Mission. Even with<br />
the dense parking coverage, demand for bicycle parking<br />
continues to rise. The city is working to consolidate some<br />
bicycle parking into “bicycle corrals”, which replace a<br />
<br />
Denser bicycle parking in the Core<br />
Area additional bicycle parking where demand is<br />
approaching or exceeding capacity. Innovative use<br />
of existing auto parking, including bicycle corrals in<br />
curbside spaces, and “bicycle cages” in city-owned<br />
parking garages and surface lots. Parking that can<br />
accommodate diverse bicycle designs (e.g. cargo<br />
bicycles, recumbent bicycles, and tricycles).<br />
Outer Neighborhood bicycle parking<br />
<br />
between corridors. For instance, Ocean Avenue near<br />
<br />
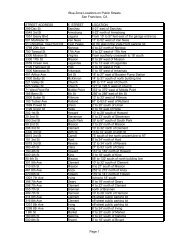
Conversely, bicycle racks occur on Mission Street south<br />
of Interstate 280 every two-to-three blocks.<br />
Outer Neighborhood Bicycle Parking<br />
At minimum, there should be one bicycle rack per block<br />
on commercial corridors. This is necessary to establish<br />
a reasonable expectation for bicycle parking at most trip<br />
destinations.<br />
Minimum bicycle parking coverage<br />
of one rack per block on all corridors containing<br />
neighborhood commercial uses. Parking at high-demand<br />
bicycle destinations, such as hospitals, libraries, and<br />
schools.<br />
Page 13
Needs Assessment<br />
Accommodating Transit and Walk Trips<br />
<strong>San</strong> <strong>Francisco</strong> has an extensive public transit system<br />
that includes buses, streetcars, light rail, subway,<br />
<br />
system regularly exceeds its capacity during peak<br />
periods. The bicycle is a low-cost and rapid way to<br />
overcome some of the demands on public transit for<br />
both regional and local transit trips.<br />
Secure Bicycle Parking and Transit Hubs<br />
Providing secure bicycle parking at the transit hub<br />
Reduces the demand on connecting local transit<br />
Reduces the demand for people taking their bicycles<br />
onto transit<br />
Providing bicycle sharing<br />
Reduces the demand on local transit for short trips<br />
<br />
during system outages<br />
Regional transit trips: Secure bicycle parking<br />
People that park for extended periods need bicycle<br />
parking sheltered from the environments and from<br />
criminal elements. The city has attended bicycle parking<br />
at the 4th / King Caltrain station and at UCSF, and<br />
<br />
<br />
stations without secure bicycle parking facilities.<br />
Attended and unattended secure<br />
bicycle parking at regional transit hubs, including the<br />
<br />
stations, and major Muni Metro stations.<br />
Bicycle Sharing Coverage Area<br />
Local transit trips: Bicycle sharing<br />
The city expects to deploy the 500 bicycle / 50<br />
station bicycle sharing pilot in 2013. The pilot area<br />
encompasses 1.8 square miles in the city core.<br />
Phase 2 of the bicycle sharing system will deploy 2750<br />
bicycles across 275 stations. Time for implementation<br />
will depend on the success of the pilot project and<br />
funding.<br />
Implement the bicycle sharing system<br />
and study opportunities for greater coverage in outlying<br />
areas and new development areas.<br />
Page 14
Needs Assessment<br />
Growing Our Bicycle Culture<br />
Among people who do not bicycle surveyed as part of<br />
the 2012 State of Cycling study, 20 percent indicated<br />
that the barriers they have to bicycling could be<br />
overcome with social, educational and resource-based<br />
efforts, including:<br />
Bike to Work Day<br />
<br />
<br />
<br />
Finding people to bicycle with<br />
Finding affordable/ discounted bicycles<br />
Learning the rules of the road<br />
Schools: Youth bicycle education<br />
<br />
<br />
at 15 out of the more than 100 elementary / K-8,<br />
secondary, and high schools in the city.<br />
Student bicycle education at city public<br />
and private schools.<br />
Neighborhoods: Bicycle and driver education for<br />
adults<br />
There are few avenues for adults to receive bicycle<br />
education, outreach, and basic maintenance.<br />
Overcoming these basic barriers to entry could greatly<br />
increase bicycling rates in areas of need.<br />
<strong>San</strong> <strong>Francisco</strong>'s Bicycle Demographic<br />
Regular adult bicycle and bicyclefocused<br />
driver education across the city and as part<br />
of new facility openings. Target outreach to vulnerable<br />
users, including low-income communities, the disabled<br />
community, and seniors. Expanded Sunday Streets and<br />
<br />
educate employees about bicycling.<br />
Citywide programming: Marketing<br />
<br />
of bicycling within the city by establishing a common<br />
understanding for considerate behavior. Fostering <strong>San</strong><br />
<br />
<br />
<br />
<br />
<br />
individual businesses to market <strong>San</strong> <strong>Francisco</strong> as<br />
a bicycle-friendly city. Incentives for riding bicycles,<br />
including bike-to-work/school competitions and Thank<br />
<br />
Excluding people that ride bicycles as their primary mode, nearly a<br />
third (29 percent) of <strong>San</strong> Franciscans already bicycle occasionally<br />
and could be encouraged to bicycle more frequently. Another twothirds<br />
do not bicycle at all; support programs could convince them<br />
to start.<br />
Page 15
Needs Assessment<br />
Comfort Analysis<br />
Not all bicycle facilities are created equal.<br />
<br />
<br />
traditional hierarchy of Class I, II, and III bicycle facilities<br />
(paths, lanes, and routes). Within each category, the<br />
actual and perceived safety of any bicycle facility can vary<br />
widely based on various “stress factors”. These include<br />
<br />
and intersection conditions.<br />
Recognizing the shortcomings of the Class I / II / III<br />
categories, the Mineta <strong>Transportation</strong> Institute (MTI)<br />
proposed a new methodology to classify road segments on<br />
<br />
<br />
within <strong>San</strong> <strong>Francisco</strong>.<br />
<br />
on roadways already designated as part of the 200 mile<br />
bicycle network.<br />
A new “Comfort Assessment”<br />
methodology, similar to LTS, which will determine the<br />
need for and type of upgrade. The methodology will<br />
further the city's ultimate goal to create a network that<br />
is comfortable for all users, particularly vulnerable user<br />
groups like youths, the disabled, seniors, and low-income<br />
communities.<br />
Page 16
Needs Assessment<br />
Connectivity Analysis<br />
Maintaining expectations of comfort and safety.<br />
Perhaps even more important than the comfort of any<br />
given facility is the consistency of that comfort through the<br />
network.<br />
<br />
short segment or at a single intersection, can become a<br />
deterrent from riding bicycles.<br />
<br />
A system-wide "Connectivity<br />
Assessment" to identify network gaps and intersection<br />
“hot spots”, and to recommend measures that will raise<br />
corridors to a consistent comfort level for most users.<br />
<br />
Golden Gate Park - Panhandle - Wiggle - Market Street<br />
corridor. The section from John F. Kennedy Drive to the<br />
Panhandle is between LTS 1 and 2, since much of that<br />
section is either on a physically separated path or adjacent<br />
<br />
<br />
EXAMPLE ASSESSMENT<br />
Page 17
Example Hotspot Treatment<br />
<br />
Market Street / Valencia Street - left turn improvements, November 2012<br />
Before<br />
After<br />
Image: SFMTA<br />
Image: SFMTA<br />
Before: <br />
Street turning left onto Valencia Street had to merge<br />
<br />
tracks in advance of the intersection.<br />
After: The SFMTA installed a bicycle signal and an<br />
innovative "bike bay" that allows people on bicycle to<br />
turn onto southbound Valencia Street via a protected<br />
crossing. This improvement closed a crucial gap in<br />
the bicycle network.<br />
Oak and Fell Street - bicycle lane upgrade to cycletrack, November 2012<br />
Before<br />
After<br />
Image: SFMTA<br />
Image: Flickr / sfbike<br />
Before: The Fell Street bicycle lane between Scott<br />
<br />
including frequent lane blockages and proximity to<br />
<br />
After: <br />
Oak and Fell Safety Project, using buffered bicycle<br />
lanes, green pavement, and bike boxes to make this<br />
critical east-west connection a more comfortable<br />
place for people on bicycles.<br />
Page 18
Bicycle Infrastructure Toolkit<br />
<br />
facilities (e.g. parking and bicycle sharing), and different programs to keep the<br />
momentum going. The following toolkit shows the different types of treatments to be used<br />
based on the key purpose and desired outcome. Costs and timelines vary depending<br />
on the tool used. This toolkit will help guide the conversation on needs assessment to<br />
<br />
KEY PURPOSE/OUTCOME<br />
<br />
<br />
Tools<br />
SAFETY<br />
CONNECTIVITY<br />
CONVENIENCE<br />
SECURITY<br />
COST*<br />
per mile or<br />
intersection<br />
TIME**<br />
to implement<br />
Network Treatments<br />
$ Very short<br />
$ Very short<br />
Bicycle boxes $ Short<br />
Bicycle signal, bicycle boxes,<br />
<br />
$ $ <br />
$x5 <br />
Basic cycle track $x6 Long<br />
$x7 Long<br />
$x8 Very long<br />
$x10 Very long<br />
Support Facility Treatments<br />
Bicycle corrals $ Short<br />
Bicycle lockers $ Short<br />
<br />
stations<br />
$x7 <br />
Bicycle sharing (per station) $x5 <br />
*Cost estimate scale increases approximately logarithmically. $ = $5k, $$ = $10K, $$$ = $25K, $x4 = $50K, $x5 = $100K, $x6 = $250K, $x7 = $500K,<br />
$x8 = $1M, $x9 = $5M, $x10 = $10M.<br />
** Estimates vary greatly depending on environmental clearance. Very short = ~1 year, Short = 1-2 years, Medium = 3-4 years, Long = 5-6 years,<br />
Very Long = 6+ years<br />
www.pedbikeimages.org / Adam Fukushima<br />
<br />
<br />
www.pedbikeimages.org / Laura <strong>San</strong>dt<br />
<br />
www.pedbikeimages.org / Stephen Foust<br />
Separated cycle track<br />
<br />
Colored bicycle lane<br />
<br />
www.pedbikeimages.org / Dan Burden<br />
Page 19
Support Program Toolkit<br />
KEY PURPOSE/OUTCOME<br />
Targeted rewards<br />
Tools<br />
EDUCATION<br />
ENCOURAGEMENT<br />
INNOVATION<br />
COST**<br />
per year<br />
Partnership<br />
Opportunity<br />
<br />
Existing Program (expanded)<br />
$$ <br />
$$<br />
$$$ <br />
Free bicycle network maps $x4<br />
$x7 <br />
$x7 <br />
New Program<br />
Regular encouragement<br />
$$$<br />
$x4 <br />
$x4 <br />
$x5 <br />
$x7 <br />
<br />
<br />
$$ <br />
$$ *<br />
$$ *<br />
<br />
games*<br />
$$ *<br />
Sunday Streets<br />
*Sponsorship opportunity<br />
**Cost estimate scale increases approximately logarithmically. $ = $5k, $$ = $10K, $$$ = $25K, $x4 = $50K, $x5 = $100K, $x6 = $250K, $x7 =<br />
$500K, $x8 = $1M, $x9 = $5M, $x10 = $10M<br />
Advertisements<br />
<br />
Special events<br />
Film Festivals<br />
Page 20
Bicycle System Inclusiveness<br />
Accessibility and Taxis<br />
Strategies to involve the accessibility<br />
community and seniors<br />
In targeted stakeholder workshops, members<br />
of the accessibility and senior communities<br />
expressed their desire to participate in the<br />
city's bicycle growth. Recognizing these users'<br />
unique needs, here are methods the city will<br />
incorporate into its bicycle planning to increase<br />
the inclusiveness of the city bicycle system:<br />
Accommodations for diverse vehicle types<br />
<br />
<br />
<br />
<br />
bicycle parking that can accommodate<br />
larger vehicles at community centers and<br />
health care facilities<br />
<br />
Targeted education and group rides<br />
Education, outreach, and enforcement in<br />
pedestrian areas that service sensitive user<br />
groups<br />
Strategies to involve the taxi and shuttle<br />
community<br />
Taxis, shuttles, and car sharing are important<br />
elements of the city transportation system and can<br />
<br />
to incorporate taxis and shuttles into the city bicycle<br />
system:<br />
Taxi / bicycle driver education<br />
Taxi passenger awareness campaigns, including<br />
posters and window decals<br />
Taxi access to curb zones when dropping off<br />
disabled passengers<br />
<br />
Page 21<br />
Image: Copenhagenize.com
Strategic Approach<br />
Moving from a Starter to Climber city, and from a Climber to<br />
Champion city will require investment, supporting policies, and<br />
time. The city's current trajectory over the next six years, or the<br />
<br />
Plan, constructing a modest amount of additional improvements,<br />
and maintaining existing support program levels.<br />
<br />
expanding the 215 mile bicycle network, constructing an<br />
extensive system support facilities, and increasing support<br />
program funding eight-fold. The intensity and extent of these<br />
improvements would bring <strong>San</strong> <strong>Francisco</strong> to the same level as<br />
Amsterdam and Copenhagen. Assuming a reasonable amount<br />
of supportive transportation policy (taxes, fees, and incentives),<br />
<strong>San</strong> <strong>Francisco</strong> could see a 15 to 20 percent bicycle mode share<br />
over the next 15 to 20 years.<br />
The Strategic Plan scenario is a one where the city implements<br />
<br />
roughly a quarter to a third of the ultimate bicycle mode share.<br />
This rise would be more than a doubling of current bicycle<br />
activity.<br />
“Bicycle Plan Plus” scenario<br />
Complete the bicycle plan (10<br />
miles)<br />
Upgrade 10 miles of the existing<br />
bicycle network to premium<br />
bicycle facilities<br />
Upgrade 10 intersections to<br />
accommodate bicycles<br />
Install 4000 bicycle parking<br />
spaces<br />
Deploy and maintain a 500 bicycle<br />
/ 50 station bicycle sharing system<br />
Provide the existing level of<br />
support programs ($1.2m / yr)<br />
Total cost: $60m through 2018 (6<br />
year total)<br />
Strategic Plan scenario<br />
Complete the bicycle plan (10<br />
miles)<br />
Upgrade 50 miles of the existing<br />
bicycle network to premium<br />
bicycle facilities<br />
Construct 12 miles of new<br />
bicycle facilities<br />
Upgrade 50 intersections to<br />
accommodate bicycles<br />
Install 21000 bicycle parking<br />
spaces<br />
Deploy and maintain a 2750<br />
bicycle / 275 station bicycle<br />
sharing system. Support electric<br />
bicycles.<br />
Double the existing level of<br />
support programs ($2.5m / yr)<br />
Total cost: $190m through 2018 (6<br />
year total)<br />
System Build-out scenario<br />
(Amsterdam / Copenhagen-system)<br />
Complete the bicycle plan (10<br />
miles)<br />
Upgrade 200 miles of the<br />
existing bicycle network to<br />
premium bicycle facilities<br />
Construct 35 miles of new<br />
bicycle facilities<br />
Upgrade 200 intersections to<br />
accommodate bicycles<br />
Install 50,000 bicycle parking<br />
spaces<br />
Deploy and maintain a 3000+<br />
bicycle / 300+ station bicycle<br />
sharing system. Support electric<br />
bicycles.<br />
Provide a build-out level of<br />
support programs ($10m / yr)<br />
Total cost: $500m for infrastructure,<br />
plus $4m / yr for bicycle sharing and<br />
$10m / yr for support programs.<br />
Outcome contingent on<br />
complementary auto pricing fees<br />
and policies<br />
Page 22
Funding Gap and Investment<br />
Scenarios<br />
The city needs $170 million in additional funding to meet the Strategic Plan funding scenario.<br />
Bicycle program funding<br />
(per the SFMTA 2012-2017 CIP)<br />
<br />
<br />
<br />
TFCA) - $23.2m<br />
<br />
Total - $30.3m<br />
Funding gap<br />
<br />
Strategic Plan scenario - $160m ($21.5m / yr)<br />
<br />
Potential new funding sources<br />
Other State and Regional discretionary programs<br />
<br />
Safe Routes to Transit, TLC)<br />
<br />
Public - private partnerships and development<br />
impact fees<br />
New transportation fees (Vehicle Licensing Fee, sale<br />
tax, property tax, user fees, parking fees, congestion<br />
pricing).<br />
The funding gap, 2013-2018<br />
Potential Investment Scenarios.<br />
Given a budget of $6 million per year, these are various strategies the SFMTA can use to prioritize projects.<br />
Close network gaps<br />
<br />
<br />
<br />
<br />
<br />
50 signals and bicycle boxes<br />
3 miles buffered lanes<br />
3 miles basic cycle track<br />
<br />
<br />
Increase basic network comfort<br />
<br />
<br />
<br />
<br />
<br />
<br />
15 signals and bicycle boxes<br />
5 miles buffered lanes<br />
5 miles basic cycle track<br />
1 mile bicycle boulevard<br />
<br />
<br />
Focus improvements on a few<br />
key corridors<br />
<br />
<br />
<br />
<br />
<br />
<br />
15 signals and bicycle boxes<br />
0.25 miles basic cycle track<br />
1.5 miles bicycle boulevard<br />
0.25 miles separated cycle track<br />
<br />
<br />
Page 23
Proposed Project Prioritization<br />
Prioritization Framework<br />
A clear and concise Decision Making Process<br />
<br />
transparent project evaluation and prioritization methodology<br />
to determine which projects to fund and implement.<br />
Project evaluation will use the following framework:<br />
Categorize projects as network, support facility, or<br />
support program. Outside funding sources and agencies<br />
may dictate whether particular funds can be allocated for<br />
a particular type of project.<br />
Assess projects based on their need, effectiveness,<br />
and readiness. Aspects within need can include<br />
existing bicycle activity and crash rates. Effectiveness<br />
assesses the expected change in bicycle behavior<br />
due to the project, based on best practice studies or<br />
similar experience in the city. Readiness accounts for<br />
environmental clearance, community support, and<br />
funding.<br />
Project stakeholders will weigh the evaluation criteria<br />
based on their individual and collective priority. Projects<br />
that score above a particular threshold will enter the<br />
process for funding and implementation.<br />
Establish project criteria<br />
Establish evaluation criteria<br />
Inventory and score potential projects<br />
Prioritize projects<br />
Allocate funds and implement projects<br />
Evaluation Framework<br />
Project Categories<br />
Network<br />
Support<br />
Facilities<br />
Support<br />
Programs<br />
Evaluation Criteria<br />
Need<br />
Effectiveness<br />
Readiness<br />
Funded Projects<br />
Page 24
Strategic Goals<br />
SFMTA Bicycle Strategy Vision<br />
<br />
<br />
<br />
GOAL 1<br />
GOAL 2<br />
Improve safety and connectivity for<br />
people traveling by bicycle<br />
Image: Flickr / Lynn Friedman<br />
Increase convenience for trips made<br />
by bicycle<br />
GOAL 3<br />
GOAL 4<br />
Normalize riding bicycles through<br />
media, marketing, education, and<br />
outreach<br />
Plan and deliver complete streets<br />
projects<br />
Image: Flickr / Pyramis<br />
Page 25
Goal<br />
1Improve safety and connectivity<br />
for people traveling by bicycle<br />
Consistent with the overall SFMTA Strategic Plan, the safety of the bicycle system is paramount. A safe<br />
and comfortable bicycle experience requires closing system gaps, providing accurate information to<br />
users, and regular evaluation of our progress.<br />
Objective 1.1: Improve the comfort and connectivity of the bicycle network for all users, especially<br />
vulnerable user groups, e.g. youths, the disabled, and seniors.<br />
Objective 1.2: Improve the safety of the bicycle network for all users.<br />
Objective 1.3: Ease navigation through the bicycle network.<br />
Objective 1.4: Collect data to evaluate bicycle network activity and safety.<br />
The performance indicators listed below are the key measures that will indicate how the SFMTA is<br />
performing with respect to bicycle safety and connectivity.<br />
PROPOSED KEY PERFORMANCE<br />
INDICATORS<br />
OBJECTIVE 1.1: Percent of the<br />
bicycle network that is moderately<br />
comfortable for an average person on<br />
a bicycle.<br />
OBJECTIVE 1.2: Number of crash<br />
hotspots improved.<br />
OBJECTIVE 1.3: Miles of networked<br />
<br />
indicating destinations and distance.<br />
OBJECTIVE 1.4:<br />
evaluation.<br />
PROPOSED TARGETS<br />
FY 2014 FY 2016 FY 2018<br />
Establish a bicycle network comfort index. Increase network comfort to<br />
<br />
year.<br />
Decrease the bicycle crash rate by 10 percent each year.<br />
Study and pilot safety countermeasures at three crash hotspots per<br />
year.<br />
<br />
year.<br />
Develop a bicycle<br />
<br />
<br />
coverage with<br />
automatic bicycle<br />
counters.<br />
<br />
barometer".<br />
Install the citywide<br />
<br />
<br />
network coverage).<br />
<br />
coverage with<br />
automatic bicycle<br />
counters.<br />
Install a second<br />
and third "bicycle<br />
barometer".<br />
<br />
coverage with<br />
automatic bicycle<br />
counters.<br />
Install the fourth<br />
<br />
barometer".<br />
Collect and analyze bicycle sharing data.<br />
Collect, analyze and report changes to city bicycle activity via the<br />
annual SFMTA Mobility <strong>Report</strong>.<br />
Page 26
Goal<br />
2<br />
Increase<br />
convenience for trips<br />
made by bicycle<br />
<br />
<br />
and bicycle sharing extend public transit's reach and improve its performance.<br />
Objective 2.1: Increase the supply of short-term bicycle parking.<br />
Objective 2.2: Increase the supply of adequate long-term bicycle parking<br />
Objective 2.3: Expand bicycle sharing in core bicycle areas.<br />
The performance indicators listed below are the key measures that will indicate how the SFMTA is<br />
performing with respect to increasing bicycle convenience.<br />
PROPOSED KEY PERFORMANCE<br />
INDICATORS<br />
OBJECTIVE 2.1: Short-term bicycle<br />
parking spaces and coverage<br />
OBJECTIVE 2.2: Long-term bicycle<br />
parking space and coverage<br />
PROPOSED TARGETS<br />
FY 2014 FY 2016 FY 2018<br />
Establish shortterm<br />
bicycle parking<br />
baseline of 1 rack on<br />
each neighborhood<br />
commercial block.<br />
Establish one new<br />
attended and one<br />
new unattended<br />
secure bicycle parking<br />
station.<br />
Provide additional short-term bicycle parking<br />
<br />
crowd sourcing.<br />
Establish a second<br />
new attended<br />
and second new<br />
unattended secure<br />
bicycle parking<br />
station.<br />
Establish a third new<br />
attended and third<br />
new unattended<br />
secure bicycle parking<br />
station.<br />
<br />
existing SFMTA<br />
bicycle lockers with<br />
e-lockers<br />
Incorporate e-lockers<br />
into secure bicycle<br />
parking facilities.<br />
Incorporate e-lockers<br />
into secure bicycle<br />
parking facilities.<br />
Install four residential<br />
collective bicycle<br />
lockers<br />
Install four additional<br />
residential collective<br />
bicycle lockers<br />
Install four additional<br />
residential collective<br />
bicycle lockers<br />
OBJECTIVE 2.3:<br />
system coverage.<br />
Implement Phases I<br />
and II of the bicycle<br />
sharing system. (1000<br />
bikes)<br />
Implement Phase III<br />
of the bicycle sharing<br />
system (2,750 bikes,<br />
<br />
Expand the bicycle<br />
sharing system to<br />
include key satellite<br />
service areas.<br />
Explore opportunities<br />
to incorporate<br />
diverse vehicle types,<br />
including e-bicycles<br />
and pedalecs.<br />
Page 27
Goal<br />
3<br />
Normalize riding bicycles<br />
through media, marketing,<br />
education, and outreach.<br />
Fostering a positive image of bicycles is important for increasing bicycle participation, especially among<br />
<br />
and investors.<br />
Objective 3.1: Normalize riding bicycles among city residents, employees, and students.<br />
Objective 3.2: Increase awareness of <strong>San</strong> <strong>Francisco</strong> as a bicycle city regionally, nationally, and<br />
internationally.<br />
Objective 3.3: Increase bicycle education opportunities.<br />
Objective 3.4: Reinforce positive multimodal behavior.<br />
The performance indicators listed below are the key measures that will indicate how the SFMTA is<br />
performing with respect to fostering bicycle culture and identity.<br />
PROPOSED KEY PERFORMANCE<br />
INDICATORS<br />
OBJECTIVE 3.1: Local bicycle<br />
awareness<br />
OBJECTIVE 3.2:Vistor bicycle<br />
awareness<br />
OBJECTIVE 3.3: <br />
OBJECTIVE 3.4: <br />
PROPOSED TARGETS<br />
FY 2014 FY 2016 FY 2018<br />
Increase awareness of city residents, employees, businesses, and<br />
<br />
budget cycle through marketing, social media, conventions and trade<br />
shows. Measure via online survey methods and social media metrics,<br />
e.g. "tweets" and "likes".<br />
<br />
staff responsible for community bicycle education and outreach.<br />
<br />
budget cycle through marketing partnerships with visitor organizations,<br />
hotel and destination partnerships. Measure via online survey methods<br />
and social media metrics, e.g. "tweets" and "likes".<br />
Annual bicycle<br />
<br />
SFUSD schools.<br />
One annual bicycle<br />
education course in<br />
each SF Supervisor<br />
District through the<br />
<br />
program.<br />
Annual bicycle<br />
<br />
SFUSD schools.<br />
Two annual bicycle<br />
education courses in<br />
each SF Supervisor<br />
District through the<br />
<br />
program.<br />
Annual bicycle<br />
<br />
SFUSD schools.<br />
<br />
education courses in<br />
each SF Supervisor<br />
District through the<br />
<br />
program.<br />
Offer bicycle education to private schools, seniors, the disabled<br />
community, and other vulnerable users.<br />
<br />
enforcement and<br />
encouragement<br />
at crash hotspots<br />
<br />
Ambassador program.<br />
Monthly multimodal<br />
enforcement and<br />
encouragement<br />
at crash hotspots<br />
<br />
Ambassador program.<br />
Weekly multimodal<br />
enforcement and<br />
encouragement<br />
at crash hotspots<br />
<br />
Ambassador program.<br />
<br />
Page 28
Goal<br />
4<br />
Plan and deliver complete<br />
streets projects<br />
Making non-private auto modes, including bicycles, the preferred means of travel in the city requires<br />
<br />
project delivery includes securing funding for bicycle projects, and supporting projects and policies that<br />
complement mode shifts from automobiles.<br />
Objective 4.1: Prioritize shovel-ready projects<br />
Objective 4.2: Seek new funding for the future and close the strategic funding gap.<br />
Objective 4.3: Support policies and projects complementary to bicycling.<br />
Objective 4.4: Integrate projects to accommodate bicycle-transit trips.<br />
The performance indicators listed below are the key measures that will indicate how the SFMTA is<br />
performing with respect to bicycle project delivery.<br />
PROPOSED KEY PERFORMANCE<br />
INDICATORS<br />
OBJECTIVE 4.1: Project delivery and<br />
agency management<br />
OBJECTIVE 4.2: <br />
funding<br />
PROPOSED TARGETS<br />
FY 2014 FY 2016 FY 2018<br />
Update the SFMTA Capital Improvement Program to prioritize projects<br />
that rate highest in terms of need, effectiveness, and readiness.<br />
Adopt an agency project management system and track funding to the<br />
bicycle program.<br />
Secure funding for bicycle projects from new funding sources. Identify<br />
dedicated revenue sources by 2014.<br />
Close strategic<br />
<br />
Close strategic<br />
<br />
Close strategic<br />
<br />
OBJECTIVE 4.3:Supportive projects<br />
and policies<br />
OBJECTIVE 4.4:<br />
projects.<br />
Support SFpark, SFgo, Muni Transit Effectiveness Project, congestion<br />
pricing, and other Travel Demand Management (TDM) projects;<br />
integrate bicycle projects into the Complete Streets process.<br />
<br />
projects.<br />
Deliver transit projects with a complete streets component.<br />
Page 29
Stakeholder Workshops<br />
<br />
<br />
county, and regional agencies, as well as members of the bicycle community. The second workshop hosted members of<br />
<br />
members of the <strong>San</strong> <strong>Francisco</strong> taxi community.<br />
General Stakeholder Workshop<br />
Accessibility Stakeholder Workshop<br />
Attendees: 17 representatives from SF Planning,<br />
<br />
<br />
Environment, SFMTA, and other key stakeholders.<br />
Key Takeaways:<br />
<br />
(2) Upgrade to separated, wider bicycle facilities<br />
(3) Provide more secure bicycle parking & roll out bike<br />
sharing<br />
(4) Design for bicycle-transit integration<br />
(5) Provide weekly Sunday Streets, bicycle branding<br />
campaigns, education & individualized marketing programs<br />
(6) Project need and effectiveness are most important for<br />
prioritizing projects<br />
(7) Leverage public-private partnerships, e.g. "Sponsor a<br />
Mile" program<br />
Attendees: <br />
Disability, Independent Living Resource Center, SFMTA<br />
<br />
<br />
key stakeholders.<br />
Key Takeaways:<br />
(1) Design complete streets with clear separation between<br />
modes & maintain curb access for paratransit<br />
<br />
children's bicycles, e-bikes<br />
<br />
(4) Design parking for non-traditional bicycles<br />
(5) Use bicycle and driver education to foster mutual respect<br />
between street users<br />
(6) Provide subsidies for bicycles, helmets, locks & lights<br />
(7) Enforce prohibitions against sidewalk riding & consider<br />
bicycle license program<br />
Page 30
Stakeholder Workshops<br />
Taxi Stakeholder Workshop<br />
Attendees: 15 participants, including representatives<br />
<br />
<br />
Committee (MAAC) and other key stakeholders.<br />
Key Takeaways:<br />
(1) Educate taxi drivers and people on bicycles on rules<br />
regarding taxi loading next to and within bicycle facilities.<br />
(2) Design bicycle facilities that accommodate passenger<br />
drop off.<br />
<br />
boarding and alighting, and to reduce instances of dooring.<br />
(4) Provide bicycle friendly cabs with trunk or roof racks.<br />
(5) Outreach and marketing to drivers, passengers,<br />
and bicycle riders that taxis and bicycles are part of the<br />
multimodal transportation system.<br />
(6) Open dialogue between the taxi and bicycle community<br />
<br />
(7) Provide education and enforcement on the rules of the<br />
road (e.g. passing on the left, stopping at stop signs and stop<br />
lights, permission to "take the lane").<br />
(8) Consider bicycle license program.<br />
Page 31
Next Steps<br />
To grow bicycle<br />
mode share<br />
The SFMTA will work with stakeholders through February 2013 to fully create and establish a needs and<br />
<br />
<br />
order to leverage the results of this work, the SFMTA will establish an "Eight-to-Eighty" bicycle ride team<br />
who will collect the necessary data for completing the needs and gap closure assessment.<br />
<br />
delivery of bicycle facilities and support programs. The implementation of key projects, including acquiring<br />
<br />
throughout the Strategic Plan timeframe of 2013 to 2018. To hold the SFMTA accountable, the Strategic<br />
Plan Annual Mobility <strong>Report</strong> will include a report of the progress on bicycle improvements.<br />
This ongoing work will ensure bicycling is part of everyday life in <strong>San</strong> <strong>Francisco</strong>.<br />
Page 32
Acknowledgements<br />
Executive Leadership<br />
Edwin M. Lee, Mayor<br />
City and County of <strong>San</strong> <strong>Francisco</strong><br />
Board of Supervisors<br />
Eric Mar | District 1<br />
Mark Farrell | District 2<br />
David Chiu | District 3<br />
Carmen Chu | District 4<br />
<br />
Jane Kim | District 6<br />
<br />
Scott Wiener | District 8<br />
David Campos | District 9<br />
Malia Cohen | District 10<br />
John Avalos | District 11<br />
SFMTA Board of Directors<br />
Tom Nolan | Chairman<br />
<br />
<br />
<br />
Jerry Lee<br />
Joél Ramos<br />
Cristina Rubke<br />
Director of <strong>Transportation</strong><br />
Edward Reiskin<br />
SFMTA Staff<br />
Primary authors:<br />
Timothy Papandreou, Deputy Director, Strategic<br />
Planning and Policy<br />
Andrew Lee, <strong>Transportation</strong> Planner<br />
<br />
<br />
Anne Fritzler, <strong>Transportation</strong> Planner<br />
Terra Curtis, <strong>Transportation</strong> Design Trainee<br />
Carly Sieff, <strong>Transportation</strong> Design Trainee<br />
Craig Raphael, <strong>Transportation</strong> Design Trainee<br />
Contributors:<br />
<br />
<br />
Nate Chanchareon, Manager, Multimodal Planning<br />
Julie Kirschbaum, Manager, Transit Service Planning<br />
<br />
Matt Lasky, <strong>Transportation</strong> Planner<br />
Luis Montoya, <strong>Transportation</strong> Planner<br />
Seleta Reynolds, Manager, Livable Streets<br />
Jonathan Rewers; Manager, Capital Fund<br />
Programming<br />
Annette Williams, Manager, Accessible Services<br />
<br />
Jay Primus, Manager, SFPark<br />
Amit Kothari, Director, Off-Street Parking<br />
Partner Departments and Agencies<br />
SF Department of Public Works, SF County<br />
<strong>Transportation</strong> Authority, SF City Planning, SF<br />
<br />
<br />
<br />
Independent Living Resource Center, Aging and Adult<br />
<br />
MAAC, and SF Taxi providers.<br />
Page 33
One South Van Ness Avenue<br />
<strong>San</strong> <strong>Francisco</strong> CA 94103<br />
www.sfmta.com