Squamous cell and adenosquamous carcinomas of ... - BPA Pathology
Squamous cell and adenosquamous carcinomas of ... - BPA Pathology
Squamous cell and adenosquamous carcinomas of ... - BPA Pathology

You also want an ePaper? Increase the reach of your titles
YUMPU automatically turns print PDFs into web optimized ePapers that Google loves.
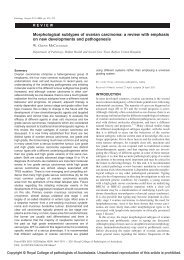
<strong>Squamous</strong> <strong>cell</strong> <strong>carcinomas</strong> <strong>of</strong> the gallbladder<br />
JC Roa et al 1075<br />
Table 1 Comparison <strong>of</strong> (a) clinicopathological <strong>and</strong> (b) histopathological characteristics <strong>of</strong> squamous <strong>cell</strong>/<strong>adenosquamous</strong> <strong>carcinomas</strong><br />
<strong>and</strong> ordinary adeno<strong>carcinomas</strong> <strong>of</strong> the gallbladder<br />
(a)<br />
Adenosquamous carcinoma/<br />
squamous <strong>cell</strong> carcinoma (N ¼ 34)<br />
Gallbladder<br />
adenocarcinoma (N ¼ 572)<br />
P-value<br />
Mean age 65 64 0.59<br />
Female/male 3.8 3.8 N/A<br />
Mean tumor size (cm) 3.1 2.7 0.42<br />
Median tumor size (cm) 2.5 2.4 N/A<br />
pT3 (%) 68 49 0.03<br />
Mean survival (months) (range) 23 (1–112.5) 50 (1–160) 0.003<br />
Median survival (months) 4 12<br />
(b)<br />
(N ¼ 34) (N ¼ 50)<br />
Tumor giant <strong>cell</strong>s (%) 29 10 0.02<br />
Peritumoral eosinophils (%) 51 6 0.001<br />
Vascular invasion (%) 76 72 0.21<br />
Perineural invasion (%) 32 48 0.22<br />
For comparison <strong>of</strong> clinicopathologic parameters listed in table 1a, all 572 adeno<strong>carcinomas</strong> were used. For comparison <strong>of</strong> some histopathologic<br />
parameters that require more detailed analysis listed in table 1b, r<strong>and</strong>omly chosen stage per stage matched 50 adeno<strong>carcinomas</strong> were used.<br />
Table 2 Comparison <strong>of</strong> survival <strong>of</strong> squamous <strong>cell</strong>/<strong>adenosquamous</strong> <strong>carcinomas</strong> <strong>and</strong> ordinary adeno<strong>carcinomas</strong> <strong>of</strong> the gallbladder<br />
Adenosquamous carcinoma/squamous<br />
<strong>cell</strong> carcinoma median survival (months)<br />
Gallbladder adenocarcinoma<br />
median survival (months)<br />
P-value<br />
All stages 4 12 0.003<br />
(N ¼ 34) (N ¼ 572)<br />
Advanced stages (pT2, pT3, pT4) 4 11.4 0.001<br />
(N ¼ 31) (N ¼ 452)<br />
pT2 stage 14,8 63 0.01<br />
(N ¼ 8) (N ¼ 201)<br />
pT3 stage 21.8 19.3 0.09<br />
(N ¼ 23) (N ¼ 251)<br />
<strong>of</strong> gallbladder adeno<strong>carcinomas</strong> (median ¼ 4 vs 12;<br />
P ¼ 0.003; Figure 12). More importantly, this<br />
adverse prognosis persisted when compared with<br />
stage-matched ‘advanced (pT2, pT3 <strong>and</strong> pT4)’<br />
gallbladder adenocarcinoma cases (n ¼ 452) who<br />
had a median survival <strong>of</strong> 11.4 months (P ¼ 0.01) as<br />
well as with individual stage groups with the<br />
exception <strong>of</strong> T3, which did not reach the same<br />
statistical significance (P ¼ 0.09, Table 2).<br />
The results are summarized in Tables 1 <strong>and</strong> 2.<br />
Discussion<br />
<strong>Squamous</strong> differentiation is rather uncommon in the<br />
gallbladder. In this study <strong>of</strong> 606 invasive <strong>carcinomas</strong>,<br />
which represents the largest cohort to be<br />
analyzed for this purpose to date, squamous differentiation<br />
was detected in 7% <strong>of</strong> the cases. This<br />
figure varied significantly in the literature, ranging<br />
from 1 to 12%, 24–27 presumably mostly due to the<br />
definitional differences. Our study demonstrates<br />
that pure squamous <strong>cell</strong> <strong>carcinomas</strong>, which we<br />
defined as invasive <strong>carcinomas</strong> composed entirely<br />
<strong>of</strong> squamous differentiation, are very uncommon,<br />
constituting only 1% <strong>of</strong> the cases. Rather, squamous<br />
differentiation in the gallbladder is seen mostly<br />
as a secondary component in association with<br />
conventional adeno<strong>carcinomas</strong>. 9,13,14,21,23,25,29,45,46<br />
This focal squamous differentiation can vary in<br />
amount from very minimal, presumably with no (or<br />
negligible) clinical/biological significance, to extensive.<br />
We employed the arbitrary cut<strong>of</strong>f <strong>of</strong> ‘o25%’ to<br />
determine the negligibility <strong>of</strong> this secondary differentiation,<br />
as has been done for the mixed differentiation<br />
<strong>carcinomas</strong> <strong>of</strong> other organs, <strong>and</strong> classified<br />
such cases as adenocarcinoma with focal squamous<br />
change (1% <strong>of</strong> the cases), <strong>and</strong> reserved the diagnosis<br />
<strong>of</strong> <strong>adenosquamous</strong> carcinoma for only those that<br />
have 25–99% <strong>of</strong> the tumor showing squamous<br />
differentiation (4% <strong>of</strong> gallbladder <strong>carcinomas</strong>).<br />
Modern <strong>Pathology</strong> (2011) 24, 1069–1078