Annual Report Fiscal Year 2001/2002 - Human Frontier Science ...
Annual Report Fiscal Year 2001/2002 - Human Frontier Science ...
Annual Report Fiscal Year 2001/2002 - Human Frontier Science ...

Create successful ePaper yourself
Turn your PDF publications into a flip-book with our unique Google optimized e-Paper software.
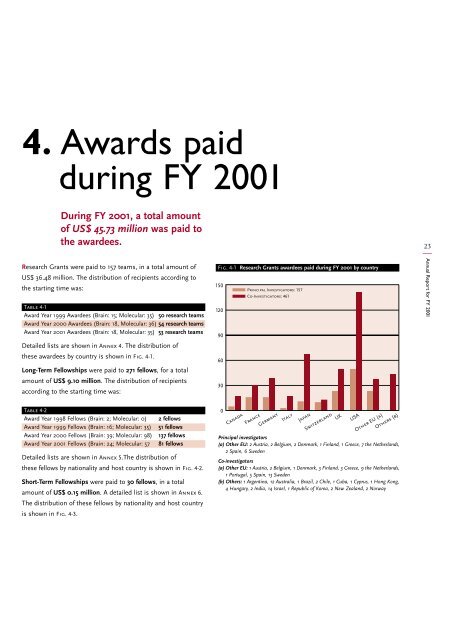
4. Awards paid<br />
during FY <strong>2001</strong><br />
150<br />
120<br />
90<br />
During FY <strong>2001</strong>, a total amount<br />
of US$ 45.73 million was paid to<br />
the awardees.<br />
Research Grants were paid to 157 teams, in a total amount of<br />
US$ 36.48 million. The distribution of recipients according to<br />
the starting time was:<br />
Table 4-1<br />
Award <strong>Year</strong> 1999 Awardees (Brain: 15; Molecular: 35) 50 research teams<br />
Award <strong>Year</strong> 2000 Awardees (Brain: 18, Molecular: 36) 54 research teams<br />
Award <strong>Year</strong> <strong>2001</strong> Awardees (Brain: 18, Molecular: 35) 53 research teams<br />
Detailed lists are shown in Annex 4. The distribution of<br />
these awardees by country is shown in Fig. 4-1.<br />
Long-Term Fellowships were paid to 271 fellows, for a total<br />
amount of US$ 9.10 million. The distribution of recipients<br />
according to the starting time was:<br />
Table 4-2<br />
Award <strong>Year</strong> 1998 Fellows (Brain: 2; Molecular: 0)<br />
Award <strong>Year</strong> 1999 Fellows (Brain: 16; Molecular: 35)<br />
Award <strong>Year</strong> 2000 Fellows (Brain: 39; Molecular: 98)<br />
Award <strong>Year</strong> <strong>2001</strong> Fellows (Brain: 24; Molecular: 57<br />
2 fellows<br />
51 fellows<br />
137 fellows<br />
81 fellows<br />
Detailed lists are shown in Annex 5.The distribution of<br />
these fellows by nationality and host country is shown in Fig. 4-2.<br />
Short-Term Fellowships were paid to 30 fellows, in a total<br />
amount of US$ 0.15 million. A detailed list is shown in Annex 6.<br />
The distribution of these fellows by nationality and host country<br />
is shown in Fig. 4-3.<br />
60<br />
30<br />
0<br />
Fig. 4-1 Research Grants awardees paid during FY <strong>2001</strong> by country<br />
150<br />
120<br />
90<br />
60<br />
30<br />
0<br />
Canada<br />
Principal Investigators: 157<br />
Co-Investigators: 461<br />
France<br />
Germany<br />
Italy<br />
Japan<br />
Switzerland<br />
UK<br />
USA<br />
Other EU (a)<br />
Others (b)<br />
Principal investigators<br />
(a) Other EU: 2 Austria, 2 Belgium, 2 Denmark, 1 Finland, 1 Greece, 7 the Netherlands,<br />
2 Spain, 6 Sweden<br />
Co-investigators<br />
(a) Other EU: 1 Austria, 2 Belgium, 1 Denmark, 3 Finland, 3 Greece, 9 the Netherlands,<br />
1 Portugal, 5 Spain, 13 Sweden<br />
(b) Others: 1 Argentina, 12 Australia, 1 Brazil, 2 Chile, 1 Cuba, 1 Cyprus, 1 Hong Kong,<br />
4 Hungary, 2 India, 14 Israel, 1 Republic of Korea, 2 New Zealand, 2 Norway<br />
23<br />
—<br />
<strong>Annual</strong> <strong>Report</strong> for FY <strong>2001</strong>