3.2 Worksheet
3.2 Worksheet
3.2 Worksheet

You also want an ePaper? Increase the reach of your titles
YUMPU automatically turns print PDFs into web optimized ePapers that Google loves.
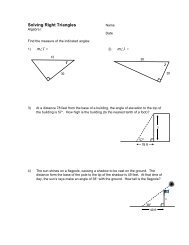
STA 2e: Sect. <strong>3.2</strong> <strong>Worksheet</strong> #1<br />
68%-95%-99.7% RULE INTERPRETING Z-SCORES<br />
Name __________________________<br />
1. If a person has a negative z-score, did the person score higher or lower than the mean ……………<br />
2. If a person has a negative z-score, it does not always mean that the person did not do well. Name a sport<br />
where having the lowest z-score would be the most desirable.<br />
………………………<br />
For #3 – 9: The mean weight of adult American men is 180 pounds with standard deviation of 25 pounds.<br />
The weights are approximately normally distributed. Use the 68%-95%-99.7% Rule to approximate each<br />
of the following.<br />
3. Using the values given above, label the normal curve at the right with the numerical values for µ, µ ± σ, µ ±<br />
2σ and µ ± 3σ.<br />
4. What percent of all adult American men have a weight less than<br />
130 pounds<br />
……………<br />
5. What percent of all adult American men have a weight between<br />
130 and 205 pounds<br />
……………<br />
6. What percent of all adult American men have a weight less than 230 pounds ……………<br />
7. What percent of all adult American men have a weight less than 105 pounds ……………<br />
8. The heaviest 16% of all men in weight weigh more than how many pounds ……………<br />
9. What weight separates the lowest 2.5% of all American men in weight from the remaining weights ………<br />
For #10 –17: Elephants have the longest pregnancy of all mammals. One species of elephant has a<br />
mean gestation period of 525 days and standard deviation of 32 days. Pregnancy length follows an<br />
approximately normally distribution. Use the 68%-95%-99.7% Rule to approximate each of the following.<br />
10. Using the values given above, label the normal curve at the right with the numerical values for µ, µ ± σ, µ ±<br />
2σ and µ ± 3σ.<br />
11. The longest 16% of all elephant pregnancies last at least how many days<br />
…………<br />
12. The middle 68% of all elephant pregnancies last between …………<br />
and ………… days.<br />
13. Only 2.5% of all elephant pregnancies last longer than ………… days.<br />
14. What percent of elephant pregnancies last less than 461 days …………<br />
15. What percent of elephant pregnancies last between 525 and 557 days …………<br />
16. What percent of elephant pregnancies last between 493 and 589 days …………<br />
17. What percent of elephant pregnancies last less than 557 days …………
STA 2e: Sect. <strong>3.2</strong> <strong>Worksheet</strong> # 1 p.2<br />
18. Maria made 75% on her Government test and 83% on her Algebra 2 test. The mean grade on the<br />
Government test was 72% with a standard deviation of 5%. The average grade on the Algebra 2 test was<br />
81% with a standard deviation of 4%. On which test did Maria do better Justify your answer.<br />
19. For a standard normal distribution, the mean µ is always ……… and the standard deviation σ is<br />
always ……….<br />
For #20 – 25: Use Table A (Standard Normal Distribution) to find the proportion of observations that<br />
satisfies each of the following statements. In each case, shade the area under the curve that is the<br />
answer to the question.<br />
20.<br />
21.<br />
22.<br />
–3 –2 –1 0 1 2 3<br />
z is less than –1.83<br />
–3 –2 –1 0 1 2 3<br />
z is greater than 2.18<br />
–3 –2 –1 0 1 2 3<br />
z is less than 0.33<br />
……………<br />
……………<br />
……………<br />
23.<br />
24.<br />
25.<br />
–3 –2 –1 0 1 2 3<br />
z is between 1.42 and 2.68<br />
–3 –2 –1 0 1 2 3<br />
z is greater than –0.51<br />
–3 –2 –1 0 1 2 3<br />
z is between –2 and 1.53<br />
……………<br />
……………<br />
……………<br />
For #26 – 28: Find the value of z from the standard normal distribution that satisfies each of the<br />
following conditions. (Use the value of z from Table A that comes closest to satisfying the condition.)<br />
26. 27. 28.<br />
Area is<br />
0.0630<br />
Area is<br />
0.2981<br />
Area is<br />
0.5035<br />
z z<br />
–z<br />
z = …………<br />
z = …………<br />
z<br />
z = …………
STA 2e: Sect. <strong>3.2</strong> <strong>Worksheet</strong> #2<br />
NORMAL DISTRIBUTIONS<br />
Name __________________________<br />
FINDING A PERCENT/PROPORTION given an x value<br />
Standardize x to restate the problem in terms of a<br />
standard Normal variable z. Draw a picture to show the<br />
area of interest under the standard Normal curve.<br />
Then find the required area under the standard Normal<br />
curve using Table A.<br />
FINDING AN X VALUE given a percentage/proportion<br />
Look in the body of Table A for the entry closest to the<br />
given proportion or the proportion to the left of given<br />
proportion to find the corresponding z. “Unstandardize”<br />
to transform the solution from a z-‐score to a value of x<br />
using the equation z = x − µ .<br />
σ<br />
Scores on the Wechsler Adult Intelligence Scale, a standard IQ test, are approximately normal for the 20<br />
to 34 age group with µ = 110 and σ = 25.<br />
1. What percent of this age group have an IQ less than 100<br />
2. What percent of this age group have an IQ between 90 and115<br />
3. Find the 80th percentile of the IQ scores distribution of 20 to 34 year olds.<br />
4. Find the IQ score which separates the lowest 25% of all IQ scores for this age group<br />
from the highest 75%.<br />
The adult men of the Dinaric Alps have the highest average height of all regions. The distribution of<br />
height is approximately normal with a mean height of 6 ft 1 in (73 inches) and<br />
standard deviation of 3 inches.<br />
5. Find the 40th percentile of the height of Dinaric Alps distribution for men.<br />
6. What percentage of men have a height greater than 74 inches
Sect. <strong>3.2</strong> <strong>Worksheet</strong> #2 p.2<br />
7. What percentage of men have a height between 70 inches and 78 inches<br />
8. The average height of adult American men is 69 inches. What percent of the adult men in the Dinaric Alps<br />
are taller than the average American man<br />
9. What would be the minimum height of man in the Dinaric Alps that would place him in the top 10% of all<br />
heights<br />
The length of pregnancy for the Asian elephant has an approximately normal distribution with an<br />
average length of 609 days and standard deviation of 31 days.<br />
10. How long do the longest 5% of all elephant pregnancies last<br />
11. What percent of the elephant pregnancies last between 600 and 615 days<br />
12. The shortest 20% of all elephant pregnancies last fewer than how many days<br />
13. The middle 50% of all elephant pregnancies fall between how many days