Resonance light scattering method for the determination of anionic ...
Resonance light scattering method for the determination of anionic ...
Resonance light scattering method for the determination of anionic ...

You also want an ePaper? Increase the reach of your titles
YUMPU automatically turns print PDFs into web optimized ePapers that Google loves.
X. Xiao et al. / Spectrochimica Acta Part A 71 (2008) 398–402 401<br />
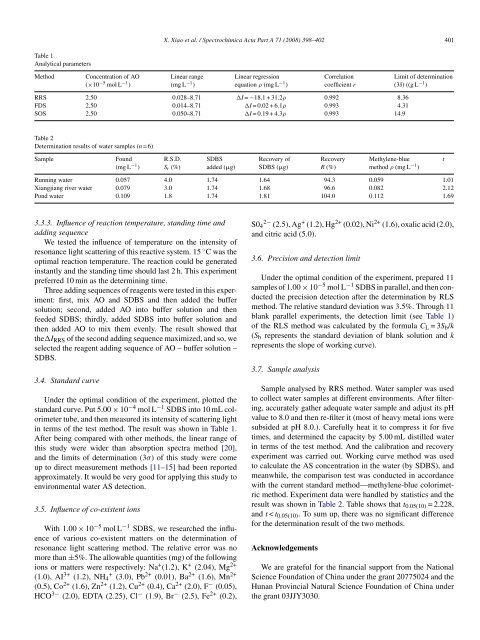
Table 1<br />
Analytical parameters<br />
Method<br />
Concentration <strong>of</strong> AO<br />
(×10 −5 mol L −1 )<br />
Linear range<br />
(mg L −1 )<br />
Linear regression<br />
equation ρ (mg L −1 )<br />
Correlation<br />
coefficient r<br />
Limit <strong>of</strong> <strong>determination</strong><br />
(3δ) ((g L −1 )<br />
RRS 2.50 0.028–8.71 I = −18.1 + 31.2ρ 0.992 8.36<br />
FDS 2.50 0.014–8.71 I = 0.02 + 6.1ρ 0.993 4.31<br />
SOS 2.50 0.050–8.71 I = 0.19 + 4.3ρ 0.993 14.9<br />
Table 2<br />
Determination results <strong>of</strong> water samples (n =6)<br />
Sample<br />
Found<br />
(mg L −1 )<br />
R.S.D.<br />
S r (%)<br />
SDBS<br />
added (g)<br />
Recovery <strong>of</strong><br />
SDBS (g)<br />
Recovery<br />
R (%)<br />
Methylene-blue<br />
<strong>method</strong> ρ (mg L −1 )<br />
t<br />
Running water 0.057 4.0 1.74 1.64 94.3 0.059 1.01<br />
Xiangjiang river water 0.079 3.0 1.74 1.68 96.6 0.082 2.12<br />
Pond water 0.109 1.8 1.74 1.81 104.0 0.112 1.69<br />
3.3.3. Influence <strong>of</strong> reaction temperature, standing time and<br />
adding sequence<br />
We tested <strong>the</strong> influence <strong>of</strong> temperature on <strong>the</strong> intensity <strong>of</strong><br />
resonance <strong>light</strong> <strong>scattering</strong> <strong>of</strong> this reactive system. 15 ◦ C was <strong>the</strong><br />
optimal reaction temperature. The reaction could be generated<br />
instantly and <strong>the</strong> standing time should last 2 h. This experiment<br />
preferred 10 min as <strong>the</strong> determining time.<br />
Three adding sequences <strong>of</strong> reagents were tested in this experiment:<br />
first, mix AO and SDBS and <strong>the</strong>n added <strong>the</strong> buffer<br />
solution; second, added AO into buffer solution and <strong>the</strong>n<br />
feeded SDBS; thirdly, added SDBS into buffer solution and<br />
<strong>the</strong>n added AO to mix <strong>the</strong>m evenly. The result showed that<br />
<strong>the</strong>I RRS <strong>of</strong> <strong>the</strong> second adding sequence maximized, and so, we<br />
selected <strong>the</strong> reagent adding sequence <strong>of</strong> AO – buffer solution –<br />
SDBS.<br />
3.4. Standard curve<br />
Under <strong>the</strong> optimal condition <strong>of</strong> <strong>the</strong> experiment, plotted <strong>the</strong><br />
standard curve. Put 5.00 × 10 −4 mol L −1 SDBS into 10 mL colorimeter<br />
tube, and <strong>the</strong>n measured its intensity <strong>of</strong> <strong>scattering</strong> <strong>light</strong><br />
in terms <strong>of</strong> <strong>the</strong> test <strong>method</strong>. The result was shown in Table 1.<br />
After being compared with o<strong>the</strong>r <strong>method</strong>s, <strong>the</strong> linear range <strong>of</strong><br />
this study were wider than absorption spectra <strong>method</strong> [20],<br />
and <strong>the</strong> limits <strong>of</strong> <strong>determination</strong> (3σ) <strong>of</strong> this study were come<br />
up to direct measurement <strong>method</strong>s [11–15] had been reported<br />
approximately. It would be very good <strong>for</strong> applying this study to<br />
environmental water AS detection.<br />
3.5. Influence <strong>of</strong> co-existent ions<br />
With 1.00 × 10 −5 mol L −1 SDBS, we researched <strong>the</strong> influence<br />
<strong>of</strong> various co-existent matters on <strong>the</strong> <strong>determination</strong> <strong>of</strong><br />
resonance <strong>light</strong> <strong>scattering</strong> <strong>method</strong>. The relative error was no<br />
more than ±5%. The allowable quantities (mg) <strong>of</strong> <strong>the</strong> following<br />
ions or matters were respectively: Na + (1.2), K + (2.04), Mg 2+<br />
(1.0), AI 3+ (1.2), NH 4 + (3.0), Pb 2+ (0.01), Ba 2+ (1.6), Mn 2+<br />
(0.5), Co 2+ (1.6), Zn 2+ (1.2), Cu 2+ (0.4), Ca 2+ (2.0), F − (0.05),<br />
HCO 3− (2.0), EDTA (2.25), Cl − (1.9), Br − (2.5), Fe 2+ (0.2),<br />
S0 4 2− (2.5), Ag + (1.2), Hg 2+ (0.02), Ni 2+ (1.6), oxalic acid (2.0),<br />
and citric acid (5.0).<br />
3.6. Precision and detection limit<br />
Under <strong>the</strong> optimal condition <strong>of</strong> <strong>the</strong> experiment, prepared 11<br />
samples <strong>of</strong> 1.00 × 10 −5 mol L −1 SDBS in parallel, and <strong>the</strong>n conducted<br />
<strong>the</strong> precision detection after <strong>the</strong> <strong>determination</strong> by RLS<br />
<strong>method</strong>. The relative standard deviation was 3.5%. Through 11<br />
blank parallel experiments, <strong>the</strong> detection limit (see Table 1)<br />
<strong>of</strong> <strong>the</strong> RLS <strong>method</strong> was calculated by <strong>the</strong> <strong>for</strong>mula C L =3S b /k<br />
(S b represents <strong>the</strong> standard deviation <strong>of</strong> blank solution and k<br />
represents <strong>the</strong> slope <strong>of</strong> working curve).<br />
3.7. Sample analysis<br />
Sample analysed by RRS <strong>method</strong>. Water sampler was used<br />
to collect water samples at different environments. After filtering,<br />
accurately ga<strong>the</strong>r adequate water sample and adjust its pH<br />
value to 8.0 and <strong>the</strong>n re-filter it (most <strong>of</strong> heavy metal ions were<br />
subsided at pH 8.0.). Carefully heat it to compress it <strong>for</strong> five<br />
times, and determined <strong>the</strong> capacity by 5.00 mL distilled water<br />
in terms <strong>of</strong> <strong>the</strong> test <strong>method</strong>. And <strong>the</strong> calibration and recovery<br />
experiment was carried out. Working curve <strong>method</strong> was used<br />
to calculate <strong>the</strong> AS concentration in <strong>the</strong> water (by SDBS), and<br />
meanwhile, <strong>the</strong> comparison test was conducted in accordance<br />
with <strong>the</strong> current standard <strong>method</strong>—methylene-blue colorimetric<br />
<strong>method</strong>. Experiment data were handled by statistics and <strong>the</strong><br />
result was shown in Table 2. Table shows that t 0.05(10) = 2.228,<br />
and t < t 0.05(10) . To sum up, <strong>the</strong>re was no significant difference<br />
<strong>for</strong> <strong>the</strong> <strong>determination</strong> result <strong>of</strong> <strong>the</strong> two <strong>method</strong>s.<br />
Acknowledgements<br />
We are grateful <strong>for</strong> <strong>the</strong> financial support from <strong>the</strong> National<br />
Science Foundation <strong>of</strong> China under <strong>the</strong> grant 20775024 and <strong>the</strong><br />
Hunan Provincial Natural Science Foundation <strong>of</strong> China under<br />
<strong>the</strong> grant 03JJY3030.