Section C_Situational Analysis.pdf - Zululand District Municipality
Section C_Situational Analysis.pdf - Zululand District Municipality
Section C_Situational Analysis.pdf - Zululand District Municipality

Create successful ePaper yourself
Turn your PDF publications into a flip-book with our unique Google optimized e-Paper software.
ZULULAND IDP REVIEW 2013/2014<br />
SECTION C: SITUATIONAL ANALYSIS<br />
1. SPATIAL ANALYSIS<br />
1.1 REGIONAL CONTEXT<br />
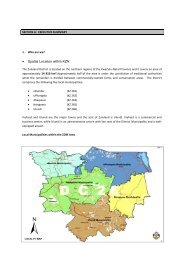
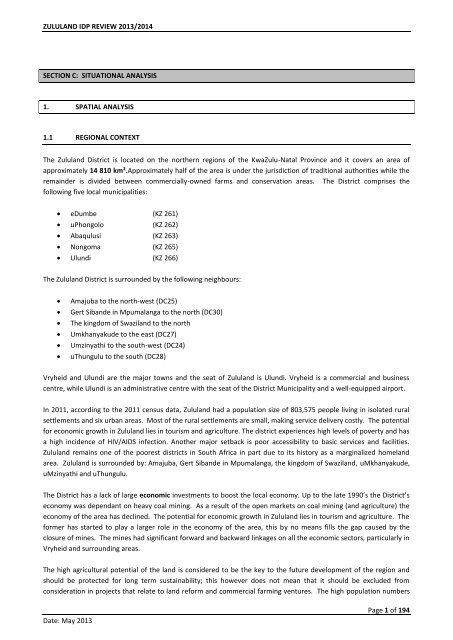
The <strong>Zululand</strong> <strong>District</strong> is located on the northern regions of the KwaZulu-Natal Province and it covers an area of<br />
approximately 14 810 km².Approximately half of the area is under the jurisdiction of traditional authorities while the<br />
remainder is divided between commercially-owned farms and conservation areas. The <strong>District</strong> comprises the<br />
following five local municipalities:<br />
eDumbe (KZ 261)<br />
uPhongolo (KZ 262)<br />
Abaqulusi (KZ 263)<br />
Nongoma (KZ 265)<br />
Ulundi (KZ 266)<br />
The <strong>Zululand</strong> <strong>District</strong> is surrounded by the following neighbours:<br />
<br />
<br />
<br />
<br />
<br />
<br />
Amajuba to the north-west (DC25)<br />
Gert Sibande in Mpumalanga to the north (DC30)<br />
The kingdom of Swaziland to the north<br />
Umkhanyakude to the east (DC27)<br />
Umzinyathi to the south-west (DC24)<br />
uThungulu to the south (DC28)<br />
Vryheid and Ulundi are the major towns and the seat of <strong>Zululand</strong> is Ulundi. Vryheid is a commercial and business<br />
centre, while Ulundi is an administrative centre with the seat of the <strong>District</strong> <strong>Municipality</strong> and a well-equipped airport.<br />
In 2011, according to the 2011 census data, <strong>Zululand</strong> had a population size of 803,575 people living in isolated rural<br />
settlements and six urban areas. Most of the rural settlements are small, making service delivery costly. The potential<br />
for economic growth in <strong>Zululand</strong> lies in tourism and agriculture. The district experiences high levels of poverty and has<br />
a high incidence of HIV/AIDS infection. Another major setback is poor accessibility to basic services and facilities.<br />
<strong>Zululand</strong> remains one of the poorest districts in South Africa in part due to its history as a marginalized homeland<br />
area. <strong>Zululand</strong> is surrounded by: Amajuba, Gert Sibande in Mpumalanga, the kingdom of Swaziland, uMkhanyakude,<br />
uMzinyathi and uThungulu.<br />
The <strong>District</strong> has a lack of large economic investments to boost the local economy. Up to the late 1990’s the <strong>District</strong>’s<br />
economy was dependant on heavy coal mining. As a result of the open markets on coal mining (and agriculture) the<br />
economy of the area has declined. The potential for economic growth in <strong>Zululand</strong> lies in tourism and agriculture. The<br />
former has started to play a larger role in the economy of the area, this by no means fills the gap caused by the<br />
closure of mines. The mines had significant forward and backward linkages on all the economic sectors, particularly in<br />
Vryheid and surrounding areas.<br />
The high agricultural potential of the land is considered to be the key to the future development of the region and<br />
should be protected for long term sustainability; this however does not mean that it should be excluded from<br />
consideration in projects that relate to land reform and commercial farming ventures. The high population numbers<br />
Date: May 2013<br />
Page 1 of 194
ZULULAND IDP REVIEW 2013/2014<br />
and livestock concentrations in the freehold settlements highlight the need for additional land, and create possible<br />
opportunities for the development of commonage schemes. In addition tenure upgrade projects could be considered<br />
for tenants presently living on portions of the freehold land.<br />
A large percentage of the district is communal land. Within these areas there is considerable pressure to extend<br />
grazing rights into adjoining areas. Strategies to deal with the need to accommodate the increasing demands for<br />
grazing land need particular attention. This will require extensive consultation between all key role players in the<br />
region.<br />
Map 1: Local Municipalities within the ZDM Area<br />
1.2 ADMINISTRATIVE ENTITIES<br />
The Council of the <strong>Zululand</strong> <strong>District</strong> <strong>Municipality</strong> consists of 34 Councilors, 40% of which are proportionally elected<br />
and 60% elected to the district municipality from respective local municipalities. The Council is chaired by the Speaker,<br />
The Honourable Cllr. H. Hlatshwayo.<br />
The Municipal area consists of scattered rural settlement in Traditional Authority Areas. The following is a list of<br />
Traditional Councils in the <strong>Zululand</strong> <strong>District</strong> <strong>Municipality</strong>:<br />
Mthethwa Mlaba<br />
Mavuso Ndebele<br />
Msibi Nobamba<br />
Ndlangamandla Sibiya<br />
Date: May 2013<br />
Page 2 of 194
ZULULAND IDP REVIEW 2013/2014<br />
Ntshangase Ndlangamandla Ext<br />
Simelane Disputed Area<br />
Hlahlindlela Khambi<br />
Matheni Khambi Ext<br />
Mandhlakazi<br />
Usuthu<br />
Zungu<br />
Buthelezi Mbatha<br />
Map 2: Administrative Entities<br />
The south-eastern part of the Municipal Area, a small portion to the central-west and portion in the central-north<br />
constitutes Ingonyama Trust Land. It is particularly the Ulundi and Nongoma LMs that have large tracts of Ingonyama<br />
Trust Land upon which scattered, relatively low density rural settlement is evident.<br />
Map 3: Municipal Ward Boundaries (2011)<br />
Date: May 2013<br />
Page 3 of 194
ZULULAND IDP REVIEW 2013/2014<br />
1.3 STRUCTURING ELEMENTS<br />
The following Structuring Elements within the Municipal Area have been noted:<br />
<br />
<br />
<br />
<br />
<br />
<br />
<br />
<br />
<br />
<br />
<br />
There are more than 20 Traditional Council areas in the ZDM<br />
The central and north-western parts of the Municipal area are mountainous with slope of 1:3 and steeper. The<br />
slopes decrease (become less steep) towards the eastern half of the ZDM Area.<br />
Large disparities are apparent in terms of the nature and structure of the built environment with the most<br />
significant disparity between the level of services and development in the rural and urban areas of the <strong>District</strong>.<br />
The towns have comparatively good levels of infrastructure and services.<br />
There are a number of roads that are of strategic importance to the <strong>Municipality</strong>, and that should receive priority<br />
as far as the <strong>Municipality</strong> is concerned, i.e. Nongoma – uPhongola link, Nongoma – Vryheid link and Ceza R66<br />
road.<br />
The most important rail link is the coal line from Mpumalanga Province through Vryheid to Richards Bay Coal<br />
Terminal from where the product is exported.<br />
International border post at Golela.<br />
Attractions relating to Zulu cultural heritage in Ulundi and Nongoma Local <strong>Municipality</strong> respectively<br />
Ulundi airport as well as Vryheid airport.<br />
Higher potential agricultural land in south west of ZDM area<br />
Ithala game reserve<br />
Date: May 2013<br />
Page 4 of 194
ZULULAND IDP REVIEW 2013/2014<br />
<br />
<br />
Pongolapoort dam and Bivane dam<br />
Pongolo, uMfolozi and Mkhuze Rivers<br />
1.4 NODES AND CORRIDORS (AS PER THE KZN PGDS)<br />
The various nodes and their broad intended function and possible interventions are described by the table below:<br />
Intervention<br />
Node<br />
Primary Node<br />
Secondary<br />
Nodes<br />
Broad Intended Function<br />
Only eThekwini is classified as a Primary Node within the Provincial Context as an urban centre with<br />
very high existing economic growth and the potential for expansion thereof. Provides service to the<br />
national and provincial economy. The main categories of potential within this node includes:<br />
<br />
<br />
<br />
<br />
<br />
<br />
Production of high value, differentiated goods,<br />
Production of labour intensive, mass produced goods,<br />
Innovation and experimentation,<br />
Retail and private sector services,<br />
Tourism,<br />
Public service and administration<br />
Richards Bay, Msunduzi, Newcastle and Port Shepstone has been identified as provincial Secondary<br />
Nodes and thus urban centres with good existing economic development and the potential for<br />
growth and services to the regional economy.<br />
Tertiary<br />
Nodes<br />
Date: May 2013<br />
Key strategic interventions specifically targeted at these nodes might include:<br />
<br />
<br />
<br />
<br />
<br />
<br />
<br />
<br />
<br />
<br />
<br />
<br />
<br />
Primary Economic Growth Area<br />
Priority Socio-Economic Development Spending<br />
Promote as Primary Node in support of Corridor Development<br />
Promote Compact Urban Development & Combat Urban Sprawl<br />
Promote Focused Investment & Managed Growth<br />
Promote Densification (Brown Agenda) and Infill Development<br />
Provide Economies of Scale for Effective & Affordable Service Delivery<br />
Infill where High Levels of Services are Available (Restructuring Nodes)<br />
Increased Residential Density (number of dwellings)<br />
Promote provision of sufficient Bulk Infrastructure Services (Demand & Supply)<br />
Priority spending on Infrastructural Upgrading Needs (New & Maintain)<br />
Promote Effective & Efficient Public Transportation Systems linked to Multi Modal Facilities<br />
Single Land Use Management System (Township Formalization)<br />
These nodes are mainly centres which should provide service to the sub-regional economy and<br />
community needs and is represented by the following towns:<br />
<br />
<br />
<br />
<br />
<br />
<br />
<br />
<br />
Pongola<br />
Vryheid,<br />
Ulundi,<br />
Dundee,<br />
Ladysmith,<br />
Estcourt,<br />
Howick,<br />
Kwadukuza,<br />
Page 5 of 194
ZULULAND IDP REVIEW 2013/2014<br />
Intervention<br />
Node<br />
Broad Intended Function<br />
<br />
<br />
<br />
<br />
<br />
Ixopo,<br />
Scottburgh,<br />
Hibberdene,<br />
Kokstad,<br />
Margate.<br />
Key strategic interventions specifically targeted at these nodes and their directly surrounding areas<br />
might include:<br />
Quaternary<br />
Nodes<br />
<br />
<br />
<br />
<br />
<br />
<br />
<br />
<br />
<br />
<br />
<br />
<br />
<br />
Secondary Economic Growth Areas<br />
Promote as Secondary Node in support of Corridor Development<br />
Promote Compact Urban Development & Combat Urban Sprawl<br />
Promote Focused Investment & Managed Growth<br />
Promote Densification (Brown Agenda) & Infill Development<br />
Provide Economies of Scale for Effective & Affordable Service Delivery<br />
Infill where High Levels of Services are Available (Restructuring Nodes)<br />
Increased Residential Density (number of dwellings)<br />
Promote Socio-Economic Upliftment<br />
Promote provision of sufficient Bulk Infrastructure Services (Demand & Supply)<br />
Priority spending on Infrastructural Upgrading Needs (New & Maintain)<br />
Promote Effective & Efficient Public Transportation Systems linked to Multi Modal Facilities<br />
Single Land Use Management System (Township Formalisation)<br />
Social inclusion Areas focus Investment in People rather than Places<br />
These nodes are mainly centres which should provide service to the local economy and community<br />
needs and is represented by 31 towns, including but not limited to:<br />
<br />
<br />
<br />
<br />
<br />
Nongoma,<br />
Nkandla,<br />
Bergville,<br />
Greytown,<br />
Underberg,<br />
uMzimkulu<br />
Key strategic interventions specifically targeted at these nodes and their directly surrounding areas<br />
might include:<br />
Focused investment in areas of Poverty Concentrations<br />
<br />
<br />
<br />
<br />
<br />
<br />
<br />
<br />
<br />
<br />
Promote Integration (Green Agenda)<br />
Integration in terms of Mixed Densities & Uses<br />
Improve Transportation linkages to Nodes<br />
Promote Social-economic Integration<br />
Eradicate Backlogs & Promote Basic Service Infrastructure & Delivery<br />
Promote Socio-Economic Upliftment<br />
Promote provision of sufficient Bulk Infrastructure Services (Demand & Supply)<br />
Priority spending on Infrastructural Upgrading Needs (New & Maintain)<br />
Rural Service Delivery Point<br />
Promote & Establish PPP’s<br />
Date: May 2013<br />
Page 6 of 194
ZULULAND IDP REVIEW 2013/2014<br />
Intervention<br />
Node<br />
Rural Service<br />
Centres<br />
Broad Intended Function<br />
<br />
Promote Cultural & Community Based Tourism<br />
The proposed rural service centres are envisaged to serves as the lowest level of provincial nodes<br />
and could typically be established around existing traditional administration centres as well as other<br />
accessible rural points identified as periodic markets. These will be identified in consultation with<br />
the district municipalities and should serve as first access to basic services within rural areas. These<br />
rural service centres will include, as some have already emerged to include, a combination of the<br />
following activities:<br />
<br />
<br />
<br />
<br />
<br />
<br />
<br />
<br />
Traditional administration centre,<br />
Taxi/ bus stop,<br />
Informal trading / market area,<br />
Social facility (clinic, library etc),<br />
Skills development centre (mainly local schools),<br />
Mobile services point (mobile clinics, pension pay points, mobile library etc)<br />
Small commercial facility<br />
Recreational facility such as a sport field.<br />
Date: May 2013<br />
Page 7 of 194
ZULULAND IDP REVIEW 2013/2014<br />
Map 4: KZN Spatial Development Framework<br />
The southern, south-western and northern corridors along the ZDM boundaries, have been demarcated as<br />
provincial “Priority Conservation Areas”. This is quite significant if compared to the rest of the province.<br />
The central and south-eastern parts of the ZDM area have been demarcated as “Social Investment Areas”,<br />
whilst the area surrounding Vryheid and to the east thereof, have been demarcated as “economic Support<br />
Areas.<br />
The Broad Provincial Spatial Planning Categories (BPSPCs) which are indicated within the above illustrated provincial<br />
spatial development framework should be interpreted as follow:<br />
Date: May 2013<br />
Page 8 of 194
ZULULAND IDP REVIEW 2013/2014<br />
Table 1: Interpretation of the Broad Spatial Planning Categories<br />
Spatial<br />
Planning<br />
Category<br />
Conservation<br />
Corridors<br />
Biodiversity<br />
Priority Areas<br />
Areas of<br />
Economic<br />
Value Adding<br />
Broad Intended Land Use and Interventions<br />
Proposed regional critical conservation areas which are linked in a continuous system of<br />
ecosystems and bioregions traversing the province between the Drakensberg and the Indian<br />
Ocean. These areas were identified combining existing environmentally protected areas as well as<br />
conservation corridors proposed by Ezemvelo KZN Wildlife, through combining extensive<br />
environmental research into bio-resources throughout the province as part of the formulation of a<br />
Critical Biodiversity Plan for the province. These Conservation Corridors are not suggested as<br />
absolute “no-go” areas, but rather highlighted as areas of environmental significance to the<br />
sustainable development of the entire province. Where economic opportunity (such as tourism<br />
development) and high social need exist within these Conservation Corridors, it implies both that<br />
the rich natural environment should contribute to the address such needs and potential, and<br />
further that any interventions in these areas need to consider the impact on such important<br />
regional ecological corridors. These corridors are however perceived as areas where extensive<br />
densification would be discouraged and sensitive development promoted.<br />
Areas with a significantly high biodiversity value expressed in the number of species and sensitive<br />
environments as identified through extensive research by Ezemvelo KZN Wildlife. These areas are<br />
most often located in close proximity to the identified Conservation Corridors and may serve as an<br />
additional buffer to these corridors. These areas too are not (at a provincial level) proposed as<br />
absolute “no-go” areas, but are identified to indicate areas where extensive densification would<br />
be discouraged and sensitive development promoted.<br />
The key economic centres and areas where all of the variety of economic sectors (Agriculture,<br />
Tourism, Manufacturing, Services) are prevalent and perceived to have good potential to be<br />
further expanded on. These areas are visibly linked to high accessibility areas with existing bulk<br />
infrastructure and relatively high population densities which would both contribute to the<br />
economic expansion and benefit from interventions in these areas. Due to these factors, further<br />
economic processing and value adding at a provincial level, are mainly proposed within these<br />
identified areas.<br />
Areas<br />
Economic<br />
Support<br />
of<br />
A number of regions resembled areas of good economic potential in more than just one of the key<br />
provincial economic sectors. Due to the fact that these areas represent a larger distribution across<br />
the entire province than the core areas of economic value adding, these zones are considered<br />
important areas of Economic Support. Typical interventions in these areas would include<br />
economic prioritisation of development, labour force interventions (e.g. skills development), key<br />
economic infrastructure investment and area promotion.<br />
Areas of<br />
Agricultural<br />
Development<br />
Areas of High<br />
Social Need<br />
Relatively high agricultural production areas, which are not located within biodiversity areas of<br />
combined with other potential economic sectors are highlighted by this category to identify and<br />
promote areas with the potential to make a significant contribution through agricultural<br />
production. Although successful farming practices are already occurring on some of these areas, it<br />
is proposed that underutilized agricultural land within these zones are more effectively utilized for<br />
sustainable agricultural production. Associated interventions may include agriculture specific<br />
infrastructure, skills development, market access interventions etc.<br />
The highest ranges of combined social need when considering the population density,<br />
dependency ratio as the provincial index of multiple deprivation is illustrated by this category of<br />
high social need. These area broadly the areas where the most intensive social interventions area<br />
Date: May 2013<br />
Page 9 of 194
ZULULAND IDP REVIEW 2013/2014<br />
Spatial<br />
Planning<br />
Category<br />
Broad Intended Land Use and Interventions<br />
required and this category is further overlayed above all other categories to provide a spatial<br />
reference to the types of interventions which might be pursued towards addressing the<br />
concentrated social need within these areas. As example where high social need is identified<br />
within an area earmarked as a conservation corridor, this firstly provides a reference to the fact<br />
that social conditions of communities will need to be addressed if any conservation is to be<br />
promoted within such areas. Further it suggests that the effective utilisation of the high<br />
biodiversity within such areas might be harnessed towards addressing social need through<br />
example conservation tourism.<br />
Mandated<br />
Service<br />
Delivery Areas<br />
The areas which are not representative of any of the above mentioned categories are classified as<br />
undifferentiated areas. It is acknowledged that these areas also have communities residing on<br />
them with economic potential and environmental resources, however, based on the approach<br />
followed these areas weren’t differentiated to the same degree as the identified preceding<br />
categories. It is therefore important that this category is not neglected from public and private<br />
interventions and as the various departmental programmes are inclusive in nature, these areas<br />
should also benefit from it. It is anticipated that the intensity of such programmes and the total<br />
portion of resource allocation to these areas would be less than the identified categories as well<br />
as the key intervention areas identified previously.<br />
Date: May 2013<br />
Page 10 of 194
ZULULAND IDP REVIEW 2013/2014<br />
Map 5: <strong>Zululand</strong> <strong>District</strong> <strong>Municipality</strong> - Priority Intervention Areas (as per the KZN PGDS)<br />
Date: May 2013<br />
Page 11 of 194
ZULULAND IDP REVIEW 2013/2014<br />
In promoting growth and development within the <strong>Zululand</strong> <strong>District</strong> as well as supporting the proposed spatial<br />
structure and areas in need of intervention, the following provincial catalytic projects are envisaged within the district:<br />
<br />
<br />
<br />
<br />
<br />
<br />
<br />
<br />
<br />
<br />
<br />
<br />
<br />
<br />
<br />
<br />
P700 Road Linkage<br />
Airport Development (Ulundi)<br />
Nature Based Tourism (P700)<br />
Eco, Battlefields & Cultural Heritage Tourism Routes<br />
Agro-Processing incorporating Bio-Fuels<br />
Industrial Regeneration<br />
Small Town Regeneration<br />
Regional Airports<br />
Rural Service Centers<br />
ECD Centre Development<br />
Centres for the Disabled<br />
Centres for Senior Citizens<br />
Substance abuse Rehabilitation Centres<br />
Cultural Villages<br />
School Greening<br />
Rural Waste Management Units<br />
Map 6: KZN Nodal Hierarchy<br />
Given the urbanisation trends as<br />
well as the already significant<br />
contribution which major urban<br />
centres such as eThekwini,<br />
Msunduzi and Richards Bay make to<br />
the regional economy of the<br />
province, as well as the fact that<br />
these areas also accommodated<br />
concentrations of poverty stricken<br />
areas, these centres should not be<br />
neglected. The Provincial Spatial<br />
Economic Development Strategy<br />
(PSEDS) has identified a hierarchy of<br />
provincial nodes which contribute<br />
strategically to the provincial,<br />
regional and local economies as well<br />
as service as vital service centres to<br />
communities. These nodes, in<br />
relation to the Level 1 and 2 Priority<br />
Interventions areas, are illustrated<br />
on the adjacent map.<br />
It noted that 3 towns within the<br />
ZDM area are considered as<br />
Provincial Tertiary Nodes, namely<br />
Ulundi, Vryheid and Pongola.<br />
Date: May 2013<br />
Page 12 of 194
ZULULAND IDP REVIEW 2013/2014<br />
1.5 BROAD LAND USE<br />
Map 7: Broad Land Use Classification<br />
It is evident, from the above map, that large tracts of commercial farmland are located in the north-western part of<br />
the Municipal Area vis-à-vis the area between Vryheid and Paulpietersburg. Other commercial farmland is evident<br />
south of Enyahti. Scattered rural settlement is evident within the eastern half of Ulundi LM, as well as the whole of<br />
the Nongoma LM. These areas coincide with the Ingonyama Trust land. Denser settlement is evident around the<br />
towns of Ulundi, Emondlo and Vryheid. Subsistence agriculture is very evident in the Nongoma LM.<br />
1.6 LAND OWNERSHIP<br />
The south-eastern part of the Municipal Area, a small portion to the central-west and portion in the central-north<br />
constitutes Ingonyama Trust Land. It is particularly the Ulundi and Nongoma LMs that have large tracts of Ingonyama<br />
Trust Land upon which scattered, relatively low density rural settlement is evident. The remaining areas are mainly<br />
used for commercial farming and are in private ownership.<br />
Date: May 2013<br />
Page 13 of 194
ZULULAND IDP REVIEW 2013/2014<br />
1.7 LAND CAPABILITY<br />
Map 8: Land Capability<br />
Good to High Potential Agricultural land is particularly evident in the north-western parts of the Municipal Area, i.e.<br />
the area from Emondlo to Paulpietersburg. There is also some land to the south of Emondlo (as well as surrounding<br />
the town) which is classified as very high potential agricultural land. Most of these tracts of is used for commercial<br />
agricultural purposes.<br />
Date: May 2013<br />
Page 14 of 194
ZULULAND IDP REVIEW 2013/2014<br />
1.8 ENVIRONMENTAL ANALYSIS<br />
1.8.1 ENVIRONMENTAL PRINCIPLES<br />
The guiding principle for development in the ZDM is that it should be conducted in a sustainable manner. It is<br />
important to consider what the concept of sustainable development means for the ZDM and how this concept should<br />
be taken forward. The definition of sustainable development which has become the best known and most widely used<br />
is that of the Bruntland Report which defines sustainable development as:<br />
‘Development which meets the needs of the present without compromising the ability of future generations to<br />
meet their own needs’ (World Commission on Environment and Development, 1987).<br />
Hence, the following principles apply:<br />
<br />
<br />
<br />
<br />
<br />
<br />
<br />
<br />
Development must not degrade biophysical, built, social, economic resources or the system of governance on<br />
which it is based;<br />
Current actions should not cause irreversible damage to natural and other resources, as this may preclude<br />
future development options;<br />
In cases where there is uncertainty of the impacts of an activity on the environment, caution should be<br />
exercised in favour of the environment;<br />
The cost of pollution should be paid by the party causing the pollution;<br />
The needs of land use, environment and economic planning need to be integrated;<br />
A development framework and paradigm which promotes resource generation rather than resource<br />
degradation must be created;<br />
Immediate and long term actions need to be identified and planned for, to address urgent needs while still<br />
progressing towards longer term sustainable solutions;<br />
Resources must be utilized more effectively through each sector applying its resources to support other<br />
sectors rather than acting in an uncoordinated or competitive manner.<br />
1.8.2 ENVIRONMENTAL VISION<br />
The environmental vision for the <strong>Zululand</strong> <strong>District</strong> <strong>Municipality</strong> is therefore, in short, “the conservation of biodiversity<br />
to enhance the well-being of the people in <strong>Zululand</strong>”.<br />
In order to achieve this vision, priority actions for planning and management authorities are to:<br />
<br />
<br />
<br />
<br />
<br />
<br />
<br />
<br />
<br />
Protect and restore indigenous vegetation and terrestrial ecosystems and associated processes;<br />
Protect and restore freshwater ecosystems and associated processes;<br />
Protect and restore endemic and threatened species;<br />
Reduce waste generation and disposal and improve solid waste sites and management;<br />
Promote better water use and conservation;<br />
Control alien invasive species;<br />
Promote ecologically sustainable grazing, crop and forestry production systems;<br />
Ensure that all citizens have access to formal sanitation facilities, housing and medical advice and assistance<br />
where possible; and<br />
Minimize the impacts of climate change on biodiversity<br />
Date: May 2013<br />
Page 15 of 194
ZULULAND IDP REVIEW 2013/2014<br />
1.8.3 TOPOGRAPHY<br />
Map 9 ZDM Topography Map<br />
The slope categories range from smaller than 1:10 (10% incline), 1:6 (17% incline), 1:3 (33% incline) and steeper. The<br />
higher the gradient, the more difficult and more expensive construction and the provision of services becomes.<br />
Slope also affects modes of transport, as a maximum gradient of 5% is recommended for bicycle tracks and 8% is<br />
recommended for footpaths. Terrain therefore plays an integral part in determining settlement patterns or the line of<br />
road construction to ensure cost-effectiveness and functionality.<br />
The central and north-western parts of the Municipal area are mountainous with slope of 1:3 and steeper. The slopeS<br />
decrease (become less steep) towards the eastern half of the Municipal Area.<br />
1.8.4 STRATEGIC ENVIRONMENTAL ASSESSMENT (SEA)<br />
The main Issues within the municipality were identified within the following categories: Housing, Soil, Water, Waste,<br />
Biodiversity and Tourism. The Fundamental Tools to be considered when contemplating each issue and acting on<br />
these issues are: Awareness, Regulation and Enforcement, Sustainability, and Delivery. Some of the Main Issues fall<br />
under more than one category, for example, “Wetland Degradation” might fall under Water, Soil and Biodiversity and<br />
even Tourism and Housing, as it is quite often housing developments that damage wetlands, and loss of the wetland<br />
systems could affect tourism.<br />
Date: May 2013<br />
Page 16 of 194
ZULULAND IDP REVIEW 2013/2014<br />
Map 10: Environmental Resources<br />
It is evident from the above map that the ZDM Area has large tracts of Biodiversity 1 and 3 designated areas. The<br />
eastern parts of the uPhongla LM, adjacent and including the Pongola Poort Dam are classified as a Biodiversity 1 area.<br />
There is also an area to the north of Ceza, within the Abaqulusi LM, as well as an area north of Emondlo, also within<br />
the uPhongola LM, that are also classified as Biodiversity 1 areas. Large tracts of the eastern half of the ZDM<br />
Municipal Area are also classified as Biodiversity 3 areas. Protected areas withint he Municipal Area, are:<br />
<br />
<br />
<br />
<br />
<br />
<br />
Emakhosini Heritage Park;<br />
Opathe Game Reserve;<br />
Vryheid Mountain Nature Reserve;<br />
Ithala Game Reserve;<br />
Phongolo Game Reserve; and<br />
Phongolapoort Nature Reserve.<br />
1.8.5 EZEMVELO KZN WILDLIFE: BIODIVERSITY SECTOR PLAN FOR THE ZULULAND DISTRICT MUNICIPALITY<br />
The above report was completed in February 2010 and made the following Recommendations with regards<br />
to Biodiversity in the <strong>Zululand</strong> Ditrict Municipal Area:<br />
Date: May 2013<br />
Page 17 of 194
ZULULAND IDP REVIEW 2013/2014<br />
The following is essential to achieving biodiversity targets in the long term:<br />
a) Conservation efforts must be focused on CBAs and ESAs identified within the BSP, focusing on ‘at risk’ areas,<br />
considering the most important areas for conservation. In order to create a conservation management priority<br />
map, biodiversity features were firstly ranked according to their perceived biodiversity significance, where after<br />
each specific ranking was assigned a value (Classification) and an intersect analysis was performed. The<br />
classification values from all layers within the intersecting areas were then summed, and from this output it was<br />
possible to identify priority areas for conservation management according to the values of the summed<br />
classifications. The Provincial CPlan Irreplaceable Areas and Aquatic Plan Earmarked Areas were ranked highest,<br />
followed by the various CBAs, and finally corridor ESAs under threat (designated as CBAs). This exercise<br />
highlighted a number of key focus areas (red – highest priority, dark green – lower priority), illustrated in Figure<br />
34. Ezemvelo KZN Wildlife should increase their presence in these areas through regular monitoring and<br />
interaction with landowners, and management inputs should focus on controlling further land transformation and<br />
degradation.<br />
b) Development threats, particularly from areas designated for development in the SDF and IDP, and as a<br />
consequence of potential rural settlement expansion, must be addressed at a strategic planning level to ensure<br />
that development does not take place at the expense of critical biodiversity asset.<br />
c) Land use and environmental management guidelines provided in the BSP must be integrated into multi-sectoral<br />
planning, including EKZNW conservation programmes, the municipal Integrated Development Plan and Spatial<br />
Development Plan, and the Provincial Spatial Economic Development strategy; this should be monitored by<br />
EKZNW.<br />
d) Water quality management is essential in the Aquatic Ecological Support Areas, Wetland CBA and the Earmarked<br />
Aquatic Planning Units. Management actions should focus on reducing soil erosion and chemical and microbial<br />
inputs, and the management of associated terrestrial vegetation to ensure sustained inflow of clean water.<br />
e) Opportunities for conservation-oriented local economic development must be explored within CBAs and ESAs,<br />
particularly within areas adjacent to Protected Areas, areas earmarked for the Stewardship and Protected Areas<br />
Expansion Programmes, and areas contributing to sustainable rural livelihoods, keeping in mind the need to<br />
secure land within formal conservation land use across the entire biophysical gradient. Conservation land use<br />
must be investigated as a tool for economic empowerment of local communities.<br />
f) Payment for ecosystem services should be explored by EKZNW in conjunction with private land owners and local<br />
communities, emphasizing potential socio-economic benefits.<br />
g) The ecological linkages identified on the interface between the <strong>District</strong> and adjacent municipalities, and<br />
Swaziland, must be taken into account in conservation planning adjacent <strong>District</strong>s.<br />
h) The importance of conserving endemic vegetation types within the municipality must comprise a core focus of<br />
EKZNW; any activity that could result in a further loss of these vegetation types must be critically evaluated, and<br />
rehabilitation efforts to reclaim degraded areas must be considered.<br />
i) Additional water impoundments and proposed abstraction schemes within the <strong>District</strong> must be critically<br />
evaluated.<br />
j) The EKZNW CPlan should be re-run at the <strong>District</strong> level, based on any new data, and biodiversity targets scaled to<br />
the <strong>District</strong> Level. Planning Units would then better reflect the municipal context at a finer-scale, based on the<br />
best realistic conservation options in the landscape. This is considered a critical task as a consequence of rapidly<br />
retreating options in the <strong>District</strong>.<br />
k) The BSP should be updated regularly within EKZNW, based on a monitoring programme and the most recent land<br />
cover data available, to inform decision-making within the planning department and other relevant EKZNW<br />
structures. Multi-sectoral reporting should at a minimum coincide with the municipal Integrated Development<br />
Plan and Land Use Management System review cycle, comprising a minimum 5-year cycle.<br />
l) Not all of the “Inappropriate / incompatible land uses and activities” provided in the Land Use Guidelines require<br />
environmental authorisation in terms of the NEMA Environmental Impact Assessment Regulations (2006), and<br />
therefore would not be subject to any environmental authorisation process. The BSP, apart from being the<br />
precursor to a Bioregional Plan, provides an opportunity for the competent authority to initiate an Environmental<br />
Page 18 of 194<br />
Date: May 2013
ZULULAND IDP REVIEW 2013/2014<br />
Management Framework for the <strong>District</strong>, adopting the CBAs and ESAs as Geographical Areas within an<br />
Environmental Management Framework. A key outcome of an EMF is the re-evaluation of the applicability of<br />
scheduled Listed Activities in terms of NEMA, whereby Listed Activities may be amended or additional activities<br />
may be promulgated in sensitive areas; the EMF therefore provides an opportunity for ensuring that critically<br />
important biodiversity is adequately considered in authorisation processes.<br />
1.8.6 CLIMATE CHANGE<br />
Varying climate conditions prevail across the <strong>District</strong>, as illustrated by varying Mean Annual Precipitation (figure<br />
below).<br />
Map 11: Annual Precipitation Map of the <strong>District</strong><br />
With the exception of some precipitation in the south from cold fronts in winter (in the <strong>Zululand</strong> Lowveld and Mistbelt<br />
areas), the region is subject to summer rainfall with dry winters, with rain predominantly falling in early summer,<br />
apart from Ithala Quartzite Sourveld (peak rains in midsummer). Mean Annual precipitation ranges from 493mm to<br />
1682mm in the <strong>District</strong> (predominantly below 900mm in the <strong>District</strong>), with large scale variations over relatively short<br />
distances in certain areas (on account of topographical influences). Rainfall in form of thunderstorms is the prevalent<br />
form of precipitation, whilst mist also contributes to precipitation at higher elevations. Mist is however generally an<br />
uncommon feature and hail is almost absent across the majority of the <strong>District</strong>. Summers are generally warm to hot,<br />
and winters are cool. Mean Annual Temperature ranges generally from approximately 4 o C to 20 o C, temperatures<br />
generally become cooler moving towards the west. Mean annual evaporation varies considerably in the <strong>District</strong><br />
depending on the relationship of rainfall and temperature.<br />
Climate change scenarios predict major changes in biome distribution in South Africa. Individual species and<br />
ecosystems will respond differently to climate change, some potentially increasing in abundance or range, others<br />
declining or contracting. Ecosystems will experience changes in their species mix, and these changes may increase<br />
Date: May 2013<br />
Page 19 of 194
ZULULAND IDP REVIEW 2013/2014<br />
their vulnerability to further change or to climate extremes. Models indicate that climate change impacts will largely<br />
consist of latitudinal and altitudinal shifts in potential species’ distributions while others suggest that the complete<br />
disappearance of critical climate types and dependent species are possible. Climate change will affect not only the<br />
survivorship of particular species, but also fragment the landscape and affect the natural resources that species have<br />
adapted to use in their natural environment. Species are thus marginalised and forced to move elsewhere to find<br />
places to live and food to eat. The impact of climate change will therefore increase the risk of species extinction and<br />
impact on biodiversity integrity. This <strong>District</strong> comprises biophysical and altitudinal gradients extending in all directions,<br />
primarily as a result of the central and western highland areas, which highlights the critical role that this municipality<br />
is likely to perform in biodiversity conservation in response to climate change. It is concluded that this <strong>District</strong> includes<br />
areas of biome resilience, where the current biome may persist in the face of climate change, under different climate<br />
change scenarios. However, ongoing fragmentation increases vulnerability to climate change and reduces resilience.<br />
1.8.7 ENVIRONMENTAL ANALYSIS<br />
This section has been extracted verbatim from <strong>Zululand</strong> <strong>District</strong> <strong>Municipality</strong>’s Integrated Environmental Programme,<br />
2012, as prepared by the KZN Department of Agriculture and Environmental Affairs:<br />
The environmental vision of the <strong>Zululand</strong> <strong>District</strong> <strong>Municipality</strong> (ZDM) is therefore, in short “the conservation of<br />
biodiversity to enhance the well being of the people in <strong>Zululand</strong>”<br />
The main issues within the municipality were identified within the following categories: Water, Waste, Biodiversity<br />
and Soil. The fundamental tools to consider when contemplating each issue and acting on these issues are:<br />
Awareness, Regulation and enforcement, Sustainability and delivery.<br />
Date: May 2013<br />
Page 20 of 194
ZULULAND IDP REVIEW 2013/2014<br />
1.8.7.1 WATER RESOURCES<br />
Map 12: Water provision is a key development issue in the <strong>Zululand</strong> <strong>District</strong> <strong>Municipality</strong><br />
The Map is representing the main water sources, rivers, wetlands and the Pongolapoort dam being the main dam.<br />
More than 60% of river-flow in South Africa arises from only 20% of the land area. The <strong>Zululand</strong> <strong>District</strong> <strong>Municipality</strong><br />
forms part of this 20% and has a wealth of surface water resources as a result of the high rainfall over the area. The<br />
north-western most corner and the high-lying central area of the <strong>District</strong> have been designated areas of importance to<br />
water production through surface runoff (Schulze et al, 1997). A water service plan has been developed and is<br />
reviewed on an annual basis.<br />
Pongolapoort Dam and Bivane Dam both have water quality of high standard, they are monitored through the<br />
National Water Resource Strategy (NWRS). There are three main catchments i.e. Pongola catchment (The water<br />
resources of the Pongola catchments are fully developed through the Pongolapoort Dam), Mkhuze catchment (The<br />
water resources are mostly undeveloped, with only a number of farm dams for irrigation purposes. The major water<br />
users in these catchments are irrigation and commercial forestry) and Umfolozi catchment (There is a deficit in the<br />
lower White Mfolozi during the winter months and The Black Mfolozi catchments consist mostly of Traditional<br />
Authority land, with the main activity being cattle farming). The water resources are mostly undeveloped, with only a<br />
number of farm dams for irrigation purposes. The major water users in these catchments are irrigation and<br />
commercial forestry). They experience pressures from cattle farming and subsistence farmers.<br />
The <strong>District</strong> is therefore critical for the provision of good quality water to the Pongolapoort Nature Reserve, Pongola<br />
Bush Nature Reserve, Ithala Game Reserve, Lake St Lucia, False Bay, eMakhosini-Ophathe Heritage Park, HluhluweiMfolozi<br />
Park, Mkhuze Game Reserve, and other smaller protected areas, sustaining water resources within<br />
provincially and nationally important ecotourism destinations.<br />
Date: May 2013<br />
Page 21 of 194
ZULULAND IDP REVIEW 2013/2014<br />
Key Pressure<br />
<br />
<br />
<br />
<br />
<br />
Wetland degradation is especially evident near urban or built up areas and occurs mainly as a result of<br />
inappropriate formal informal development.<br />
Incorrect citing of high-impact developments (such as low cost housing with poor sewage, wastewater and storm<br />
water management) in close proximity to wetlands drainage lines, rivers and dams is resulting in water pollution.<br />
Water borne diseases result from unprotected water resources.<br />
Alien invasive species consume valuable water resources causes soil erosion leading to flooding<br />
River catchments under pressure due to over extraction of water<br />
Key Proposed Interventions<br />
<br />
<br />
<br />
<br />
<br />
<br />
<br />
<br />
<br />
There is a need to protect water resources as a means to prevent waterborne diseases and ensure adequate<br />
supply of quality water for household consumption.<br />
Proper management of river catchments and wetlands<br />
No developments should be permitted in or on flood plains, watercourses or wetlands<br />
Region-wide acknowledgement of the scarcity of water in South Africa, and respect for his valuable resource from<br />
all, demonstrated through individual protection and conservation of water resources.<br />
Need to protect water resources by monitoring the usage of water in boreholes and rivers<br />
To preserve wetlands, draining them to plant crops, as well as building drains should be prevented or minimized.<br />
Farmers programmes to teach them to avoid pesticides & other pollutants and apply fertilizer with care.<br />
Eradicate alien invasive species and encroachment upon wetlands (such as urbanisation and mining operations)<br />
should be stopped.<br />
Rehabilitation and buffering of wetlands.<br />
1.8.7.2 WASTE MANAGEMENT<br />
Solid Waste disposal is poor.There is one Transfer station in Ulundi, one Landfill site in Babanango and there are eight<br />
Dumpsites spread throughout the LM’s Ulundi. Construction<br />
monitored by the municipalities.<br />
Key Pressures<br />
and Industrial waste are well<br />
Instances of overflowing sewage treatment plants or emergency overflows<br />
Solid waste management is a critical issue for the municipality. Almost all the landfill sites within <strong>Zululand</strong> need<br />
upgrading in order to comply with the legal requirements related to waste management.<br />
2001 census reported that more than half the households in <strong>Zululand</strong> dispose of waste in their own dumps, only<br />
20% have access to a formal waste disposal system (urban areas)<br />
Proposed Interventions<br />
There must be proper sited and managed dumpsites and recycle bins<br />
Waste management system, which contributes to sustainable developments and a measurable improvement in<br />
the quality of life<br />
Formal Sanitation: efforts shall be made to provide all residents of <strong>Zululand</strong> will be provided with formal<br />
sanitation facilities (whether as VIP Latrines, or as water borne sewage, or any of the new low water use designs<br />
on the market)<br />
Sanitation in the rural area areas is being provided in the form of dry-pit VIP toilets and the strategy is to<br />
implement these simultaneously with the roll-out of water service. This will ensure a more effective impact with<br />
health and hygiene awareness training.<br />
Pollution control essentially through the creation of a reliable refuse removal system and maintenance of drains<br />
and storm water pipes<br />
1.8.7.3 BIODIVERSITY<br />
Date: May 2013<br />
Page 22 of 194
ZULULAND IDP REVIEW 2013/2014<br />
Critical pieces of land (as identified by Ezemvelo KZN wildlife) are required to sustain the natural resource base outside<br />
protected Areas. These should be managed under appropriate protection measures. Active protection of valuable<br />
environmental is regarded as critical (wetlands, indigenous forests, grasslands, and bushveld)<br />
Biodiversity Sources<br />
The <strong>District</strong> is an avifaunal hotspot, comprising in excess of 400 birds. The area is home to at least 2 Critically<br />
Endangered species, 4 Endangered species, 35 Vulnerable species, and 50 Near Threatened species. The African<br />
Skimmer (Rynchops flavirostris) is classified as Regionally Extinct<br />
Five important fish species, 19 mammals, 3 reptiles, and 6 invertebrates have been identified as important. Grasslands<br />
are known in general to support high invertebrate diversity across a wide range on invertebrate taxa, but little is<br />
known about overall invertebrate distribution within the <strong>District</strong><br />
The wetland systems in the <strong>District</strong> are distributed in a complex mosaic, occupying a variety of positions in the<br />
landscape across altitudinal gradients, ranging from open water bodies, vleis and marshes, down to extensive<br />
wetlands associated with stream and river courses. The role of wetlands is amplified in this <strong>District</strong> on account of<br />
widespread rural settlement and coal mining activities. In certain circumstances wetlands used by rural communities<br />
have impacted upon the natural functions of such systems. These wetland systems need to be rehabilitated as they<br />
perform a vital service to both local and downstream users.<br />
Status Quo<br />
Source Management Status Management measure<br />
The Working for Water Programme (targets the<br />
Alien<br />
Invasive<br />
Programs in place<br />
removal of<br />
species<br />
invasive alien vegetation)<br />
IASP<br />
Projects: Somkhanda Land reform<br />
: Ithala Alien Clearing<br />
: Magudi Project<br />
: Emandayini project<br />
: Lowsburg project<br />
: Bilanyoni Project<br />
: Herbicide Assistance<br />
Indigenous forests Appropriately buffered Protected under the Forest Act.<br />
Vegetation Ranges between Critically<br />
Endangered (8%),<br />
Ekangala Grasslands Project<br />
Endangered (10%) or Vulnerable<br />
Date: May 2013<br />
Page 23 of 194
ZULULAND IDP REVIEW 2013/2014<br />
Status Quo<br />
Source Management Status Management measure<br />
(39%)<br />
Plant species<br />
Grasslands<br />
11 Endangered, 28 Vulnerable, and<br />
95<br />
Lower Risk<br />
Grassland and open<br />
Protected in terms of the KwaZulu-Natal<br />
Conservation Ordinance and other Red Data<br />
species occur<br />
within the <strong>District</strong><br />
unknown<br />
savanna species at most risk of<br />
degradation<br />
Avifaunal hotspot Critically Endangered species, 4<br />
Endangered species, 35 Vulnerable<br />
species, and 50 Near Threatened<br />
Unknown<br />
Species<br />
Cape Vulture (Gyps<br />
coprotheres),<br />
Threatened<br />
Predator Simulation Project<br />
Fauna<br />
Wetlands- Blood<br />
River Vlei Wetland<br />
and Lenjane<br />
Wetland<br />
System<br />
Five<br />
important fish species, 19<br />
mammals, 3 reptiles, and 6<br />
invertebrates<br />
Need to be rehabilitated<br />
Uknown<br />
Projects unfunded<br />
Date: May 2013<br />
Page 24 of 194
ZULULAND IDP REVIEW 2013/2014<br />
Map 13: Critical Biodiversity and Ecological support areas. Categorized into priortiesies ranging from mandatory<br />
which are identified as having an Irreplaceability value representing the only localities for which the conservation<br />
targets for one or more of the biodiversity features contained within can be achieved i.e. there are no alternative<br />
sites available. Others might have alternate sites within which the targets can be met for the biodiversity features<br />
contained within, but there aren't many.<br />
Date: May 2013<br />
Page 25 of 194
ZULULAND IDP REVIEW 2013/2014<br />
Map 14: Key Vegetation areas in <strong>Zululand</strong> <strong>District</strong>. The <strong>District</strong> has exceptional heterogeneity in habitat, which<br />
translates into rich vegetation diversity,as described in Mucina & Rutherford (2006), comprising lower altitude<br />
dense bushveld, savanna and grasslands, extending up to higher altitude mistbelt grasslands, including significant<br />
areas of mistbeltand forests.<br />
Table 2: Biodiversity Targets for Vegetation Types<br />
Vegetation Type<br />
KwaZulu-Natal<br />
Conservation Status<br />
Delagoa Lowveld<br />
KaNgwaneMontane Grassland<br />
Lebombo Summit Sourveld<br />
Midlands Mistbelt Grassland<br />
Dry Ngongoni Veld (Ngongoni Veld)<br />
Paulpietersburg Moist Grassland<br />
Glencoe Moist Grassland (N KZN Moist<br />
Critically Endangered<br />
Critically Endangered<br />
Critically Endangered<br />
Critically Endangered<br />
Endangered<br />
Endangered<br />
Vulnerable<br />
Grassland)<br />
Date: May 2013<br />
Page 26 of 194
ZULULAND IDP REVIEW 2013/2014<br />
Vegetation Type<br />
KwaZulu-Natal<br />
Conservation Status<br />
Granite Lowveld<br />
Income Sandy Grassland<br />
Northern KwaZulu-Natal Moist Grassland<br />
Northern <strong>Zululand</strong> Mistbelt Grassland<br />
Northern <strong>Zululand</strong> Sourveld<br />
Eastern Mistbelt Forest (Southern Mistbelt Forest)<br />
Eastern Scarp Forest (Scarp Forest)<br />
Ithala Quartzite Sourveld<br />
KwaZulu-Natal Highland Thornveld<br />
Makatini Clay Thicket<br />
Pondoland Scarp Forest (Scarp Forest)<br />
Southern Lebombo Bushveld<br />
Swaziland Sour Bushveld<br />
Tshokwane-Hlane Basalt Lowveld<br />
Wakkerstroom Montane Grassland<br />
<strong>Zululand</strong> Lowveld<br />
Vulnerable<br />
Vulnerable<br />
Vulnerable<br />
Vulnerable<br />
Vulnerable<br />
Least threatened<br />
Least threatened<br />
Least threatened<br />
Least threatened<br />
Least threatened<br />
Least threatened<br />
Least threatened<br />
Least threatened<br />
Least threatened<br />
Least threatened<br />
Least threatened<br />
Key Pressures<br />
Alien Invasive Weeds: Proliferation of alien invasive plants throughout the region in rural and urban areas, in<br />
watercourses, wetlands, and especially around or on the edges of forests and afforested areas.<br />
Mining and Mine Rehabilitation: Several mines within the <strong>Zululand</strong> <strong>District</strong> <strong>Municipality</strong> have not been<br />
rehabitated, and this is leading to severe environmental degradation, especially in terms of erosion, leaching,<br />
proliferation of alien invasive plants, collection of standing water and the associated diseases which result.<br />
A forestry threat to the natural environment is evident, especially in terms of encouraging unchecked alien<br />
invasive plant growth within or on the borders of afforested areas<br />
utilisation of high priority ecological/biodiversity and tourism areas for forestry<br />
Ilegal Muthi Harvesting damages indigenous populations of plants and animals without restocking<br />
Unsustainable Agricultural practices/ Management<br />
Loss of indigenous vegetation habitats due to afforestation, poor farming practices, poor catchment<br />
management, informal housing<br />
Veld fires result in soil erosion and proliferation of alien invasive plants<br />
Rehabilitation of damaged and degraded areas does not ordinarily occur as there was no legislation to enforce it.<br />
Over-grazing, injudicious burning regimes, sheet and donga erosion, unsustainable harvesting of plants, hunting<br />
of wildlife, and the spread of alien invasive plants are the primary threats. The relationship between crop<br />
production and biodiversity conservation is largely negative.<br />
Date: May 2013<br />
Page 27 of 194
ZULULAND IDP REVIEW 2013/2014<br />
Key Management Priorities<br />
Communities who value biodiversity should be able to share in benefits of natural resources and community<br />
initiatives<br />
Reduce, remedy and ultimately prevent soil erosion in the region<br />
Region-wide knowledge of alien species and acknowledgment of negative effects that these plants have on the<br />
environment.<br />
Compliance with the Conservation of Agricultural Resources Act, No. 43 of 1983<br />
Harvesting of indigenous species for firewood and muthi will be monitored and controlled, and will be sustained.<br />
Community involvement in viable tourism enterprises, which conserve the environment<br />
<strong>Municipality</strong> should enforce legislation to rehabilitate damaged and degraded areas.<br />
Monitor burning of forests/veld.<br />
Alien invasive species eradication/Clearing programs<br />
vegetation areas should be sufficiently large to allow for the occurrence of disturbance processes (e.g. fire), and<br />
the subsequent recovery of biodiversity features after a disturbance<br />
1.8.7.4 AIR QUALITY<br />
The district is said to have “Clean air” because of a few industrial activities. Mining activity is evident in the districts<br />
however the dust inside the mines is usually addressed through occupational boundary and usually does not affect the<br />
whole community as it is below the acceptable threshold levels. Veld fires need to be monitored and maintained at<br />
acceptable levels<br />
Key Pressures<br />
Veld is currently over burnt and thus contributing to air pollution.<br />
Rural communities dependence of wood and gas<br />
Proposed Interventions<br />
<br />
<br />
<br />
Industries (those few) will be located in the best possible areas for particular emissions.<br />
Emissions will be strictly curtailed and monitored according to accepted protocols.<br />
Reduce over burning of veld, and limit unnecessary veld fires and have them controlled.<br />
1.8.7.5 SITES OF CONSERVATION VALUE<br />
Date: May 2013<br />
Page 28 of 194
ZULULAND IDP REVIEW 2013/2014<br />
Map 15: The region has a high tourism potential. ÉDumbe <strong>Municipality</strong> has identified and put measures in place to<br />
conserve the areas of environmental value and sensitivity within its area of jurisdiction. The sites of conservation<br />
are managed and protected by the EKZNW through the Protected Area Expansion program.<br />
Sites of conservation:<br />
Ithala Game Reserve, Ngome State Forest, Pongolapoort Nature Reserve, Klipfontein Nature Reserve, Vryheid Nature<br />
Reserve, Pongola Bush Nature Reserve, Emakhosini Ophathe Heritage Park, <strong>Zululand</strong> Rhino Reserve, Amatshitsholo<br />
Community Conservation Area and the Pongolapoort Dam.<br />
Key Pressures<br />
High tourism potential has not been exploited, environmentally or otherwise.<br />
Numerous sites of tourism significance are being ignored or insufficiently marketed.<br />
Protection of all cultural, historical and environmental sensitive areas<br />
Proposed Interventions<br />
<br />
<br />
Upgrade and institute proper management of cemeteries (according to National Legislation guidelines).<br />
Fertile agricultural land will be set aside for farming purposes only, and will not be lost due to development<br />
pressure.<br />
1.9 SPATIAL & ENVIRONMENTAL: SWOT ANALYSIS<br />
1.9.1 SPATIAL: SWOT ANALYSIS<br />
Date: May 2013<br />
Page 29 of 194
ZULULAND IDP REVIEW 2013/2014<br />
1.9.1.1 STRENGHTS / OPPORTUNITIES<br />
<br />
<br />
<br />
<br />
<br />
<br />
<br />
<br />
<br />
The towns have comparatively good levels of infrastructure and services.<br />
The southern, south-western and northern corridors along the ZDM boundaries, have been demarcated as<br />
provincial “Priority Conservation Areas”. This is quite significant if compared to the rest of the province.<br />
3 towns within the ZDM area are considered as Provincial Tertiary Nodes, namely Ulundi, Vryheid and Pongola.<br />
There are numerous protected areas in the ZDM that offer tourism and economic opportunities.<br />
The high agricultural potential of the land is considered to be the key to the future development of the region and<br />
should be protected for long term sustainability<br />
The high population numbers and livestock concentrations in the freehold settlements highlight the need for<br />
additional land, and create possible opportunities for the development of commonage scheme<br />
large tracts of commercial farmland are located in the north-western part of the Municipal Area vis-à-vis the area<br />
between Vryheid and Paulpietersburg<br />
Good to High Potential Agricultural land is particularly evident in the north-western parts of the Municipal Area,<br />
i.e. the area from Emondlo to Paulpietersburg<br />
ZDM Area has large tracts of Biodiversity 1 and 3 designated areas<br />
1.9.1.2 WEAKNESSES / THREATS<br />
<br />
<br />
<br />
<br />
<br />
the rural settlements are small, making service delivery costly<br />
access to the rural areas is limited<br />
The central and north-western parts of the Municipal area are mountainous with slope of 1:3 and steeper. The<br />
slopes decrease (become less steep) towards the eastern half of the Municipal Area<br />
Large disparities are apparent in terms of the nature and structure of the built environment with the most<br />
significant disparity between the level of services and development in the rural and urban areas of the <strong>District</strong>.<br />
Unresolved land claim issues<br />
1.9.2 KEY ENVIRONMENTAL ISSUES<br />
Table 3: EMP/SEA Key Issues<br />
Key Issue<br />
Wetland Degradation<br />
Soil Erosion<br />
Low Cost Housing Problems<br />
Poor Sewage System<br />
Maintenance/Infrastructure<br />
Over Utilization of Soils<br />
Sand Winning<br />
Mining and Mine Rehabilitation<br />
Date: May 2013<br />
Brief Description<br />
Wetland degradation is especially evident near urban or built up areas and<br />
occurs mainly as a result of inappropriate formal and informal development.<br />
Soil erosion occurs throughout the region, but especially in the rural areas<br />
and in association with roads, pathways and subsistence agriculture.<br />
Typical low cost housing related problems are subsidence, sewage problems<br />
and collapsing of houses.<br />
Instances of overflowing sewage treatment plants or emergency overflows<br />
as a result of failed, incorrectly installed, or vandalised pump houses.<br />
Over utilisation of soils in some areas (no crop rotation) results in reduced<br />
agricultural potential, and eventually soil erosion and subsidence.<br />
Illegal sand winning without permits.<br />
Several mines within the <strong>Zululand</strong> <strong>District</strong> <strong>Municipality</strong> have not been<br />
rehabilitated, and this is leading to severe environmental degradation,<br />
especially in terms of erosion, leaching, proliferation of alien invasive plants,<br />
collection of standing water and the associated diseases which result.<br />
Page 30 of 194
ZULULAND IDP REVIEW 2013/2014<br />
Key Issue<br />
Alien Invasive Weeds<br />
Family Planning and Poverty<br />
Personal Wealth and Environmental<br />
Sustainability<br />
Management of Water Resources<br />
Threat from Forestry to the Natural<br />
Environment<br />
Veld Fires<br />
Requirement for a Municipal Open<br />
Space System<br />
Amenity and Shelter Planting<br />
Solid Waste Management<br />
Environmental Accounting<br />
High Tourism Potential<br />
Illegal Muthi Harvesting<br />
Date: May 2013<br />
Brief Description<br />
Proliferation of alien invasive plants throughout the region in rural and urban<br />
areas, in watercourses, wetlands, and especially around or on the edges of<br />
forests and afforested areas.<br />
While the national population growth rate is currently estimated at around<br />
0%, with possible increases only resulting from influxes of immigrants, the<br />
impact of poor family planning on the families involved and their<br />
surrounding environment is considerable.<br />
It must be noted that financially wealthy families, more often than not, have<br />
a tremendous impact on the environment in terms of their rates of<br />
consumption of numerous resources, and this issue should be addressed.<br />
Incorrect citing of high-impact developments (such as low cost housing with<br />
poor sewage, wastewater and storm water management) in close proximity<br />
to wetlands, drainage lines, rivers and dams is resulting in water pollution.<br />
There is a need to protect water resources as a means to prevent<br />
waterborne diseases and ensure adequate supply of quality water for<br />
household consumption.<br />
The municipality is located in an area well suited to commercial forestry, but<br />
a forestry threat to the natural environment is evident – especially in terms<br />
of encouraging unchecked alien invasive plant growth within or on the<br />
borders of afforested areas, and in the utilisation of high priority ecological /<br />
biodiversity and tourism areas for forestry.<br />
The veld is currently considerably over-burnt and this is resulting in soil<br />
erosion, damage to soil conditions and nutrients and the proliferation of:<br />
alien invasive plants; undesirable, less-palatable grass species; and woody<br />
species, which in turn create impenetrable thickets and further soil erosion.<br />
A clearly defined municipal open space system (for the entire municipal area,<br />
but especially in the ‘urban’ areas of Vryheid, Ulundi, Paulpietersburg,<br />
Louwsburg, and Pongola, and later in the more rural areas (but still built up)<br />
of eDumbe, Hlobane and Emondlo etc.) is required for the protection of<br />
wetlands, associated rivers, streams and catchments and areas of natural<br />
beauty.<br />
Amenity and shelter planting (in all built up areas) is required to improve the<br />
residential and commercial centres and the general ‘feel’ or amenity of the<br />
area. This will improve the quality of life for all residents, as well as<br />
enhancing the natural environment, and could even attract tourists and<br />
business.<br />
Address waste disposal issues - solid waste management is a critical issue for<br />
the municipality. Almost all the landfill sites within <strong>Zululand</strong> need upgrading<br />
in order to comply with the legal requirements related to waste<br />
management.<br />
Environmental issues and impacts are often not addressed in developments<br />
and projects. Environmental accounting needs to be become more<br />
integrated into the development planning process and must be considered in<br />
the very initial phases of planning any new development or upgrade, prior to<br />
any costly mistakes being made.<br />
The region has a high tourism potential, which has not been properly<br />
exploited, environmentally or otherwise. Numerous sites of tourism<br />
significance are being ignored or insufficiently marketed.<br />
Excessive / illegal muthi harvesting – damages indigenous populations of<br />
plants and animals, without restocking (See Ngome, Swart Umfolozi, State<br />
Page 31 of 194
ZULULAND IDP REVIEW 2013/2014<br />
Key Issue<br />
Unsustainable<br />
Practices/Management<br />
Agricultural<br />
Loss of Indigenous Vegetation<br />
Communities<br />
Conservation of Biodiversity<br />
Rehabilitation of Damages and<br />
Degraded Areas<br />
Management of Cemeteries<br />
Management of Biodiversity outside<br />
Protected Areas<br />
Community Benefits from the<br />
Environment<br />
Brief Description<br />
Forest).<br />
Loss of agricultural land due to development pressure, in which hard<br />
surfaced developments use up agricultural land is a serious issue, as this land<br />
is usually permanently lost to agriculture once covered over. Only land with<br />
low agricultural potential should be utilised for these types of developments.<br />
Loss of indigenous vegetation communities and habitats due to:<br />
<br />
<br />
<br />
<br />
Afforestation<br />
Poor farming practices<br />
Alien plant invasion<br />
Poor catchment management<br />
Informal housing<br />
Active protection of valuable environmental resources is regarded as critical<br />
(wetlands, indigenous forests, grasslands, and bushveld). Community<br />
involvement in viable tourism enterprises, which conserve the environment<br />
while providing employment and /or income, should be fostered and<br />
encouraged.<br />
Rehabilitation of damaged and degraded areas does not ordinarily occur, as<br />
there was not previously any legislation to enforce it, (this has now<br />
changed), and the municipality could begin to enforce this legislation.<br />
Upgrade and institute proper management of cemeteries (according to<br />
National Legislation guidelines).<br />
Critical pieces of land (as identified by Ezemvelo KZN Wildlife) are required to<br />
sustain the natural resource base outside Protected Areas; these should be<br />
managed under appropriate protection measures.<br />
Communities who value biodiversity should be able to share in the benefits<br />
of natural resources and community-based tourism initiatives.<br />
Environmental management plans should incorporate social issues in order<br />
to get ‘buy in’ from affected communities, including decision makers.<br />
1.9.2.1 PRIORITY ACTIONS<br />
<br />
Vegetation and Terrestrial Ecosystems<br />
There will be a balance between the need for development and environmental needs.<br />
<br />
Freshwater Resources<br />
There will be pollution free water for all. There will be clean water systems, achieved by proper management of<br />
the river catchments and appropriate treatment of sewerage.<br />
<br />
Wetlands and Watercourses<br />
No developments will be permitted in or on flood plains, watercourses or wetlands.<br />
<br />
Endemic and Threatened Species<br />
Harvesting of indigenous species for firewood and muthi will be monitored and controlled, and will be<br />
sustainable.<br />
<br />
Waste Generation, Disposal and Management<br />
Date: May 2013<br />
Page 32 of 194
ZULULAND IDP REVIEW 2013/2014<br />
To cater for waste disposal, both domestic and industrial, there will be properly sited and managed dumpsites<br />
and recycle bins. Implement a waste management system, which contributes to sustainable development and a<br />
measurable improvement in the quality of life.<br />
<br />
Formal Sanitation Facilities<br />
Efforts shall be made to provide all residents of <strong>Zululand</strong> will be provided with formal sanitation facilities<br />
(whether as VIP Latrines, or as water borne sewage, or any of the new low water use designs on the market) by<br />
2010.<br />
<br />
Water Use and Conservation<br />
There will be region-wide acknowledgement of the scarcity of water in South Africa, and respect for his valuable<br />
resource from all, demonstrated through individual protection and conservation of the water resource.<br />
<br />
Invasive Species<br />
There will be region-wide knowledge of alien invasive species and acknowledgement of the negative effects that<br />
these plants have on the environment. Compliance with the Conservation of Agricultural Resources Act, No. 43 of<br />
1983.<br />
<br />
Sustainable Grazing and Cropping (Farming) and Afforestation<br />
There will be region-wide knowledge and implementation of sustainable agricultural practices, to include<br />
cropping practices, plantation / exotic forest management, grazing methods, stocking density, burning regimes<br />
etc.<br />
<br />
Climate Change and Biodiversity<br />
Industries will be located in the best possible areas for particular emissions, and the emissions will be strictly<br />
curtailed and monitored according to the accepted protocols.<br />
<br />
Tourism<br />
There should be sustainable ‘exploitation’ / use of the high tourism potential of the region.<br />
<br />
Mining and Sand Winning<br />
Erosion - Reduce, remedy and ultimately prevent soil erosion in the region.<br />
<br />
Housing<br />
Housing, especially low cost and informal housing will be appropriately located in all instances, and residents will<br />
not be permitted to occupy areas which are environmentally or socially unsuitable or unsustainable.<br />
<br />
Health and Social Welfare<br />
A concerted and honest effort will be made to tackle the problems of HIV / Aids and other communicable disease<br />
prevention.<br />
<br />
Planning<br />
Planning will adopt a holistic approach and include adequate planning for people with disabilities and<br />
environmental constraints. Inappropriately located developments will not be permitted. Fertile agricultural land<br />
will be set aside for farming purposes only, and will not be lost due to development pressure.<br />
Date: May 2013<br />
Page 33 of 194
ZULULAND IDP REVIEW 2013/2014<br />
<br />
General: Governance<br />
Promote co-operative Governance and capacity building.<br />
In addition, the table overleaf indicates additional, and updated, environmental issues and projects<br />
Date: May 2013<br />
Page 34 of 194
ZULULAND IDP REVIEW 2013/2014<br />
Table 4: Important Environmental Issues and the proposed Projects<br />
ENVIRONMENTAL STRATEGY PROJECT RELEVANT PRIORITY<br />
ISSUE<br />
AUTHORITY<br />
Freshwater Resources Proper management of the river • Improve management of catchments to reduce potable DWA<br />
HIGH<br />
catchments and appropriate treatment of water losses<br />
sewerage.<br />
Management and Integrated<br />
environmental • Soil erosion rehabilitation projects DAE, ZDM HIGH<br />
conservation of natural<br />
resources<br />
management/sustainable livelihood<br />
development programme for entire<br />
Biodiversity<br />
municipality<br />
Encourage sustainable natural resources<br />
to control muthi collectors<br />
Wetlands Establishing effective water quality<br />
monitoring programme, as well as the<br />
gathering and storage of all information<br />
available regarding water quality.<br />
Environmental<br />
Awareness<br />
Facilitate opportunities to further<br />
environmental awareness amongst<br />
politicians and officials.<br />
Encourage community awareness<br />
programs.<br />
• Support endangered species projects<br />
• Develop a district biodiversity plan &mainstream<br />
ecosystems goods and services approaches to<br />
development planning<br />
• Wetland rehabilitation projects<br />
• Eradicate alien invasive species and encroachment upon<br />
wetlands (such as urbanisation and mining operations)<br />
should stopped<br />
• Improve access to environmental education to all sectors<br />
of society<br />
• Conduct workshops<br />
EKZNW<br />
EKZNW<br />
DAE<br />
ZDM<br />
DAE<br />
HIGH<br />
HIGH<br />
HIGH<br />
Alien invasive Species,<br />
Endemic<br />
and<br />
Threatened Species<br />
Knowledge of alien invasive species and<br />
acknowledgement of the negative effects<br />
that these plants have on the<br />
environment.<br />
Eradication programs<br />
• Monthly monitoring and eradication of Alien invasive<br />
species<br />
•<br />
• Fire Fighters (Fight fires and clear alien invasive plants)<br />
EKZNW<br />
DAE<br />
HIGH<br />
Waste Generation,<br />
Disposal<br />
and<br />
Management<br />
Properly sited and managed dumpsites<br />
and recycle bins. Implement a waste<br />
management system, which contributes to<br />
sustainable development and a<br />
• Every bit of rubbish avoided means less of it in the landfill<br />
sites as well as less air, soil and water pollution, and less<br />
usage of natural resources.<br />
• Recycle waste<br />
ZDM<br />
HIGH<br />
Date: May 2013<br />
Page 35 of 194
ZULULAND IDP REVIEW 2013/2014<br />
ENVIRONMENTAL<br />
ISSUE<br />
STRATEGY PROJECT RELEVANT<br />
AUTHORITY<br />
measurable improvement in the quality of • Improve operations of wastewater works<br />
life.<br />
• Provide refuse collection services<br />
• Waste material to be removed from site and disposed of in<br />
a municipal landfill site<br />
• Rubbish bins with plastic linings should be placed at each<br />
site of construction and emptied on a regular basis<br />
PRIORITY<br />
Date: May 2013<br />
Page 36 of 194
ZULULAND IDP REVIEW 2013/2014<br />
1.10 DISASTER MANAGEMENT<br />
The core function of Disaster Management Division is to address the following issues, namely:<br />
<br />
<br />
Conducting Disaster Awareness throughout the district<br />
Attending to all disaster incidents in the district<br />
Among the types of disasters, common disasters that normally hit the people in the district are the natural disasters<br />
such as the storm and strong winds.<br />
1.10.1 VISION: DISASTER RISK MANAGEMENT<br />
The <strong>Zululand</strong> <strong>District</strong> <strong>Municipality</strong>’s vision is to build informed and resilient communities and ensure a safe and<br />
healthy environment in the <strong>Zululand</strong> <strong>District</strong> <strong>Municipality</strong>.<br />
1.10.2 MISSION STATEMENT: DISASTER RISK MANAGEMENT<br />
The <strong>Zululand</strong> <strong>District</strong> <strong>Municipality</strong>’s mission is to develop and implement holistic and integrated planning and practice<br />
in a cost‐effective and participatory manner to reduce vulnerabilities and build resilient communities through<br />
sustainable development and service delivery.<br />
The aim of the Integrated Development Plans (IDP) of the <strong>Zululand</strong> <strong>District</strong> <strong>Municipality</strong> is to promote sustainable<br />
development and uses the spatial development framework (SDF) to visualize future development.<br />
In terms of <strong>Section</strong> 26(g) of the Municipal Systems Act, 200, Act 32 of 2000, a <strong>Municipality</strong>’s IDP must contain a<br />
disaster management plan. Development projects in the <strong>Municipality</strong>, as contained in the <strong>Municipality</strong>’s IDP, is thus<br />
interlinked with disaster management planning and activities. Risk reduction projects identified as part of disaster risk<br />
management planning, such as those identified in this plan and the contingency plans developed and risk assessments<br />
should be included into the Municipal IDP.<br />
The <strong>Zululand</strong> <strong>District</strong> <strong>Municipality</strong> prepared this Level 1 Disaster Risk Management Plan which establishes the<br />
arrangements for disaster risk management within the <strong>Zululand</strong> <strong>District</strong> <strong>Municipality</strong> and has been prepared in<br />
accordance with the requirements of the Disaster Management Act, 57 of 2002 (the Act).<br />
1.10.3 MUNICIPAL INSTITUTIONAL CAPACITY<br />
1.10.3.1 INSTITUTIONAL ARRANGEMENTS<br />
The disaster risk management function and DMC in the municipality resort under the Corporate Services Department<br />
of the <strong>Zululand</strong> <strong>District</strong> <strong>Municipality</strong>. The Municipal Disaster Offices are also located in the Protection Services<br />
Departments under Corporate Services.<br />
The Disaster Management Centre has the following personnel:<br />
1. <strong>District</strong> Disaster Manager<br />
2. Disaster Management Officers per Local <strong>Municipality</strong><br />
Disaster Management Advisory Forum<br />
Date: May 2013<br />
Page 37 of 194
ZULULAND IDP REVIEW 2013/2014<br />
<strong>Section</strong> 44(1)(b) of the Disaster Management Act No. 57 of 2002 (Act) calls for an integratedand coordinated approach<br />
to disaster risk management in municipal areas. Such a committee is in the final stages of establishment.<br />
Local Municipal Disaster Management Committees<br />
Local Municipalities have established local offices to manage and or discus disasters and response to local disasters.<br />
<strong>District</strong> Technical Advisory Committee<br />
This committee was established at the <strong>District</strong> level and comprises of local and district political and administrative<br />
officials and identified sector departments<br />
Municipal Inter-Departmental Disaster Risk Management Committee<br />
This committee is to be established.<br />
Ward Structures<br />
Ward Structures are a key community awareness and important communication and information link between the<br />
municipality and the communities on the ground. Ward structures are operational in all of the municipalities.<br />
1.10.4 RISK PROFILE AND ASSESSMENT<br />
Table 5: Current Risk Profile of <strong>Zululand</strong> <strong>District</strong> <strong>Municipality</strong><br />
Types of disasters Types of incidents Priority in Priority in Priority for Discipline<br />
terms of terms of contingency involved<br />
occurrence damage planning<br />
Fires Forest DFA / FPASA, Fire<br />
Building<br />
Fighting Services<br />
Veld 1 2 1<br />
Vehicle<br />
Hazardous Road Environmental<br />
Rail<br />
Affairs, Clean-up<br />
Individual<br />
Specialists<br />
Floods Flash 3 3 3 Welfare, CMA,<br />
Rising water<br />
Farmers<br />
Raging water<br />
Snow<br />
Rescue Services<br />
Environmental Drought Natural 4 4 4 Farmers, CMA,<br />
Man made<br />
Scientists,<br />
Insects<br />
Technical<br />
Epidemics Cholera Technical,<br />
Foot-and-mouth<br />
Farmers, Health,<br />
Rabies<br />
Scientists<br />
Newcastle sickness<br />
Tropical Cyclones /<br />
2 1 2 Weather, Welfare<br />
Severe<br />
Thunderstorms<br />
Civil unrest<br />
Protection<br />
services<br />
Aeronautical Fire Fighting<br />
Services, Civil<br />
Page 38 of 194<br />
Date: May 2013
ZULULAND IDP REVIEW 2013/2014<br />
Types of disasters Types of incidents Priority in<br />
terms of<br />
occurrence<br />
Rail / road<br />
Mountain accidents<br />
Essential services<br />
Priority in<br />
terms of<br />
damage<br />
Priority for<br />
contingency<br />
planning<br />
Discipline<br />
involved<br />
Aviation<br />
Rescue Services<br />
Rescue Services<br />
The tables below indicate, per LM, the potential risks, as a result of risk assessment:<br />
Table 6: eDumbe LM, uPhongola LM and Abaqulusi LM – potential Risks<br />
eDumbe LM, uPhongola and Abaqulusi<br />
Hydro‐meteorological Hazards ‐ Severe Storms(Wind, Hail, Snow, Lightning, Fog)<br />
Fire Hazards ‐ Formal & Informal Settlements/Urban Area<br />
Fire Hazards ‐ Veld/Forest Fires<br />
Disease / Health ‐ Disease: Human (HIV/AIDS & TB)<br />
Disease / Health ‐ Disease: Human (Other Disease)<br />
Hydro‐meteorological ‐ Drought<br />
Infrastructure Failure / Service Delivery Failure ‐Water<br />
Hydro‐meteorological Hazards ‐ Floods (River,Urban & Dam Failure)<br />
Infrastructure Failure / Service Delivery Failure ‐Electrical<br />
Civil Unrest ‐ Crime<br />
Table 7: Nongoma LM – potential Risks<br />
Nongoma LM<br />
Disease / Health ‐ Disease: Human (HIV/AIDS & TB)<br />
Hydro‐meteorological Hazards ‐ Severe Storms (Wind, Hail, Snow, Lightning, Fog)<br />
Disease / Health ‐ Disease: Human (Other Disease)<br />
Fire Hazards ‐ Formal & Informal Settlements /Urban Area<br />
Fire Hazards ‐ Veld/Forest Fires<br />
Hydro‐meteorological Hazards ‐ Floods (River,Urban & Dam Failure)<br />
Hydro‐meteorological ‐ Drought<br />
Infrastructure Failure / Service Delivery Failure ‐Water<br />
Infrastructure Failure / Service Delivery Failure ‐Electrical<br />
Civil Unrest ‐ Crime<br />
Table 8: Ulundi LM – potential Risks<br />
Ulundi<br />
Hydro‐meteorological Hazards ‐ Severe Storms (Wind, Hail, Snow, Lightning, Fog)<br />
Disease / Health ‐ Disease: Human (HIV/AIDS & TB)<br />
Fire Hazards ‐ Formal & Informal Settlements / Urban Area<br />
Fire Hazards ‐ Veld/Forest Fires<br />
Disease / Health ‐ Disease: Human (Other Disease)<br />
Hydro‐meteorological ‐ Drought<br />
Infrastructure Failure / Service Delivery Failure ‐ Water<br />
Hydro‐meteorological Hazards ‐ Floods (River, Urban & Dam Failure)<br />
Date: May 2013<br />
Page 39 of 194
ZULULAND IDP REVIEW 2013/2014<br />
Ulundi<br />
Infrastructure Failure / Service Delivery Failure ‐ Electrical<br />
Civil Unrest ‐ Crime<br />
1.10.5 RISK REDUCTION & PREVENTION<br />
1.10.5.1 ASSISTANCE<br />
It is the responsible of a municipal disaster management centre to assist both the national- and provincial disaster<br />
management centres with:<br />
<br />
<br />
<br />
the identification and establishment of communication links with disaster management role-players in the<br />
municipal area;<br />
development and maintenance of the disaster management electronic database; and<br />
develop guidelines for the preparation and regular review of disaster management plans and strategies,<br />
including contingency plans and emergency procedures, and the integration of the concept and principles of<br />
disaster management and particularly the prevention and mitigation strategies, with development plans and<br />
programmes.<br />
1.10.5.2 PREVENTION AND MITIGATION<br />
The <strong>District</strong> <strong>Municipality</strong>’s Disaster Management Centre must give guidance to assess and prevent or reduce the risk<br />
of disasters, including ways and means of:<br />
<br />
<br />
<br />
<br />
determining levels of risk;<br />
assessing the vulnerability of communities and households to disasters that may occur;<br />
increasing the capacity of communities and households to minimise the risk and impact of disasters that may<br />
occur; and<br />
monitoring the likelihood of, and the state of alertness to disasters that may occur.<br />
The district municipality is also responsible for the following in terms of prevention and mitigation:<br />
<br />
<br />
<br />
the development and implementation of appropriate prevention and mitigation methodologies;<br />
the integration of prevention and mitigation methodologies with development plans, programmes and<br />
initiatives; and<br />
the management of high-risk developments.<br />
Lastly, it is the responsibility of the disaster management centre of a district municipality in terms of prevention and<br />
mitigation to promote formal and informal initiatives that encourage risk avoidance behaviour by organs of state, the<br />
private sector, non-governmental organisations, communities, households and individuals in the municipal area.<br />
Date: May 2013<br />
Page 40 of 194
ZULULAND IDP REVIEW 2013/2014<br />
1.10.6 RESPONSE & RECOVERY<br />
The Council of a <strong>District</strong> <strong>Municipality</strong> is primarily responsible for the co-ordination and management of local disasters.<br />
This is the first sphere of government from where a local state of disaster may be declared by way of a notice in the<br />
Provincial Gazette.<br />
When a disastrous event occurs or is threatening to occur in the area of a municipality, the disaster management<br />
centre of the municipality concerned must determine whether the event should be regarded as a disaster in terms of<br />
the Act and if it is regarded as a disaster, the municipality must immediately:<br />
<br />
<br />
<br />
<br />
initiate efforts to assess the magnitude and severity or potential magnitude and severity of the disaster;<br />
inform the National Centre and the relevant provincial disaster management centre of the disaster and its<br />
initial assessment of the magnitude and severity or potential magnitude and severity of the disaster;<br />
alert disaster management role-players in the municipal area that may be of assistance in the circumstances;<br />
and<br />
initiate the implementation of any contingency plans and emergency procedures that may be applicable in<br />
the said circumstances.<br />
When reporting the disaster to the National Centre and the relevant provincial disaster management centre, the<br />
municipal disaster management centre may make a recommendation regarding the classification of the disaster.<br />
1.10.7 DISASTER MANAGEMENT STRATEGIC PLAN<br />
The ZDM Disaster Management Strategic Plan is presented overleaf:<br />
Date: May 2013<br />
Page 41 of 194
ZULULAND IDP REVIEW 2013/2014<br />
Table 9 ZDM Disaster Management Strategic Plan<br />
NO MAIN KEY PERFORMANCE AREAS AND INDICATORS RESPONSIBLE DEPARTMENT/INSTITUTION CURRENT STATUS AND OUTSTANDING ACTIONS<br />
KEY PERFORMANCE AREA 1: ESTABLISH INTEGRATED INSTITUTIONAL CAPACITY<br />
1.1<br />
1.2<br />
1.3<br />
1.4<br />
Establish functionally effective arrangements for the<br />
development and adoption of an integrated policy for<br />
Disaster Risk Management<br />
Establish functionally effective arrangements for<br />
integrated direction and implementation of the Disaster<br />
Management Act, 2002; the NDMF; the<br />
provincial and district DMFs.<br />
Establish functionally effective Disaster Management<br />
Centre arrangements for stakeholder participation and<br />
the engagement of technical advice in disaster risk<br />
management planning and operations<br />
Establish functionally effective arrangements for<br />
national, regional and international cooperation for and<br />
international cooperation for disaster risk management<br />
Disaster Management Centre<br />
Disaster Management Centre<br />
Disaster Management Centre, all departments, external<br />
stakeholders<br />
Disaster Management Centre, all municipal departments<br />
and Municipal Entities<br />
Disaster Management Centre<br />
The <strong>District</strong> Disaster Management Policy Framework has<br />
to be updated.<br />
The DMC need to be fully established (housed), staffed<br />
and equipped. The Head of the Centre has been<br />
formally appointed; The DMAF and committees have<br />
been established and will be furthered; An MIDRMC will<br />
be established; All Local Municipalities must establish<br />
their own disaster management function with staff and<br />
equipment.<br />
Stakeholders are constantly being invited to planning<br />
and input sessions pertaining to disaster risk<br />
assessments and planning.<br />
The DMC is working in close collaboration with Provincial<br />
and National and Namibian Disaster Management<br />
Centres and institutions, as well as neighbouring<br />
municipalities and provinces and the private sector.<br />
Memoranda of understanding / mutual assistance<br />
agreements with main stakeholders need to be<br />
identified and finalised.<br />
KEY PERFORMANCE AREA 2: CONDUCT DISASTER RISK ASSESSMENTS AND MONITOR DISASTER RISK TO INFORM DISASTER RISK MANAGEMENT PLANNING AND DISASTER RISK<br />
REDUCTION UNDERTAKEN BY ORGANS OF STATE AND OTHER ROLE PLAYERS IMPERATIVE<br />
2.1<br />
2.2<br />
2.3<br />
Conduct comprehensive disaster risk assessments to<br />
inform disaster risk management and risk reduction<br />
policies, planning and programming<br />
Generate an Indicative Disaster Risk Profile for the<br />
NMBMM<br />
Identify and establish effective mechanisms to monitor,<br />
update and disseminate disaster risk information<br />
Disaster Management Centre<br />
Disaster Management Centre<br />
Disaster Management Centre<br />
A scientific disaster risk assessment has been conducted<br />
in 2010‐2011 and the results of the updated assessment<br />
are available at the DMC.<br />
A disaster risk profile has been generated in 2011 and<br />
the results of the assessment are available at the DMC.<br />
This is being executed by the Disaster Management<br />
Centre<br />
Date: May 2013<br />
Page 42 of 194
ZULULAND IDP REVIEW 2013/2014<br />
NO MAIN KEY PERFORMANCE AREAS AND INDICATORS RESPONSIBLE DEPARTMENT/INSTITUTION CURRENT STATUS AND OUTSTANDING ACTIONS<br />
2.4<br />
3<br />
3.1<br />
3.2<br />
3.3<br />
3.4<br />
Identify and apply mechanisms to conduct quality control<br />
committees comprising the relevant specialist scientific<br />
and technical expertise in the relevant sphere to assist<br />
with monitoring standards and progress of disaster risk<br />
assessments and with the validation and/or<br />
interpretation of findings. The methodology and results<br />
of the disaster risk assessments have been subjected to<br />
an independent technical review process and external<br />
validation.<br />
Date: May 2013<br />
Disaster Management Centre<br />
The municipal disaster risk management centre need to<br />
appoint technical advisory<br />
KEY PERFORMANCE AREA 3: DEVELOP AND IMPLEMENT INTEGRATED AND RELEVANT DISASTER RISK MANAGEMENT PLANS AND RISK REDUCTION PROGRAMMES IN<br />
ACCORDANCE WITH APPROVED FRAMEWORKS<br />
Compile and implement integrated and relevant disaster<br />
risk management plans<br />
Determine municipal priority disaster risks and priority<br />
areas, communities and households<br />
Scope and develop disaster risk reduction plans, projects<br />
and programmes<br />
Incorporate disaster risk reduction efforts into strategic<br />
integrating structures and processes .<br />
Disaster Management Centre, all municipal departments<br />
and Municipal Entities<br />
Disaster Management Centre<br />
Disaster Management Centre, all municipal departments<br />
and Municipal Entities<br />
Municipal Management, Disaster Management Centre,<br />
all municipal departments and Municipal Entities<br />
This Disaster Management Plan has been drafted. All<br />
local municipalities and municipal departments and<br />
municipal entities still need to draft / update their<br />
disaster management plans.<br />
A disaster risk profile has been generated in 2011 and<br />
the results of the assessment are available at the DMC.<br />
This has been executed as part of the development of<br />
this plan, but still need to be executed by all municipal<br />
departments and Municipal Entities<br />
This Disaster Management Plan will be incorporated into<br />
the Municipal IDP. Risk‐related information will be<br />
incorporated into spatial development and<br />
environmental management frameworks. Mechanisms<br />
to disseminate experience from pilot and research<br />
projects that explore the vulnerability reduction<br />
potential, appropriateness, costeffectiveness and<br />
sustainability of specific disaster risk reduction will be<br />
further established. Case studies and best‐practice<br />
guides in disaster risk reduction, facilitated by the<br />
municipal disaster risk management centre, will be<br />
generated and disseminated. Disaster risk reduction<br />
initiatives to be implemented by municipal departments<br />
the DMA(if applicable), local municipalities and any<br />
other municipal entities. Regulations, standards,<br />
Page 43 of 194
ZULULAND IDP REVIEW 2013/2014<br />
NO MAIN KEY PERFORMANCE AREAS AND INDICATORS RESPONSIBLE DEPARTMENT/INSTITUTION CURRENT STATUS AND OUTSTANDING ACTIONS<br />
4 KEY PERFORMANCE AREA 4: DEVELOP MAIN KEY PERFORMANCE AREAS AND INDICATORS<br />
minimum criteria, by‐laws and other legal instruments<br />
that encourage risk avoidance behaviour need to be<br />
constantly enforced by municipal departments and<br />
other entities and documented in annual reports to the<br />
municipal disaster risk management centre, the NDMC<br />
and the provincial disaster risk management centre<br />
concerned.<br />
4.1<br />
4.2<br />
Identify and implement mechanisms for the<br />
dissemination of early warnings<br />
Develop and implement mechanisms for the assessment<br />
of significant events and/or disasters for the purposes of<br />
classification and declarations of a state of disaster to<br />
ensure rapid and effective response<br />
Disaster Management Centre, all municipal departments<br />
and Municipal Entities<br />
Disaster Management Centre<br />
Effective and appropriate early warning strategies will be<br />
further developed and implemented and the<br />
information communicated to stakeholders to enable<br />
appropriate responses. Strategic emergency<br />
communication links will be further established in highrisk<br />
areas and communities.<br />
Uniform methods for the assessment and costing of<br />
significant events or disasters, which are consistent with<br />
national requirements, will be developed and adopted.<br />
Mechanisms for the rapid and effective classification of a<br />
disaster and the declaration of a state of disaster have<br />
been established. Mechanisms for conducting disaster<br />
reviews and reporting, including mechanisms to enable<br />
assessments that will comply with the provisions of<br />
sections 56 and 57 of the DM Act, have been developed<br />
and implemented. Research reports on significant events<br />
and trends are routinely submitted to the municipal<br />
disaster risk management centre, the NDMC and the<br />
relevant provincial disaster risk management centre, and<br />
are disseminated to stakeholders. Review reports on<br />
actual disasters are routinely submitted to the municipal<br />
disaster risk management centre, the NDMC and the<br />
relevant provincial disaster risk management centre, and<br />
are disseminated to stakeholders.<br />
Date: May 2013<br />
Page 44 of 194
ZULULAND IDP REVIEW 2013/2014<br />
NO MAIN KEY PERFORMANCE AREAS AND INDICATORS RESPONSIBLE DEPARTMENT/INSTITUTION CURRENT STATUS AND OUTSTANDING ACTIONS<br />
4.3<br />
4.4<br />
4.5<br />
4.6<br />
Develop and implemented mechanisms to ensure<br />
integrated response and recovery efforts<br />
Develop and adopt mechanisms for the management and<br />
distribution of disaster relief in accordance with national<br />
regulations and directives and the provincial DMF<br />
Develop and implement mechanisms to ensure that<br />
integrated rehabilitation and reconstruction activities are<br />
conducted in a<br />
Disaster Management Centre, all municipal departments<br />
and Municipal Entities<br />
Disaster Management Centre, Housing<br />
Disaster Management Centre, Infrastructure &<br />
Development, Housing & Land<br />
The municipal departments, local municipalities and any<br />
other entities that should bear primary responsibility for<br />
contingency planning and the coordination of known<br />
hazards have been identified and allocated such<br />
responsibility. Stakeholders who must bear secondary<br />
responsibility for contingency planning and the<br />
coordination of known hazards have been identified and<br />
allocated such responsibility. Contingency Plans for<br />
certain known hazards need to be developed and<br />
implemented by all municipal departments, local<br />
municipalities and any other municipal entities.<br />
Response and recovery plans are reviewed and updated<br />
annually. Field Operations Plans (FOPs) for the various<br />
activities associated with disaster response and recovery<br />
need to be developed, each significant event and/or<br />
disaster. Multi‐agency responses need to be constantly<br />
managed in accordance with national regulations and<br />
directives and the relevant provincial disaster risk<br />
management policy framework, and are reviewed and<br />
updated annually. Policy and directives for the<br />
management of disaster response and recovery<br />
operations need to be developed and gazetted or<br />
published and need to be adhered to.<br />
Disaster relief measures are managed in accordance<br />
with national regulations and directives and are<br />
progressively monitored and reviewed annually.<br />
Recommendations are made to the municipal disaster<br />
risk management centre, the NDMC and/or the<br />
provincial disaster risk management centre concerned,<br />
on any adjustments according to lessons learnt<br />
Post‐disaster technical task teams for rehabilitation and<br />
reconstruction projects need to be established and<br />
operate effectively. Mechanisms for the developmental<br />
manner monitoring of rehabilitation and reconstruction<br />
projects have been established and regular progress<br />
Date: May 2013<br />
Page 45 of 194
ZULULAND IDP REVIEW 2013/2014<br />
NO MAIN KEY PERFORMANCE AREAS AND INDICATORS RESPONSIBLE DEPARTMENT/INSTITUTION CURRENT STATUS AND OUTSTANDING ACTIONS<br />
4.7<br />
4.8<br />
4.9<br />
Enabler 1: Mechanisms have been identified and<br />
developed to ensure that all relevant data in respect of<br />
the information management system is gathered and<br />
captured simultaneously in the process of developing<br />
and implementing disaster risk management plans and<br />
risk reduction programmes procured and is being used<br />
and updated.<br />
Enabler 2: Education, training, public awareness and<br />
research (knowledge management) needs in respect of<br />
disaster risk reduction planning and implementation<br />
have been analysed, and appropriate mechanisms have<br />
been identified and implemented to address the relevant<br />
needs<br />
Enabler 3: A business plan and a budget for the<br />
development and implementation of disaster risk<br />
management plans and risk reduction programmes have<br />
been prepared, submitted and approved for the current<br />
and ensuing financial year<br />
reports are submitted to the municipal disaster risk<br />
management centre, the NDMC and the provincial<br />
disaster risk management centre concerned.<br />
Disaster Management Centre A Disaster Management Information System and<br />
communication need to be<br />
Disaster Management Centre<br />
Disaster Management Centre, all municipal departments<br />
and Municipal Entities<br />
Education, training, public awareness and research<br />
(knowledge management) needs in respect of response<br />
and recovery planning and operations have been<br />
analysed and appropriate mechanisms need to be<br />
identified and implemented to address the relevant<br />
needs.<br />
A business plan and a budget for the development and<br />
implementation of response and recovery operational<br />
plans is prepared, submitted and approved for the<br />
current and ensuing financial year.<br />
Date: May 2013<br />
Page 46 of 194
Total population<br />
ZULULAND IDP REVIEW 2013/2014<br />
1.10.8 DISASTER MANAGEMENT: SWOT ANALYSIS<br />
The table below is an analysis of summary of challenges that prevent the Disaster Offices from operating optimally.<br />
Table 10: Challenges facing LMs in terms of Disaster Management<br />
<strong>Municipality</strong><br />
uPhongola<br />
Abaqulusi<br />
Ulundi<br />
Nongoma<br />
eDumbe<br />
<strong>Zululand</strong><br />
Source: Disaster Management Plan 2011<br />
Challenges<br />
Funding, Response, Prevention<br />
Vehicles, Funding, Response<br />
Equipment, Funding<br />
Staff, vehicles, equipment, facilities<br />
Vehicles, facilities, prevention, response<br />
Equipment, funding<br />
2. DEMOGRAPHIC CHARACTERISTICS<br />
2.1 DEMOGRAPHIC INDICATORS<br />
2.1.1 POPULATION SIZE<br />
2.1.1.1 TOTAL POPULATION (1996, 2001 AND 2011)<br />
Table 11: Total Population<br />
Total population<br />
1996 2001 2011<br />
691,055 760,464 803,575<br />
Total population<br />
800 000<br />
760 464<br />
803,575<br />
750 000<br />
700 000<br />
691 055<br />
650 000<br />
600 000<br />
1996 2001 2011<br />
The <strong>Zululand</strong> <strong>District</strong> <strong>Municipality</strong><br />
experienced a significant increase in the<br />
number of the people residing within its<br />
boundaries from 1996 to 2011. This<br />
trend continued between 2001 and 2011.<br />
Figure 1: Total Population 1996, 2001, 2011<br />
Date: May 2013<br />
Page 47 of 194
Growth Rate<br />
ZULULAND IDP REVIEW 2013/2014<br />
2.1.1.2 POPULATION GROWTH<br />
Table 12: Population Growth<br />
Total Population Population growth Total<br />
rate (1996-2001) population<br />
1996 2001 2011<br />
691 055 780 069 2.4 803 575 0.3<br />
Population growth rate (2001-<br />
2011)<br />
2.5<br />
1.5<br />
0.5<br />
Population Growth Rates<br />
1996-2011<br />
3<br />
2<br />
1<br />
0<br />
Population growth rate<br />
(1996-2001)<br />
Population growth rate<br />
(2001-2011)<br />
Population Growth<br />
between 1996 and 2001<br />
was 2.4%, whilst between<br />
2001 and 2011,<br />
population growth rate<br />
decreased and was 0.3%.<br />
Figure 2: Population Growth<br />
Possible causes of declining population growth rates include:<br />
<br />
<br />
<br />
<br />
Ongoing development of the economy – internationally it has been observed that as countries develop their<br />
population growth rates tend to stabilize around a lower rate.<br />
High level of HIV-Aids related deaths<br />
Migration out of the district to fast-growing urban centres (while the average growth rate in eThekwini is<br />
lower than in <strong>Zululand</strong>, in the past two years it has experienced greater growth)<br />
The impact of the recession – Population growth rates for all the municipalities decreased in 2009. This may<br />
be because the decision to have children was negatively impacted by considerations of job losses as a result<br />
of the recession.<br />
Date: May 2013<br />
Page 48 of 194
ZULULAND IDP REVIEW 2013/2014<br />
2.1.1.3 POPULATION DISTRIBUTION AND DENSITY<br />
Map 16: Population Distribution (2011)<br />
The map above reflects the distribution of people across the Municipal Area, with each dot representing 50 people. It<br />
is clear from the map that people are more densely settled, in a scattered low density pattern, on the Ingonyama<br />
Trust land. Higher concentrations of people are evident at the towns (and its immediate surrounding areas) of Ulundi,<br />
Nongoma, Pongola, Emondlo, Vryheid and Paulpietersburg.<br />
The map below the Population Density expressed in persons per km 2 per ward, as resultant from the Census of 2011.<br />
From the map overleaf, the highest densities of people per km 2 is evident around the town of Paulpietersburg, an area<br />
to the east thereof, the town of Pongola and an area to the west thereof, the town of Emondlo and a large area to the<br />
south thereof, an area north of Ceza node, the Nongoma town and surrounds and the town of Ulundi and surrounds.<br />
Densities in these areas exceed 250 persons per km 2 .<br />
Date: May 2013<br />
Page 49 of 194
ZULULAND IDP REVIEW 2013/2014<br />
Map 17: Persons per km 2 per Ward (2011)<br />
2.1.2 HOUSEHOLDS<br />
Table 13: ZDM Population and Households summary 1996, 2001, 2011<br />
<strong>Zululand</strong> 1996 2001 2011<br />
Total population 691,055 760,464 803,575<br />
Number of households 104,110 141,192 157,749<br />
Average household size 6.6 5.4 5.1<br />
Source: Census 2011 Municipal Report<br />
Date: May 2013<br />
Page 50 of 194
Number of households<br />
Average household<br />
size<br />
ZULULAND IDP REVIEW 2013/2014<br />
900 000<br />
800 000<br />
700 000<br />
600 000<br />
500 000<br />
400 000<br />
300 000<br />
200 000<br />
100 000<br />
0<br />
Number of Households<br />
803 575<br />
760 464<br />
691 055<br />
104 110<br />
141 192 157 749<br />
1996 2001 2011<br />
Total population<br />
Number of households<br />
Figure 3: ZDM Population Size and No. of Households summary – 1996, 2001, 2011<br />
2.1.2.1 NUMBER OF HOUSEHOLDS<br />
180 000<br />
160 000<br />
140 000<br />
120 000<br />
100 000<br />
80 000<br />
60 000<br />
40 000<br />
20 000<br />
0<br />
Number of households<br />
104 110<br />
141 192<br />
157 748<br />
1996 2001 2011<br />
The number of households has<br />
increased dramatically between<br />
1996 and 2001, i.e. by 37,082<br />
households. This trend continued<br />
between 2001 and 2011.<br />
Households increased by a further<br />
16,556 households.<br />
Figure 4: Number of Households<br />
2.1.2.2 AVERAGE HOUSEHOLD SIZE<br />
Average household size<br />
10 6.6<br />
5<br />
5.4 5.1<br />
0<br />
1996 2001 2011<br />
The average household size has<br />
decreased significantly between<br />
1996 and 2001 (from an average of<br />
6.6 persons per household to 5.4<br />
persons per household). This<br />
trend continued between 2001<br />
and 2011 (from an average of 5.4<br />
persons per household to 5.1<br />
persons per household).<br />
Figure 5: Average household size<br />
Date: May 2013<br />
Page 51 of 194
ZULULAND IDP REVIEW 2013/2014<br />
2.1.2.3 FEMALE HEADED HOUSEHOLDS<br />
Table 14: % of Female Headed Households<br />
% of Female Headed Households<br />
1996 2001 2011<br />
49.8 53.9 54.2<br />
Source: Census 2011 Municipal Report<br />
90 000<br />
80 000<br />
70 000<br />
60 000<br />
50 000<br />
40 000<br />
30 000<br />
20 000<br />
10 000<br />
0<br />
No. Of households headed<br />
by women<br />
51 882<br />
76 156<br />
85 545<br />
1996 2001 2011<br />
Between 1996 and 2001, there<br />
has been a significant increase<br />
in the % of households headed<br />
by women, i.e. from 49.8% to<br />
53.9%. Between 2001 and 2011<br />
this increased slightly to 54.2%.<br />
A possible reason for this is that<br />
males seek employment outside<br />
of the Municipal area, such as<br />
at Vryheid, Richards Bay,<br />
Durban and Gauteng.<br />
Figure 6: Number of Female Headed Households<br />
2.1.2.4 CHILD HEADED HOUSEHOLDS<br />
Table 15: Child-headed households<br />
ZDM Child-headed households 1996 2001 2011<br />
No. Of households headed by children 2 076 1 823 2 315<br />
% of households headed by children 2.0 1.3 1.5<br />
Source: Census 2011 Municipal Report<br />
Date: May 2013<br />
Page 52 of 194
ZULULAND IDP REVIEW 2013/2014<br />
2 500<br />
2 000<br />
1 500<br />
1 000<br />
500<br />
0<br />
No. of Households<br />
headed by Children<br />
1996 2001 2011<br />
1.5% (or 2,315 households) of all<br />
households within the <strong>Zululand</strong> <strong>District</strong><br />
Municipal Area were headed by<br />
children in 2011. The number of<br />
households headed by children<br />
increased from 1,823 in 2001 to 2,315<br />
in 2011.<br />
Figure 7: Number of Households Headed by Children<br />
2.1.2.5 AGE OF HEAD OF HOUSEHOLD 2011<br />
Table 16: Age of head of household 2011<br />
Age of No. of % of Total<br />
Household Households Households<br />
Head<br />
0 - 14 1,163 0.74<br />
15 - 64 127,648 80.92<br />
65 + 28,936 18.34<br />
Total 157,747 100.00<br />
Source: Statistics South Africa, SuperCROSS.<br />
65 - 120<br />
15 - 64<br />
Age of Head of<br />
Household 2011<br />
28 936<br />
127 648<br />
In 2011, some 18.3% of household within<br />
the <strong>Zululand</strong> <strong>District</strong> Municipal Area is<br />
headed by people aged 65 years and older<br />
(i.e. the elderly).<br />
10 - 14<br />
1 163<br />
Figure 8: ZDM Age of head of Household 2011<br />
2.1.3 GENDER RATIO<br />
2.1.3.1 GENDER RATIO (1996, 2001, 2011)<br />
Table 17: Gender Numbers and Ratio<br />
Year Number of Ratio in %<br />
Male Female Male Female<br />
1996 315 880 375 175 45.71% 54.29%<br />
2001 359 251 420 818 46.05% 53.95%<br />
2011 372 200 431 375 46.32% 53.68%<br />
Date: May 2013<br />
Page 53 of 194
ZULULAND IDP REVIEW 2013/2014<br />
500 000<br />
400 000<br />
300 000<br />
200 000<br />
100 000<br />
0<br />
Gender Ratio<br />
1996 2001 2011<br />
Male<br />
Female<br />
Figure 9: Number of Females and Males – 1996, 2001 and 2011<br />
Gender Ratio 2011<br />
Female<br />
54%<br />
Male<br />
46%<br />
In 1996, 2011 and 2011, the gender ratio<br />
(number of males versus number of females)<br />
within the Municipal area has remained<br />
relatively constant, i.e. 54% female and 46%<br />
male.<br />
A possible reason for the higher number of<br />
females is that males seek employment<br />
outside of the Municipal area, such as at<br />
Richards Bay, Durban and Gauteng.<br />
Figure 10: Gender Ratio (2011)<br />
2.1.3.2 GENDER COMPOSITION OF ZULULAND’S POPULATION<br />
Gender proportions in <strong>Zululand</strong> indicate that there is as higher proportions of females as compared to males. The<br />
highest number of females (131,599) is found in Nongoma and the majority of males are concentrated in Abaqulusi.<br />
Local<br />
<strong>Municipality</strong><br />
Male<br />
Male<br />
Proportion<br />
(%)<br />
Female<br />
eDumbe 35,815 45 43,650 55<br />
uPhongolo 67,435 48 73,047 52<br />
Abaqulusi 120,029 48.5 127,726 51.5<br />
Nongoma 112,672 46.13 131,599 53.9<br />
Ulundi 96,662 47.6 106,501 52.4<br />
Source: Quantec 2011<br />
Female<br />
Proportion<br />
(%)<br />
Date: May 2013<br />
Page 54 of 194
ZULULAND IDP REVIEW 2013/2014<br />
Gender proportions for each municipality and from the table demonstrate that there is significant variation among the<br />
municipalities. Nongoma (53.9%) and eDumbe (55%) have relatively high proportions of females in their respective<br />
populations.<br />
Map 18: Gender Ratio of Males to Females<br />
On the commercial farming land, the ratio of males to females is approximately 1:1. On the Ingonyama Trust land, the<br />
ratio of males to females is mostly 0.85:1. This means for every 100 females, there are 85 males. The most likely<br />
reason for this is is that males seek employment outside of the Municipal area, such as at Richards Bay, Durban and<br />
Gauteng.<br />
Date: May 2013<br />
Page 55 of 194
ZULULAND IDP REVIEW 2013/2014<br />
2.1.4 AGE DISTRIBUTION<br />
Table 18: Age Distribution per <strong>District</strong> in KZN, for KZN and Nationally<br />
Population<br />
DEMOGRAPHICS<br />
Age Structure Dependency Ratio Sex Ratio Population Growth (% p.a.)<br />
MDB Code <strong>Municipality</strong><br />
ZULULAND IDP REVIEW 2013/2014<br />
Figure 11: Age Distribution – 1996, 2001 and 2011<br />
Source: Derived from Census 2011<br />
Figure 12: Age Distribution (2011)<br />
Age groups Total<br />
00 - 04 112 324<br />
05 - 09 102 614<br />
10 - 14 102 770<br />
15 - 19 102 252<br />
20 - 24 79 818<br />
25 - 29 62 875<br />
30 - 34 43 269<br />
35 - 39 35 304<br />
40 - 44 29 949<br />
45 - 49 29 084<br />
50 - 54 25 836<br />
55 - 59 22 492<br />
60 - 64 17 450<br />
65 - 69 11 008<br />
70 - 74 10 421<br />
75 - 79 6 629<br />
80 - 84 5 289<br />
85+ 4 191<br />
Total: 803 575<br />
80 - 84<br />
70 - 74<br />
60 - 64<br />
50 - 54<br />
40 - 44<br />
30 - 34<br />
20 - 24<br />
10 - 14<br />
00 - 04<br />
Total Population in Age Groups<br />
0 20 000 40 000 60 000 80 000 100 000 120 000<br />
In comparing the age distribution of the population within the <strong>Zululand</strong> Municipal Area between 1996, 2001 and 2011,<br />
the following is noted:<br />
There is a steady increase in the number of people per age category from 20 years and older. This means that the<br />
pyramid structure, as presented in the graph is indicating a broadening trend from people aged 20 years and older.<br />
Date: May 2013<br />
Page 57 of 194
ZULULAND IDP REVIEW 2013/2014<br />
The population is becoming older. It is typical of developing countries. Further, the age distribution also indicates a<br />
reduction in the age categories of 5 yrs to 19yrs from 2001 to 2011. What is however interesting to note is the<br />
number of persons in the age category 0 to 4 yrs (or from 2007 to 2011) has increased significantly. The expectation<br />
would have been that this category should also have shrunk. The reason for a “baby boom” from 2007 to 2011 is not<br />
fully known – however this period coincides with the global economic recession. Could it be that due to jobs lost<br />
males have returned to the area and hence the baby boom This, however, is not supported by changes in the<br />
Gender Ration within the Municipal area over the same period.<br />
Age Profile<br />
The age summary statistics show a Mean age of 28 years the country of South Africa, 26 years for KwaZulu Natal. In<br />
comparison, the <strong>Zululand</strong> <strong>District</strong> <strong>Municipality</strong> has a Mean age of 23.6, a Median age of 18 leading to an average of<br />
19.3 which is below the national and provincial average.<br />
In terms of Strategic Planning, this means that there is a need to increase investment and support in infrastructure<br />
plus human development such as education, health and employment.<br />
The table below demonstrates population age distribution in <strong>Zululand</strong> in comparison to the KZN Province.<br />
<strong>Zululand</strong><br />
population<br />
KZN population<br />
Figure 13: Comparison of population age distribution for <strong>Zululand</strong> and KZN<br />
Source: DEDT calculations, Quantec data (2011)<br />
A large percentage of the population is between the ages of one to 19. Young adults continue to dominate the age<br />
statistics which has implications on the municipality to continue to increase Social Support and upliftment<br />
programmes. Greater interaction with stakeholders in the Social Development environment is also required to<br />
respond to the existing situation. Social Development has been prioritized in the Strategic Development Plan of<br />
Council (refer to Strategic Plan).<br />
2.2 KEY FINDINGS (INCLUDING TRENDS)<br />
<br />
The toal Poulation in <strong>Zululand</strong> <strong>District</strong> Municipal Area has increased from 1996 to 2011 by some 10%. This<br />
growth continued between 2001 and 2011 with a further increase of 5.7%. The total Population Size in 2011<br />
was 803,575 people.<br />
The number of households have increased significantly between 1996 (104,110 households) and 2001<br />
(141,192 households) and between 2001 and 2011 (157,749 households).<br />
<br />
The average Household Size has decreased between 1996 and 2011. In 1996, the average household size was<br />
6.6 persons per households. This decreased to an average of 5.1 persons per household in 2011.<br />
Date: May 2013<br />
Page 58 of 194
ZULULAND IDP REVIEW 2013/2014<br />
<br />
<br />
<br />
<br />
<br />
<br />
The highest densities of people per km 2 is evident around the town of Paulpietersburg, an area to the east<br />
thereof, the town of Pongola and an area to the west thereof, the town of Emondlo and a large area to the<br />
south thereof, an area north of Ceza node, the Nongoma town and surrounds and the town of Ulundi and<br />
surrounds. Densities in these areas exceed 250 persons per km 2 .<br />
There has been an increase in the number of households headed by women. In 1996 some 49.8% of<br />
households were headed by women, whilst in 2011 this percentage increased to 54.2%. A possible reason for<br />
this is that males seek employment outside of the Municipal area, such as at Vryheid, Richards Bay, Durban<br />
and Gauteng.<br />
In 2011, some 1.5% of households (or 2,315 households) were headed by children. This is most likely as a<br />
result of the impact of AIDS.<br />
In 2011, some 18.3% (or 28,936 households) were headed by senior citizens older than 65 years of age. This<br />
is also most likely as a result of the impact of AIDS.<br />
In 1996, 2011 and 2011, the gender ratio (number of males versus number of females) within the Municipal<br />
area has remained relatively constant, i.e. 54% female and 46% male. A possible reason for the higher<br />
number of females is that males seek employment outside of the Municipal area, such as at Richards Bay,<br />
Durban and Gauteng.<br />
There is a steady increase in the number of people per age category from 20 years and older. This means<br />
that the pyramid structure, as presented in the graph is indicating a broadening trend from people aged 20<br />
years and older. The population is becoming older. It is typical of developing countries. Further, the age<br />
distribution also indicates a reduction in the age categories of 5 yrs to 19yrs from 2001 to 2011. What is<br />
however interesting to note is the number of persons in the age category 0 to 4 yrs (or from 2007 to 2011)<br />
has increased significantly. The expectation would have been that this category should also have shrunk.<br />
The reason for a “baby boom” from 2007 to 2011 is not fully known – however this period coincides with the<br />
global economic recession.<br />
3. MUNICIPAL TRANSFORMATION & ORGANISATIONAL DEVELOPMENT ANALYSIS<br />
3.1 INSTITUTIONAL ARRANGEMENTS<br />
The municipality consists of six (6) departments namely:<br />
<br />
<br />
<br />
<br />
<br />
<br />
Municipal Manager’s office<br />
Finance Department<br />
Technical Services Department<br />
Planning Department<br />
Corporate Services Department<br />
Community Development Department<br />
These departments are headed by Officials appointed in terms of <strong>Section</strong> 56. The responsibilities and functions of each<br />
of these departments are explained in further in this report.<br />
Date: May 2013<br />
Page 59 of 194
ZULULAND IDP REVIEW 2013/2014<br />
3.1.1 DECISION-MAKING PROCESSES<br />
<br />
<br />
<br />
<br />
o<br />
o<br />
o<br />
o<br />
o<br />
o<br />
o<br />
<br />
The Council of the <strong>Zululand</strong> <strong>District</strong> <strong>Municipality</strong> consists of 34 Councilors, 40% of which are proportionally<br />
elected and 60% elected to the district municipality from respective local municipalities. The Council is<br />
chaired by the Speaker, The Honourable Clllr. S. Hlatshwayo.<br />
The Executive Committee is chaired by His Worship the Mayor Cllr. VZ kaMagwaza Msibi.<br />
In order to ensure that there is synergy, and adequate monitoring and control in the performance of the<br />
municipality towards achieving the strategic goals that Council set itself; the Council established Portfolio<br />
Committees, with each one chaired by an EXCO Member. These Committees meet regularly to track the<br />
progress made from time to time in the implementation of the Integrated Development Plan (IDP) of the<br />
<strong>Municipality</strong>.<br />
The following portfolio committees are operational in the <strong>District</strong>:<br />
Disaster Management, Health and Safety<br />
Finance and Budgeting<br />
LED and Tourism<br />
Community and Social Development<br />
Capex and Water Provision<br />
Planning and GIS<br />
Local Labour<br />
The financial year 2010/2011 was the year in which the <strong>Municipality</strong> established its Oversight Committee and<br />
started to carry out its founding mandate.<br />
3.1.2 COMMUNICATION<br />
The ZDM has a Communication Plan that is regularly reviewed. In addition to the above, alignment between the ZDM<br />
and its Local Municipalities and respective Service Providers is attained via IDP Alignment meetings.<br />
The Council of <strong>Zululand</strong> <strong>District</strong> is committed to the creation of a people centered customer care center that is<br />
efficient, effective and truly accessible to all communities serviced by the municipality. To this end, the Council<br />
procured a Customer Query Logging System (SIZA) to ensure that all communication with the citizens is recorded and<br />
that there are proper and adequate mechanisms to monitor the progress being made from time to time, in resolving<br />
issues raised by the community.<br />
3.1.3 DEPARTMENTAL OVERVIEW<br />
As already noted, the municipality consists of the following six (6) departments:<br />
<br />
<br />
<br />
<br />
<br />
<br />
Municipal Manager’s office<br />
Finance Department<br />
Technical Services Department<br />
Planning Department<br />
Corporate Services Department<br />
Community Development Department<br />
A more in-depth overview of the respective departments will be provided in this section.<br />
3.1.3.1 CORPORATE SERVICES<br />
Date: May 2013<br />
Page 60 of 194
ZULULAND IDP REVIEW 2013/2014<br />
The Corporate Services department is the organizational Supplement Nerve Centre of the <strong>Municipality</strong> which is people<br />
centric, strategy focused and result driven department. In order to ensure that the department is enabled to<br />
efficiently and effectively provide the necessary support to its client departments and other internal customers within<br />
the municipality; the department is structured into five broad thrusts, namely: Management Services, Auxiliary<br />
Services, Communications Services, Airport and Disaster Management. A brief description of these sections/thrusts is<br />
provided herewith:<br />
3.1.3.1.1 Management Services<br />
The responsibility of the Management Division is to ensure provision of the necessary Human Capital, ensuring<br />
professional Labour Relations; Employee Assistance Programme; the development of <strong>Municipality</strong>’s Human Capital<br />
through relevant Training and Development Strategies, which captures critical training interventions; Efficient<br />
Secretariat Support to the Municipal Council and its committees, ensuring a people centric Customer Care, that is<br />
efficient, effective and accessible to the community. In addition, to ensure that Council policies are observed<br />
including the standing rules of order, and that if there are amendments to the policies they are put through the<br />
correct policy processes of the Council.<br />
3.1.3.1.2 Auxiliary Services: Records<br />
Since the implementation of the Electronic Records Management System (EDMS) in 2006 the Council has made<br />
considerable progress in modernizing and improving its Records system. The installation of Collaborator has resulted<br />
in quick and easy cross-referencing and improved service delivery and transparency when it comes to information<br />
management, accessing important documents such as tenders as well as the benefit of having fast workflow<br />
distribution to all relevant departments, sharing and searching for information and finally providing feedback rapidly<br />
and effectively. The main benefit of this system is the minimization of paper copies and the provision of an audit trail<br />
on all documents and correspondence.<br />
The second phase of the EDMS system- the committee management sub-function- has also become up and running to<br />
its full capacity and is used for submitting items, generating agendas and the filing of minutes. .<br />
3.1.3.1.3 Auxiliary Services: Buildings and Maintenance<br />
The function of managing the buildings and maintenance of the <strong>Zululand</strong> <strong>District</strong> <strong>Municipality</strong> consists of overseeing<br />
the head offices, the Queen Silomo Centre, the Prince Mangosuthu Buthelezi Airport, Princess Mandisi Health Care<br />
Centre as well as the 3 satellite offices situated in Vryheid, Phongolo and Nongoma. Other buildings include those<br />
used by the Technical Departments in water works and waste water works.<br />
To manage the risk of water cuts in the area which tend to occur on a regular basis, the municipality has installed its<br />
own borehole. The backup generator is also being serviced regularly after every 250 hrs of usage. This generator is<br />
useful when power is off and it kicks in so as to allow work to continue as we have been experiencing an increase in<br />
power outages in the area. Fire equipment servicing is done regularly to ensure readiness for usage at any given time.<br />
3.1.3.1.4 Auxiliary Services: Fleet Management<br />
The <strong>Zululand</strong> <strong>District</strong> <strong>Municipality</strong> has a total of 66 vehicles which are operating within our satellite offices, water<br />
plants, head office and the Prince Buthelezi airport in Ulundi. The municipal council approved the Fleet Management<br />
Policy which serves as a Management guide on the utilization of the council vehicles.<br />
Date: May 2013<br />
Page 61 of 194
ZULULAND IDP REVIEW 2013/2014<br />
3.1.3.1.5 Airport<br />
The main objective is to make the airport a catalyst and key driver of the <strong>District</strong>’s IDP and LED programmes. A<br />
Strategy document outlining strategies and objectives that need to be implemented to ensure viability of the airport<br />
was produced and it is the yardstick according to which progress and achievements made are measured.<br />
Airport operations are governed by the Civil Aviation Regulations of 1997 as amended from time to time. An<br />
Aerodrome Emergency Management System has been developed as per Regulation 139.02.6 and approved by the<br />
South African Civil Aviation Authority (SACAA) as the legislating body monitoring operations of airports in South Africa.<br />
A Full-scale Emergency Exercise has also been performed successfully thereby convincing the SACAA Inspector that<br />
the airport is capable of responding to an emergency of that specific magnitude.<br />
An Aerodrome Operations Manual has also been developed according to Regulation 139.02.3 and is currently being<br />
reviewed by the SACAA accordingly. Parallel to this, a process of replacing obsolete navigation instruments has also<br />
been initiated since these form part of the prerequisites for upgrading to the required level.<br />
The Airport Strategic Objectives are:<br />
<br />
<br />
<br />
Airport Management<br />
Building and site maintenance<br />
Local and regional tourism development and marketing<br />
3.1.3.1.6 Disaster Management<br />
The core function of Disaster Management Division is to address the following issues, namely:<br />
<br />
<br />
Conducting Disaster Awareness throughout the district<br />
Attending to all disaster incidents in the district<br />
Among the types of disasters, common disasters that normally hit the people in the district are the natural disasters<br />
such as the storm and strong winds.<br />
3.1.3.2 COMMUNITY SERVICES<br />
The Community Services Department comprises the following sections:<br />
<br />
<br />
<br />
<br />
<br />
<br />
<br />
Local Economic Development<br />
Municipal Health<br />
Tourism<br />
Youth, Sport and Recreation<br />
Gender and Disability<br />
Indonsa Arts and Crafts Centre<br />
Princess Mandisi Health Care Centre<br />
3.1.3.3 PLANNING AND WATER SERVICES AUTHORITY<br />
The Planning Department comprises of the following sections:<br />
Date: May 2013<br />
Page 62 of 194
ZULULAND IDP REVIEW 2013/2014<br />
<br />
<br />
<br />
<br />
Planning Administration<br />
Water Service Authority<br />
Geographic Information Systems<br />
Development Planning Shared Services<br />
As such, the following functions of council are performed within the department:<br />
<br />
<br />
<br />
<br />
Integrated Development Planning<br />
Water Service Authority<br />
Solid Waste Management Services<br />
<strong>District</strong> Cemeteries<br />
3.1.3.3.1 Planning Administration<br />
The Planning Administration <strong>Section</strong> comprises of 4 staff members excluding the Development Planning Shared<br />
Services Chief GIS Officer, GIS Officer and <strong>District</strong> Environmental Manager. The section is responsible for the following<br />
functions:<br />
<br />
<br />
<br />
<br />
<br />
<br />
<br />
Integrated Development Planning, including Regional Planning<br />
Environmental Planning<br />
Cemeteries<br />
Solid Waste Management<br />
Public Transport Planning<br />
Geographic Information Systems (GIS)<br />
Performance Management<br />
3.1.3.3.2 Geographic Information Systems<br />
The section comprises of a GIS expert who captures and manipulates and presents data in a form that enables<br />
enhanced decision making in terms of strategic planning and service delivery.<br />
Without this unit, the Planning Department and the municipality as a whole would have a difficult time studying and<br />
translating the spatial and socio economic trends of the <strong>Zululand</strong> area.<br />
Maps are printed on a daily basis for the Planning Department, Sector Departments, Political Office Bearers,<br />
Professionals and other stakeholders, at no cost.<br />
3.1.3.3.3 Development Planning Shared Services<br />
In response to the new statutory function allocated to municipalities in terms of the new Planning and Development<br />
Act, a new unit of called Development Planning Shared Services (DPSS) was established to capacitate and support<br />
municipalities in the <strong>Zululand</strong> area in terms of Development Planning and Geographic Information Systems. Funding<br />
contribution are staggered over a 3 year period with financial support from Co-Operative Governance and Traditional<br />
Affairs. Thereafter, the Shared Services will be funded in total by the <strong>Zululand</strong> Family of Municipalities.<br />
Divided into two Directorates of Planning and GIS, the section consists of 8 staff including Planners, Geographic<br />
Information Systems Officials, Administrators and Secretary.<br />
Date: May 2013<br />
Page 63 of 194
ZULULAND IDP REVIEW 2013/2014<br />
In terms of an arrangement between the <strong>Zululand</strong> Family of Municipalities, the Planning Directorate is placed at<br />
Abaqulusi Local <strong>Municipality</strong> owing to its central location.<br />
The key objective of the Planning Directorate is to assist and capacitate local municipality planners in terms of the new<br />
Planning and Development Act, Statutory and Strategic Planning. The key objective of the GIS Directorate is to assist<br />
local municipalities and the district to manage and upgrade technical GIS capacity.<br />
3.1.3.3.4 Water Services Authority<br />
The section consists of 3 civil engineers and a secretary in the planning and management of the Water Service<br />
Authority function. The responsibility of a Water Services Authority (WSA) is to ensure that water is adequately<br />
provided to every single individual households falling within its area of jurisdiction. The provision of water to<br />
consumers should be in accordance with the minimum quality and quantity standards set by The Department of<br />
Water Affairs (DWA). The Water provision should be sustainable, affordable and efficient.<br />
The Services Authority has the following Duties:<br />
Duty to provide access to water services:<br />
This duty is subject to-<br />
• the availability of resources;<br />
• the need for an equitable allocation of resources to all consumers and potential consumers within the<br />
authority’s area of jurisdiction;<br />
• the need to regulate access to water services in an equitable way, with any prescribed norms and standards<br />
for tariffs for water services;<br />
• the duty of consumers to pay reasonable charges, which must be in accordance with any prescribed norms<br />
and standards for tariffs for water services;<br />
• the duty to conserve water resources;<br />
• the nature, topography, zoning and situation of the land in question; and<br />
• the right of relevant water services authority to limit or discontinue the provision of water services if there is<br />
failure to comply with reasonable conditions set for provision of such service.<br />
In ensuring access to water services, a water services authority must take into account among other factors:<br />
<br />
<br />
<br />
<br />
<br />
<br />
alternative ways of providing access to water services;<br />
the need for regional efficiency;<br />
the need to achieve the benefit of scale;<br />
the need for low costs;<br />
the requirements of equity and<br />
the availability of resources from neighbouring water services authorities.<br />
3.1.3.4 TECHNICAL DEPARTMENT<br />
The strategic objective for the Technical Services Department is to progressively provide cost effective, reliable water<br />
services of good quality to all potential consumers in the district. The core function of the Technical Department is<br />
therefore:<br />
<br />
<br />
<br />
To implement the new infrastructure (Water and Sanitation)<br />
Operation and Maintenance of the secondary bulk and reticulation<br />
Management, Operation and Maintenance of Bulk Water and Waste Water Infrastructure<br />
The key issues were noted to be:<br />
Date: May 2013<br />
Page 64 of 194
ZULULAND IDP REVIEW 2013/2014<br />
<br />
<br />
<br />
<br />
<br />
<br />
<br />
<br />
To improve on the percentage of households with access to basic level of water.<br />
To improve on the percentage of households with access to basic level of sanitation.<br />
To improve on the number of required water quality tests conducted (samples).<br />
To reduce number of plant days down time.<br />
To improve on percentage of households earning less than R1100 pm with access to free water (Note:<br />
Rudimentary LOS included).<br />
To improve on percentage of households earning less than R1100 pm with access to free sanitation.<br />
To improve on communication with customers on planned interruptions before disruptions occur.<br />
To ensure that 100% of MIG grant fund is spent within the financial year.<br />
3.1.3.4.1 Water and Sanitation Provision<br />
Water Service Authority<br />
In terms of the proclamation dealing with the division of powers and functions in 2003 the ZDM was allocated the<br />
Water Services Authority function for the entire <strong>District</strong>.<br />
A <strong>Section</strong> 78 Assessment (Municipal System Act No 32 of 2000) was undertaken by the <strong>Zululand</strong> <strong>District</strong> <strong>Municipality</strong><br />
in 2004.<br />
The aim of the project was to develop;<br />
<br />
An accurate database of assets, staff and finance in order to ring fence the water sector.<br />
Provide the basis for a comprehensive management system for the operational aspects of the service.<br />
Options Considered<br />
Option 1 - Internal Option<br />
ZDM performing the full services provision function (bulk and reticulation) on an in-house basis (internal<br />
Department);<br />
Option 2 - External Option 1<br />
Outsourcing the bulk and reticulation function to Local Municipalities in the northern supply areas of the district<br />
with the ZDM performing both functions in the southern areas<br />
Option 3 - External Option 2<br />
Outsourcing the reticulation function to Local Municipalities in the northern supply areas of the district with the<br />
ZDM performing the reticulation function in the southern areas. In this option the ZDM takes over the bulk<br />
function for the entire district<br />
In terms of the findings of this <strong>Section</strong> 78 assessment, option (1) was adopted by the then Council as it provided the<br />
best option for services provision in the <strong>Zululand</strong> <strong>District</strong>;<br />
The option was accompanied by the identification of core functions and the outsourcing of non-core aspects of the<br />
water business.<br />
Natal Spa Agreement<br />
In terms of the proclamation dealing with the division of powers and functions in 2003 the ZDM was allocated the<br />
Water Services Authority function for the entire <strong>District</strong>.<br />
At that time an agreement was entered into by all services providers in the <strong>District</strong> (ie. Local Municipalities) with the<br />
Water Services Authority called the Natal Spa agreement.<br />
Date: May 2013<br />
Page 65 of 194
ZULULAND IDP REVIEW 2013/2014<br />
In terms of this agreement the assets and staff were transferred to the <strong>District</strong> as WSA and then shifted back to the<br />
Local Municipalities until such time as the <strong>Section</strong> 78 (1-3) was reviewed and completed.<br />
In the period which followed this decision, 4 of the 5 Local Municipalities voluntarily handed the provision function<br />
back to the ZDM leaving only Abaqulusi Local <strong>Municipality</strong> performing the provider function. On the expiry of the<br />
Natal Spa agreement, an executive decision was taken to extend the period of the provider function for Abaqulusi<br />
Local <strong>Municipality</strong>, based on the terms of the Natal Spa Agreement, until such time as a suitable agreement is<br />
reached.<br />
3.1.3.4.2 Institutional Structuring and Alignment<br />
Water Services Development Plan Steering Committee<br />
The Water Service Development Plan Steering Committee is a planning and alignment structure meeting at least four<br />
times a year.<br />
Composition of the committee:<br />
<br />
<br />
<br />
<strong>Zululand</strong> <strong>District</strong> <strong>Municipality</strong><br />
Abaqulusi, Nongoma, Ulundi, eDumbe and uPhongola Local Municipalities<br />
Relevant Sector Departments<br />
Contracted Service Providers<br />
The purpose of the Steering Committee is to advise respective Councils on the review, implementation and<br />
implementation monitoring of the Water Services Development Plan.<br />
Water Service Provider Meetings<br />
This structure is a working committee which steers the technical work of Water Service Providers and Contracted<br />
Service Providers. Meetings are held monthly and comprise of the <strong>Zululand</strong> <strong>District</strong>, Service Providers and the Water<br />
Service Providers.<br />
Policies and Bylaws<br />
Water Services Development Plan<br />
The <strong>Zululand</strong> <strong>District</strong> <strong>Municipality</strong> has developed a Water Service Development Plan in terms of the Water Act. The<br />
plan profiles communities, identifies areas of supply and maps out the water and sanitation roll out with costs over a<br />
multi-year period.<br />
The plan is reviewed annually and tabled to Council for adoption.<br />
Water Loss Strategy and Bylaws<br />
One of the challenges of a Water Service Authority is to account for all water moving in and out of the system. Various<br />
mechanisms are used to monitor this activity. However, there are various factors which beat monitoring activities<br />
which means that the authority must constantly evolve in order to account for all water. In certain instances, outdated<br />
infrastructure or burst pipes may contribute to water loss which is picked up quickly. However, in certain instances<br />
water loss is due to criminal behaviour. In order to manage water loss effectively, a water loss strategy has been<br />
developed and is regularly reviewed. In order to combat criminal behaviour it is community awareness via political<br />
intervention and application of the water services bylaws which the municipality has at its disposal.<br />
Date: May 2013<br />
Page 66 of 194
ZULULAND IDP REVIEW 2013/2014<br />
3.1.3.4.3 Project Management Unit<br />
The Project Management Unit is basically responsible for the implementation of all the capital projects within the<br />
district. The unit has a total of 6 technical officers, two Institutional Social Development Officers (ISDO) and a Senior<br />
Project Administrator.<br />
In the 2010-2011 financial year an allocation of R 188 million was received from MIG and was successfully spent 100%<br />
by the end of June 2011. The largest percentage, 77%, was spent on water, 20% was spent on sanitation and 3% on<br />
sporting facilities. The large amount of money is currently spent in the development of bulk infrastructure and as the<br />
bulk line passes through communities, reticulation networks are installed. Where the communities are experiencing<br />
acute shortage of water, the rudimentary programme is in place to bring temporal relief and where there are no<br />
reliable sources, water tankering is taking place.<br />
<strong>Zululand</strong> <strong>District</strong> <strong>Municipality</strong>, for sustainable water supply, is divided into ten (10) regional schemes with reliable<br />
water sources.<br />
3.1.3.4.4 Water Services Provision: Urban and Rural Reticulation<br />
The main function of the “Urban and Rural Reticulation <strong>Section</strong>” division is to operate and maintain the water and<br />
sanitation networks in both urban and rural areas within the Local Municipalities that make up the <strong>Zululand</strong> <strong>District</strong><br />
<strong>Municipality</strong>. This section further manages the provision of Emergency Water under the Drought Relief Programme.<br />
At present all urban areas are serviced with water and sanitation which is metered and they also receive the 6 kilolitre<br />
Free Basic Water per month.<br />
The <strong>Zululand</strong> <strong>District</strong> <strong>Municipality</strong> has ten Regional Schemes which are still in progress in terms of construction. Within<br />
these regional schemes there are further small stand-alone rural schemes:<br />
Table 20: Regional Schemes<br />
Regional Water Supply Scheme Number of Water Supply<br />
Schemes<br />
Nkonjeni RWSS 33<br />
Usuthu RWSS 39<br />
Mandlakazi RWSS 31<br />
Gumbi/Candover RWSS 2<br />
Simdlangentsha East RWSS 20<br />
Simdlangentsha Central RWSS 12<br />
Simdlangentsha West RWSS 27<br />
Corronation RWSS 2<br />
Khambi RWSS 23<br />
Hlahlindlela RWSS 23<br />
Source: WSDP 2012<br />
<strong>Zululand</strong> <strong>District</strong> <strong>Municipality</strong> is currently utilizing the water-management devices (WMD’s) in urban areas that were<br />
introduced to enable the municipality to measure and control the quantities of water consumed or preferred by the<br />
consumer. Those who want to be limited to FBW can also be provided on daily or monthly bases. The schemes in the<br />
rural areas are not metered as they are considered to be consuming water less than the FBW. Zone meters have been<br />
Date: May 2013<br />
Page 67 of 194
ZULULAND IDP REVIEW 2013/2014<br />
installed to monitor the above situation and if the consumption indicate viability of metering water, that will be<br />
considered in the due course.<br />
Currently there are eight reaction teams and contract ZDM 799/2009 is in place with a roster of service providers to<br />
provide emergency repairs to water infrastructure.<br />
Despite the rudimentary programme that is in progress, water tankers had to be deployed to those areas with acute<br />
shortage of water.<br />
3.1.3.5 FINANCIAL DEPARTMENT<br />
3.1.3.5.1 Financial Institutional Structuring<br />
Policies and Plans<br />
Various financial policies and plans are in place. The Indigent Policy and the Funding and Reserves Policy are to be<br />
developed (refer to page 67 for status of sector plans).<br />
Human Capacity Highlights (as at May 2012)<br />
<br />
<br />
<br />
<br />
The top structure comprises the CFO, two Deputies and two Chief Accountants<br />
All posts have been filled and there are no vacancies<br />
The posts of a Chief Accountant and a Customer Care Officer have been included in the 2012-2013 budget.<br />
Human Resources within the Finance Department is considered adequate<br />
Internal and external Consultation structures<br />
<br />
<br />
The Finance and Budgeting Portfolio Committee is responsible for initiating policy discussions and advises<br />
EXCO accordingly<br />
The Budget Steering Committee is in place<br />
CFO’s Forum<br />
There has been a high turn-over of CFOs within the colleague municipalities which has disturbed the rhythm in<br />
establishing co-operation and sharing of experience and best practices in financial management.<br />
For the 2011/2012 financial year, one meeting has already been postponed in march and one was held successfully in<br />
April 2012.<br />
Training and Development<br />
<br />
<br />
<br />
The CFO and one Deputy are almost complete with CPMD training modules<br />
The MM, CFO and Deputy CFOs have attended GRAP training.<br />
Middle management and Interns are presently undergoing training to meet the minimum competency<br />
requirements<br />
3.1.3.5.2 Financial Management Challenges<br />
Indigent Population<br />
Date: May 2013<br />
Page 68 of 194
ZULULAND IDP REVIEW 2013/2014<br />
Like many other <strong>District</strong>s, the majority of the population in the <strong>Zululand</strong> <strong>District</strong> <strong>Municipality</strong> is indigent<br />
(approximately 80%) and that means a small revenue base. Therefore a significant portion of the budget goes<br />
towards infrastructure development with very little revenue generated.<br />
Cross Subsidisation<br />
Cross subsidisation is also very low because of the huge ratio between indigents and those citizens who can afford to<br />
pay for municipal services.<br />
Water Losses<br />
The municipality has experienced huge water losses which have been challenged by the Auditor General. A Water<br />
Loss Strategy has been developed to combat this issue.<br />
3.2 POWERS & FUNCTIONS<br />
Table 21: ZDM Powers & Functions<br />
Function<br />
Responsible Department<br />
IDP<br />
Planning & Community Development<br />
Water Supply (National Fx)<br />
Planning & Community Development<br />
Electricity (National Fx)<br />
Planning & Community Development<br />
Sewerage Systems (National Fx)<br />
Planning & Community Development<br />
Solid Waste<br />
Planning & Community Development<br />
Municipal Roads (<strong>District</strong>)<br />
Regulation of passenger transport services<br />
Municipal Airports (<strong>District</strong>)<br />
Municipal Health (National Fx)<br />
Fire Fighting Services<br />
Fresh Produce Markets, Abbatoirs<br />
<strong>District</strong> Cemeteries<br />
Technical Services<br />
Planning & Community Development<br />
Planning & Community Development<br />
Planning & Community Development<br />
Corporate Services<br />
Planning & Community Development<br />
Planning & Community Development<br />
<strong>District</strong> Tourism<br />
Planning & Community Development<br />
Date: May 2013<br />
Page 69 of 194
ZULULAND IDP REVIEW 2013/2014<br />
Function<br />
Responsible Department<br />
Public Works<br />
Technical Services<br />
Grants distribute<br />
Collection of levies<br />
Other: Disaster Management<br />
Financial Department<br />
Financial Department<br />
Corporate Services<br />
No. Functions as per the Constitution of the Republic of South What has been done<br />
Africa; Municipal Structures Act<br />
1. Integrated development planning for the district municipality Regional/Sectoral Planning,<br />
Spatial Planning Land Use Policy<br />
2. Bulk supply water Provision and regulation<br />
3. Bulk sewage purification works and main sewage disposal Provision<br />
4. Municipal (district) roads Not yet defined<br />
5. Regulation of passenger transport services planning of infrastructure<br />
Regulating (permits, control)<br />
6. Municipal airports (regional) operation, management<br />
7. Municipal health services Limited to Environmental health<br />
services and Includes regulation<br />
of Air and noise pollution, storm<br />
water management, water and<br />
sanitation, refuse and solid waste<br />
disposal<br />
8. Fire fighting services Planning, coordinating and<br />
regulating<br />
Standardization of<br />
infrastructure, vehicles and<br />
procedures<br />
Disaster Management Plan<br />
9. The establishment, conduct and control of fresh produce<br />
markets and abattoirs serving the area of the district<br />
The need for a regional fresh<br />
produce market does not exist.<br />
municipality<br />
10. The establishment, conduct and control of cemeteries and<br />
crematoria<br />
The study revealed that there is<br />
no need for a regional<br />
cemeteries<br />
Date: May 2013<br />
Page 70 of 194
ZULULAND IDP REVIEW 2013/2014<br />
11. Promotion of local tourism for the area of the district<br />
municipality<br />
12. Municipal public works relating to any of the above functions or<br />
any other functions assigned to the district municipality<br />
13. The receipt, allocation and if applicable the distribution of<br />
grants made to the district municipality<br />
Co-ordination, strategic planning<br />
construction and maintenance of<br />
public infrastructure and<br />
facilities<br />
The grants gazette for ZDM are<br />
received and spent according the<br />
grant conditions. ZDM does not<br />
distribute grants.<br />
3.3 ORGANISATIONAL STRUCTURE / ORGANOGRAM<br />
Figure 14: High-level Municipal Organogram<br />
Honourable Mayor<br />
Cllr. VZ KaMagwaza-Msibi<br />
Deputy Mayor:<br />
Cllr S.E. Qwabe<br />
Speaker:<br />
Cllr. H. Hlatshwayo<br />
Municipal Manager<br />
Mr J.H. De Klerk<br />
DD: Office of the<br />
Mayor<br />
HOD: Planning<br />
CFO<br />
HOD: Corporate<br />
Services<br />
HOD: Community<br />
Services<br />
HOD: Technical<br />
Services<br />
GIS Manager:<br />
Shared Services<br />
DD: Expenditure<br />
DD: Auxilliary<br />
Services<br />
DD: Community<br />
Services<br />
DD: Bulk Water<br />
Infrastructure<br />
North<br />
DD: Planning<br />
DD: Income<br />
DD: Human<br />
Resources<br />
Manager: Indonsa<br />
Arts and Craft<br />
Centre<br />
DD: Bulk Water<br />
Infrastructure<br />
South<br />
DD: Water Services<br />
Chief<br />
Planner:Shared<br />
Services<br />
DD: Airport<br />
Management<br />
DD: Disaster<br />
Management<br />
Manager: Princess<br />
Mandisi HIV/AIDS<br />
Centre<br />
DD: Economic<br />
Development<br />
DD: Operations and<br />
Maintenance<br />
(vacant)<br />
DD: Project<br />
Management Unit<br />
Date: May 2013<br />
Page 71 of 194
ZULULAND IDP REVIEW 2013/2014<br />
3.4 MUNICIPAL INSTITUTIONAL CAPACITY & STATUS OF CRITICAL POSTS<br />
The most recent published information provides the following details on occupational levels:<br />
Table 22: ZDM Occupational Levels<br />
Occupational Levels Male Female Foreign<br />
Nationals<br />
A C I W A C I W Male Female<br />
Total<br />
Top management 19 0 0 0 15 0 0 0 0 0 34<br />
Senior management 12 0 0 2 6 1 0 0 0 0 21<br />
Professionally qualified and<br />
experienced specialists and midmanagement<br />
Skilled technical and academically<br />
qualified workers, junior<br />
management, supervisors, foremen,<br />
and superintendents<br />
Semi-skilled and discretionary decision<br />
making<br />
5 0 1 2 3 0 0 0 0 0 11<br />
144 0 0 2 68 1 0 1 0 0 216<br />
144 0 0 0 36 0 0 2 0 0 182<br />
Unskilled and defined decision making 16 0 0 0 7 0 0 0 0 0 23<br />
TOTAL PERMANENT 340 0 0 6 135 2 0 3 0 0 487<br />
Temporary employees 250 0 1 4 38 0 0 0 0 0 293<br />
GRAND TOTAL 590 0 1 10 173 2 0 3 0 0 780<br />
3.5 HUMAN RESOURCE DEVELOPMENT<br />
3.5.1 HUMAN RESOURCE ADMINISTRATION<br />
3.5.1.1 CORE FUNCTIONS<br />
<br />
<br />
<br />
<br />
<br />
<br />
Recruitment and selection<br />
Engagements and terminations<br />
Keeping and updating of personal files<br />
Administration of staff benefits<br />
Employment Equity Planning and Reporting (<strong>Section</strong> 21 EEA)<br />
Attendance registers, Leave administration and Management<br />
3.5.2 TRAINING AND DEVELOPMENT<br />
3.5.2.1 CORE FUNCTIONS<br />
<br />
<br />
Represent Council pertaining to Training and Development matters (Secondary SDF)<br />
Conduct and analyze skills audits<br />
Date: May 2013<br />
Page 72 of 194
ZULULAND IDP REVIEW 2013/2014<br />
<br />
<br />
<br />
<br />
<br />
Prepare and implement WSP<br />
Plan , Co-ordinate and Implement Training<br />
Report on training implemented – Annual Training Reports<br />
Prepare Training budget and Monitor expenditure of the training budget.<br />
Act as Corporate Services IT representative<br />
3.5.3 LABOUR RELATIONS<br />
3.5.3.1 CORE FUNCTIONS<br />
<br />
<br />
<br />
<br />
<br />
<br />
To Implement Council HR Policies and Procedures<br />
To represent Council in the CCMA and Bargaining Council<br />
Monitor and administer disciplinary processes<br />
To advise the <strong>Municipality</strong> on the implementation of relevant policies<br />
Monitor the Labour Relations trends and advise on the changes accordingly<br />
Monitor and update HR policies in line with changes from time to time<br />
3.5.4 HUMAN RESOURCE POLICIES AND LEGISLATION<br />
The policies applicable to Human Resource are among others the following which are all captured into the policy and<br />
procedure manual of the <strong>Municipality</strong>.<br />
3.5.4.1 EXISTING POLICIES<br />
<br />
<br />
<br />
Occupational Health and Safety Policy<br />
Employee Assistance Programme Policy<br />
HR Policy: Disciplinary Policy, Death, leave etc<br />
3.5.4.2 LEGISLATION<br />
<br />
<br />
<br />
<br />
<br />
<br />
Basic Conditions of Employment Act<br />
Labour Relations Act<br />
Occupational Health and Safety Act<br />
Skills Development Act<br />
Employment Equity Act<br />
Disciplinary Procedures Collective Agreement (SALGBC)<br />
3.5.4.3 POLICIES TO BE REVIEWED<br />
Occupational Health and Safety Policy<br />
Employee Assistance Programme Policy<br />
HR Policy: Disciplinary Policy, Death, leave etc<br />
Date: May 2013<br />
Page 73 of 194
ZULULAND IDP REVIEW 2013/2014<br />
3.5.4.4 POLICIES TO BE FORMULATED<br />
<br />
<br />
<br />
Selection and Recruitment Policy<br />
Scarce Skills and Retention policy<br />
Training and Development Policy<br />
3.5.5 HUMAN RESOURCE RELATED PROGRAMMES<br />
<br />
<br />
<br />
<br />
New employees Induction Programme<br />
Training and Development Programme<br />
Employee Assistance Programme<br />
Occupational Health and Safety Programme<br />
3.5.5.1 PROGRAMMES TO BE DEVELOPED<br />
<br />
<br />
Employee Assistance Programme<br />
Occupational Health and Safety Programme<br />
3.5.6 HUMAN RESOURCE RELATED FORUMS AND COMMITTEES<br />
<br />
<br />
<br />
Local Labour Forum<br />
Training and Development Committee<br />
Occupational Health and Safety Representatives Forum<br />
3.6 MUNICIPAL TRANSFORMATION & ORGANISATIONAL DEVELOPMENT: SWOT ANALYSIS<br />
3.6.1 STRENGTHS/OPPORTUNITIES<br />
<br />
<br />
<br />
<br />
<br />
<br />
<br />
<br />
<br />
Well-functioning Portfolio, EXCO and Council structures.<br />
Communication Plan and IDP Alignment processes in place.<br />
MTAS in place.<br />
Implementation of the Electronic Records Management System (EDMS) since 2006 has made considerable<br />
progress in modernizing and improving ZDMs Records system.<br />
Sub-forums under the Local Economic Development Forum include Tourism and the recently established<br />
General Business and Agricultural forums.<br />
LED Directorate’s achievements created further opportunities for growth and development.<br />
Functional GIS section.<br />
Planning Shared Services in place.<br />
Compliance with financial requirements and submission deadlines<br />
Date: May 2013<br />
Page 74 of 194
ZULULAND IDP REVIEW 2013/2014<br />
3.6.2 WEAKNESSES/THREATS<br />
<br />
<br />
<br />
Support and buy-in from government departments and local municipal structures cannot be ensured.<br />
Limited functioning Council oversight committee.<br />
LLF (Local Labour Forum) does not meet regularly.<br />
4. SERVICE DELIVERY & INFRASTRUCTURE ANALYSIS<br />
The tables overleaf provides a summary of the status of service delivery to all <strong>District</strong>s and Local Municipalities within<br />
the Province, as per the 2011 StatsSA data:<br />
Date: May 2013<br />
Page 75 of 194
ZULULAND IDP REVIEW 2013/2014<br />
Table 23: A summary of the status of service delivery to all <strong>District</strong>s within the Province<br />
Water Sanitation Refuse removal Electricity<br />
Municipalities<br />
No. of Households<br />
Households<br />
Serviced<br />
Percentage<br />
Households<br />
Serviced<br />
Percentage<br />
Households<br />
Serviced<br />
Percentage<br />
Households<br />
Serviced<br />
Percentage<br />
Ugu 179440 61691 34% 93994 54% 44137 25% 128971 72%<br />
uMgungundlovu 272666 213495 78% 202881 74% 120856 44% 234744 86%<br />
uThukela 147286 73880 50% 90738 62% 48822 33% 109693 74%<br />
uMzinyathi 113469 38990 34% 63385 56% 22902 20% 55489 49%<br />
Amajuba 110963 84220 76% 70209 63% 63737 57% 92971 84%<br />
<strong>Zululand</strong> 157748 83978 53% 82569 52% 32274 20% 110055 70%<br />
uMkhanyakude 128195 47406 37% 70399 55% 11533 9% 49208 38%<br />
uThungulu 202976 131992 65% 115284 57% 59983 30% 153780 76%<br />
iLembe 157692 69631 44% 99519 63% 54238 34% 112573 71%<br />
Sisonke 112282 36729 33% 55593 50% 23293 21% 70099 62%<br />
eThekwini 956713 772025 81% 773959 81% 823872 86% 859742 90%<br />
Date: May 2013<br />
Page 76 of 194
ZULULAND IDP REVIEW 2013/2014<br />
Table 24: A summary of the status of service delivery to all <strong>District</strong>s and Local Municipalities within the Province<br />
Municipalities<br />
No. of Households<br />
Households<br />
Serviced<br />
Water Sanitation Refuse removal Electricity<br />
Percentage<br />
Households<br />
Serviced<br />
Percentage<br />
Households<br />
Serviced<br />
Percentage<br />
Households<br />
Serviced<br />
Ugu 179440 61691 34% 93994 54% 44137 25% 128971 72%<br />
Vulamehlo 16135 2705 17% 8047 50% 274 2% 5951 37%<br />
uMdoni 22869 12075 53% 14231 62% 12007 53% 17448 76%<br />
uMzumbe 35171 4763 14% 9152 26% 417 1% 17241 49%<br />
uMuziwabantu 21619 3984 18% 10801 50% 3402 16% 17360 80%<br />
eZinqoleni 11472 1640 14% 8221 72% 160 1% 9170 80%<br />
Hibiscus Coast 72175 36525 51% 43543 60% 27876 39% 61801 86%<br />
uMgungundlovu 272666 213495 78% 202881 74% 120856 44% 234744 86%<br />
uMshwathi 28124 17797 63% 20345 72% 4253 15% 20446 73%<br />
uMngeni 30490 26405 87% 23809 78% 20694 68% 26061 85%<br />
Mpofana 10452 7780 74% 7231 69% 5020 48% 7519 72%<br />
Impendle 8203 4407 54% 3460 42% 247 3% 6854 84%<br />
Msunduzi 163993 141949 87% 127048 77% 87269 53% 150713 92%<br />
Mkhambathini 14964 7910 53% 9536 64% 822 5% 9758 65%<br />
Richmond 16440 7251 44% 11451 70% 2551 16% 13395 81%<br />
uThukela 147286 73880 50% 90738 62% 48822 33% 109693 74%<br />
Emnambithi 58058 39492 68% 41693 72% 33715 58% 47678 82%<br />
Indaka 20035 11240 56% 9357 47% 2683 13% 11654 58%<br />
uMtshezi 19252 12008 62% 12368 64% 9681 50% 14096 73%<br />
Okhahlamba 27576 8030 29% 15806 57% 2546 9% 20786 75%<br />
Imbabazane 22365 3109 14% 11514 51% 193 1% 15907 71%<br />
uMzinyathi 113469 38990 34% 63385 56% 22902 20% 55489 49%<br />
eNdumeni 16851 14053 83% 14457 86% 12922 77% 13335 79%<br />
Nquthu 31612 10126 32% 13831 44% 2694 9% 16768 53%<br />
Msinga 37724 4490 12% 17380 46% 493 1% 9478 25%<br />
uMvoti 27282 10321 38% 17717 65% 6794 25% 15907 58%<br />
Percentage<br />
Date: May 2013<br />
Page 77 of 194
ZULULAND IDP REVIEW 2013/2014<br />
Municipalities<br />
No. of Households<br />
Households<br />
Serviced<br />
Water Sanitation Refuse removal Electricity<br />
Percentage<br />
Households<br />
Serviced<br />
Percentage<br />
Households<br />
Serviced<br />
Percentage<br />
Households<br />
Serviced<br />
Amajuba 110963 84220 76% 70209 63% 63737 57% 92971 84%<br />
Newcastle 84272 71634 85% 60555 72% 59868 71% 73449 87%<br />
eMadlangeni 6252 2410 39% 2968 47% 1510 24% 3032 48%<br />
Dannhauser 20439 10175 50% 6685 33% 2358 12% 16490 81%<br />
<strong>Zululand</strong> 157748 83978 53% 82569 52% 32274 20% 110055 70%<br />
eDumbe 16138 10400 64% 11570 72% 3344 21% 10127 63%<br />
uPhongolo 28772 15026 52% 12334 43% 5563 19% 21004 73%<br />
Abaqulusi 43299 30604 71% 25590 59% 17985 42% 31223 72%<br />
Nongoma 34341 9435 27% 12088 35% 1461 4% 21851 64%<br />
uLundi 35198 18513 53% 20988 60% 6922 20% 25850 73%<br />
uMkhanyakude 128195 47406 37% 70399 55% 11533 9% 49208 38%<br />
uMhlabuyalingana 33857 10106 30% 20994 62% 472 1% 4814 14%<br />
Jozini 38849 11784 30% 19542 50% 4271 11% 11301 29%<br />
Big five false bay 7998 3481 44% 6180 77% 1473 18% 3405 43%<br />
Hlabisa 12586 4322 34% 9492 75% 678 5% 6978 55%<br />
Mtubatuba 34905 17173 49% 14191 41% 4640 13% 22709 65%<br />
uThungulu 202976 131992 65% 115284 57% 59983 30% 153780 76%<br />
Mbonambi 25584 14182 55% 11163 44% 1837 7% 21417 84%<br />
uMhlathuze 86609 80004 92% 66294 77% 46326 53% 80955 93%<br />
Ntambanana 12826 2858 22% 5852 46% 281 2% 7956 62%<br />
uMlalazi 45062 18787 42% 16911 38% 7142 16% 26238 58%<br />
Mthonjaneni 10433 4956 48% 5321 51% 2650 25% 7191 69%<br />
Nkandla 22463 11205 50% 9743 43% 1746 8% 10022 45%<br />
iLembe 157692 69631 44% 99519 63% 54238 34% 112573 71%<br />
Mandeni 38235 20753 54% 25945 68% 10508 27% 31533 82%<br />
KwaDukuza 70284 35143 50% 47888 68% 42678 61% 63408 90%<br />
Ndwedwe 29200 10912 37% 16850 58% 670 2% 10892 37%<br />
Percentage<br />
Date: May 2013<br />
Page 78 of 194
ZULULAND IDP REVIEW 2013/2014<br />
Municipalities<br />
No. of Households<br />
Households<br />
Serviced<br />
Water Sanitation Refuse removal Electricity<br />
Percentage<br />
Households<br />
Serviced<br />
Percentage<br />
Households<br />
Serviced<br />
Percentage<br />
Households<br />
Serviced<br />
Maphumulo 19973 2822 14% 8835 44% 382 2% 6739 34%<br />
Sisonke 112282 36729 33% 55593 50% 23293 21% 70099 62%<br />
Ingwe 23073 7370 32% 10821 47% 1085 5% 11511 50%<br />
KwaSani 3673 2817 77% 2633 72% 1586 43% 2769 75%<br />
Greater kokstad 19140 14312 75% 15458 81% 14170 74% 15443 81%<br />
Ubuhlebezwe 23487 4981 21% 13199 56% 2897 12% 12649 54%<br />
uMzimkhulu 42909 7248 17% 13482 31% 3556 8% 27660 64%<br />
eThekwini 956713 772025 81% 773959 81% 823872 86% 859742 90%<br />
Percentage<br />
Date: May 2013<br />
Page 79 of 194
ZULULAND IDP REVIEW 2013/2014<br />
Large disparities are apparent in terms of the nature and structure of the built environment with the most significant<br />
disparity between the level of services and development in the rural and urban areas of the <strong>District</strong>. The towns have<br />
comparatively good levels of infrastructure and services.<br />
With regard to service provision the following should be noted:<br />
<br />
<br />
<br />
The ZDM has an indigent policy in place.<br />
Free Basic Services (FBS) in respect of water is provided to all by the ZDM, i.e. 6KL free per household per<br />
month.<br />
The ZDM is not an electricity service provider.<br />
4.1 WATER & SANITATION PROVISION<br />
The <strong>Zululand</strong> <strong>District</strong> <strong>Municipality</strong> has conducted a <strong>Section</strong> 78 assessment for the water and sanitation sector in terms<br />
of the requirements of the Municipal Systems Act (32 of 2000). The aim of this assessment being to develop options<br />
to enable the <strong>District</strong> Council to make balanced decisions as to which is the most appropriate services provider option<br />
to pursue.<br />
4.1.1 APPROACH TO WATER & SANITATION PROVISION<br />
Water provision is a key development issue in the <strong>Zululand</strong> <strong>District</strong> <strong>Municipality</strong>. The <strong>Zululand</strong> <strong>District</strong> <strong>Municipality</strong>, in<br />
terms of the Water Services Act 1 , is the Water Services Authority in respect of its area of jurisdiction. A Water Services<br />
Plan 2 has been developed and is reviewed on an annual basis. The RDP standard for water supply (and the ultimate<br />
goal for water provision) is 25l/person/day within 200m walking distance. However, a rudimentary water supply<br />
process is currently underway to expedite the supply of water to all by ensuring that every settlement has access to a<br />
minimum of 5 l/person/day within 800 m of the home.<br />
<strong>Zululand</strong> <strong>District</strong> <strong>Municipality</strong> has adopted a Free Basic Water Services policy, as part of the WSDP, as follows:<br />
<br />
<br />
<br />
All households will receive six kilolitres of potable water free of charge for domestic use.<br />
Industrial, commercial and institutional consumers do not qualify for free basic services.<br />
All water supplied from standpipes and rudimentary systems will be free.<br />
The following table defines this policy further:<br />
Table 25 Water Services Policy<br />
Service<br />
Number<br />
Level<br />
Level of Water Service Definition Free Basic Water Policy<br />
DW1 Full pressure<br />
conventional house<br />
connection<br />
DW2 Yard tank (RDP<br />
standard)<br />
Direct unrestricted full pressure (24m)<br />
connection to the reticulation system,<br />
metered and billed<br />
Restricted (to 200l per day) individual<br />
erf connection with tank in yard<br />
Stepped block tariff (with<br />
first block at zero charge<br />
free to all households)<br />
All water at no charge<br />
1 Act 108 of 1997 <strong>Section</strong> II G<br />
2 Water Services Act <strong>Section</strong> 12.<br />
Date: May 2013<br />
Page 80 of 194
ZULULAND IDP REVIEW 2013/2014<br />
Service<br />
Number<br />
Level<br />
Level of Water Service Definition Free Basic Water Policy<br />
DW3<br />
Communal street tap<br />
(RDP standard)<br />
Unrestricted full pressure standpipe<br />
not further than 200m from dwellings<br />
(shared by a number of consumers)<br />
All water at no charge<br />
DW4 Rudimentary system Formalised supply:<br />
Source: WSDP 2012<br />
Borehole equipped with<br />
hand pump<br />
Protected spring<br />
Communal standpipe further<br />
than 200m from dwellings<br />
All water at no charge<br />
Table 26 Free Basic Sanitation Policy<br />
Service<br />
Level<br />
Number<br />
Level of Sanitation<br />
Service<br />
Definition<br />
Free Basic Sanitation Policy<br />
DS1 Water borne<br />
sewage<br />
Unrestricted connection to<br />
municipal sewerage system<br />
Included in free basic water<br />
allocation<br />
DS2 Septic tank or<br />
similar facility<br />
On-site disposal (selftreatment)<br />
DS3 Conservancy tank Localized sewage temporary<br />
storage facility<br />
No charge<br />
No charge to selected<br />
households in specific areas<br />
as determined by the<br />
municipality, aligned to free<br />
basic water policy for service<br />
level DW4<br />
DS4<br />
Source: WSDP 2012<br />
Ventilated improved<br />
pit (VIP) latrine<br />
Dry pit with sufficient<br />
capacity on-site disposal<br />
based on set standards<br />
No charge<br />
The developmental approach and motivation for the various levels of service offered by the municipality is explained<br />
in the policy. This free basic services policy is based on the same approach and is also subject to affordability and<br />
economic viability, so the municipality may review the policy based on practical realities with regard to consumption<br />
and financial viability of metering and billing from time to time.<br />
The municipality is aware that consumption in rural areas is steadily increasing. To measure consumption in<br />
unmetered zones, the municipality uses the water balance to determine consumption. Although the free basic water<br />
policy is implemented and no metering is intended in these zones immediately, the financial viability threshold (based<br />
on consumption and costs) will determine whether and when metering and/or billing may be introduced.<br />
The <strong>Zululand</strong> <strong>District</strong> Water Services Plan gives a clear indication as to where and when water infrastructure will be<br />
provided in the <strong>District</strong>. It provides a clear indication of what amount of water capital infrastructure will be provided<br />
when and at what cost and during which year.<br />
There are two main programmes that are utilized for the implementation of water and sanitation services. The<br />
Department of Water Affairs and Forestry provides funding for specifically water and sanitation infrastructure<br />
development. The Municipal Infrastructural Grant funds various infrastructure projects, not only limited to water and<br />
Date: May 2013<br />
Page 81 of 194
ZULULAND IDP REVIEW 2013/2014<br />
sanitation, but will exclusively be utilized by the ZDM for water and sanitation infrastructure provision during the next<br />
5 years.<br />
Sanitation in the rural areas is being provided in the form of dry-pit VIP toilets and the strategy is to implement these<br />
simultaneously with the roll-out of water services. This ensures a more effective impact with health and hygiene<br />
awareness training.<br />
The following should be noted:<br />
Rudimentary water supply provides 5l per capita per day within a distance of 800m.<br />
<br />
<br />
RDP water supply roll-out (Regional Water Supply). Provides for 25l per capita per day within a distance of<br />
200m.<br />
Rural Sanitation to the RDP standard of 1 dry-pit VIP per household.<br />
4.1.2 POTABLE WATER BACKLOG<br />
Table 27: Water Backlogs (WSDP 2013)<br />
Rudimentary<br />
Communal<br />
standpipes Yard connections TOTALS<br />
Water None or Inadequate RDP<br />
AbaQulusi LM 0 0 0 15 283 15 283<br />
eDumbe LM 0 0 0 5 157 5 157<br />
Nongoma LM 0 0 0 1239 1 239<br />
Ulundi LM 0 0 0 5 520 5 520<br />
uPhongolo LM 0 0 0 3 557 3 557<br />
Total (urban) 0 0 0 30 756 30 756<br />
AbaQulusi LM 7 662 1 613 6497 9 247 25 019<br />
eDumbe LM 3 210 713 1180 6 620 11 723<br />
Nongoma LM 13 411 10 407 8 561 4 553 36 932<br />
Ulundi LM 8 593 3 600 9 361 10 291 31 845<br />
uPhongolo LM 5 830 1520 1526 12 703 21 579<br />
Total (rural) 38 706 17 853 27 125 43 414 127 098<br />
Total (households) 38 706 17 853 27 125 74 170 157 854<br />
The table below sets out a comparison of community’s access to piped water in 1996, 2001 and 2011:<br />
Table 28: Comparison of Access to Piped Water – 1996, 2001 and 2011 (StatsSA)<br />
<strong>Zululand</strong> 1996 2001 2011<br />
Piped (tap) water inside dwelling / yard 26 385 41 424 83 978<br />
Piped (tap) water on a communal stand 15 304 31 067 25 420<br />
No access to piped (tap) water 60 776 68 702 48 350<br />
Source: Census 2011 Municipal Report<br />
Date: May 2013<br />
Page 82 of 194
ZULULAND IDP REVIEW 2013/2014<br />
90 000<br />
80 000<br />
70 000<br />
60 000<br />
50 000<br />
40 000<br />
30 000<br />
20 000<br />
10 000<br />
0<br />
Piped (tap) water<br />
inside dwelling /<br />
yard<br />
Access to piped water<br />
Piped (tap) water<br />
on a communal<br />
stand<br />
No access to piped<br />
(tap) water<br />
1996<br />
2001<br />
2011<br />
There has been a dramatic<br />
increase between 1996 and<br />
2001 and again between<br />
2001 and 2011 in the<br />
number of households who<br />
have access to piped water<br />
within the dwelling or yard.<br />
Between 1996 and 2001,<br />
the increase was 15,039<br />
households and between<br />
2001 and 2011, the<br />
increase was 42,554<br />
households.<br />
Figure 15 Access to Piped Water - 1996, 2001, 2011<br />
The table below sets out community access to piped water, as derived from the Census 2011 data:<br />
Table 29 Access to Piped Water (2011)<br />
Access to Piped Water (2011)<br />
No of Households<br />
Piped (tap) water inside dwelling/institution 35,165 22.29<br />
Piped (tap) water inside yard 48,813 30.94<br />
Piped (tap) water on community stand: less than 200m from dwelling 14,425<br />
Piped (tap) water on community stand: between 200m and 500m from<br />
dwelling<br />
Piped (tap) water on community stand: between 500m and 1000m<br />
from dwelling<br />
Piped (tap) water on community stand: more than 1000m from<br />
dwelling<br />
5,704<br />
3,352<br />
1,939<br />
No access to piped (tap) water 48,350 30.65<br />
Total 157,748 100.00<br />
Source: Census 2011<br />
% of<br />
Households<br />
It is clear from the above table that ZDM has made significant in-roads into addressing the water backlogs within the<br />
Municipal Area. Some 62.37% of all households within the <strong>District</strong> have access to piped water within 200m from their<br />
respective dwellings (the minimum RDP standard level of service). It is however noted that some 30% of households<br />
did indicate, in 2011, that it had no access to piped water.<br />
9.14<br />
3.62<br />
2.12<br />
1.23<br />
Date: May 2013<br />
Page 83 of 194
ZULULAND IDP REVIEW 2013/2014<br />
Map 19: % of Households with No Access to Piped Water (2011)<br />
It is particulalrly the central-eastern parts of the Municipal Area where more thyan 60.1% of households indicated, in<br />
2011, that they did not have access to piped water. The affected areas are: the northern and eastern parts of<br />
Nongoma LM; the north-eastern parts of Ulundi LM, the eastern parts of Abaqulusi LM; and the southern parts of<br />
uPhongolo LM.<br />
Table 30: Source of water 2011<br />
Source of water No. of<br />
Households<br />
Regional / local water<br />
scheme (operated by<br />
municipality or other water<br />
service provider<br />
% of<br />
Households<br />
73,744 46.75<br />
Borehole 17,734 11.24<br />
Spring 5,364 3.40<br />
Rain water tank 2,132 1.35<br />
Dam/pool/stagnant water 9,874 6.26<br />
River/stream 34,462 21.85<br />
Water vendor 2,340 1.48<br />
Date: May 2013<br />
Page 84 of 194
ZULULAND IDP REVIEW 2013/2014<br />
Source of water No. of<br />
Households<br />
% of<br />
Households<br />
Water tanker 7,467 4.73<br />
Other 4,630 2.94<br />
Total 157,747 100.00<br />
Source: Census 2011<br />
It is noted that in 2011, some 47% of all<br />
households within the Municipal Area water<br />
source was from regional of local water schemes.<br />
However, there are still some 22% of households<br />
(or 34,462 households) that indicated in 2011<br />
that their main source of water was from rivers or<br />
streams.<br />
4.1.3 WATER SCHEMES<br />
There are 10 regional water schemes that have been developed to roll-out water supply to the whole district. The<br />
schemes are listed hereunder and shown in the following image:<br />
o<br />
Coronation<br />
o<br />
Simdlangentsha East<br />
o<br />
Hlahlindlela<br />
o<br />
Simdlangentsha Central<br />
o<br />
Khambi<br />
o<br />
Simdlangentsha West<br />
o<br />
Mandlakazi<br />
o<br />
Usuthu<br />
o<br />
Nkonjeni<br />
o<br />
Candover<br />
Each regional scheme footprint as a sustainable water source from where infrastructure is progressively being rolled<br />
out to all households within the supply area. The supply footprints have been identified such that water can be<br />
provided to all households within the area in a sustainable manner and at the lowest possible cost (R/kl).<br />
A Map depicting the roll-out of Regional Water Schemes is depicted overleaf:<br />
Date: May 2013<br />
Page 85 of 194
ZULULAND IDP REVIEW 2013/2014<br />
Map 20: Regional Schemes Rollout 2013 - 2017<br />
Date: May 2013<br />
Page 86 of 194
ZULULAND IDP REVIEW 2013/2014<br />
4.1.4 CAPITAL REQUIREMENTS FOR, AND INCOME OF, WATER<br />
Table 31: Capital Requirements for Water from 2013/14 to 2017/2018<br />
WATER<br />
Capital<br />
requirements<br />
2013/14 2014/15 2015/2016 2016/2017 2017/2018<br />
Regional bulk Pipes R 1 136 675 096 R 81 618 822 R 11 584 808 R 76 405 893 R 127 159 412 R 839 906 161<br />
Regional bulk Components R 763 556 689 R 138 002 602 R 97 645 428 R 45 699 845 R 44 267 521 R 437 941 293<br />
Secondary bulk R 1 315 814 251 R 95 981 010 R 57 291 804 R 44 491 516 R 26 385 475 R 1 091 664 446<br />
Reticulation Connections R 137 022 280 R 6 666 220 R 8 939 760 R 8 484 820 R 10 699 920 R 102 231 560<br />
Total capital: water R 3 353 068 316 R 322 268 654 R 175 461 800 R 175 082 074 R 208 512 328 R 2 471 743 460<br />
Source: WSDP 2013<br />
Table 32: Sources of Capital Income: Water<br />
WATER Expected Funding 2013/14 2014/15 2015/2016 2016/2017 2017/2018<br />
MIG R 883 622 400 R 220 905 600 R 220 905 600 R 220 905 600 R 220 905 600 R 220 905 600<br />
DWA (RBIG) R 110 341 000 R 55 341 000 R 55 000 000 Unknown Unknown Unknown<br />
Housing R - R - R - R - R - R<br />
-<br />
Other grant funding (MWIG) R 156 000 000 R 37 000 000 R 39 000 000 R 80 000 000 R - R<br />
-<br />
Loans R - R - R - R - R - R<br />
-<br />
TOTAL R 1 149 963 400 R 313 246 600 R 314 905 600 R 300 905 600 R 220 905 600 R 220 905 600<br />
Capital requirements R 2 935 500 657<br />
Shortfall R -1 785 537 257<br />
Source: WSDP 2013<br />
The <strong>Zululand</strong> <strong>District</strong> <strong>Municipality</strong> has established a Water Services Development Planning Steering Committee in<br />
which both the Municipal Manager and the Director: Technical Services of each of the local municipalities within its<br />
area of jurisdiction have been requested to participate. The meetings of this Steering Committee are held quarterly<br />
where information regarding current and future water services projects is provided and the local municipalities are<br />
afforded the opportunity to interact with the water services provider on behalf of the affected communities within<br />
their respective service areas.<br />
4.1.5 SANITATION BACKLOG<br />
Table 33: Sanitation Backlogs (WSDP 2013)<br />
VIP Septic tank Waterborne<br />
None or Inadequate RDP RDP >RDP<br />
TOTALS<br />
AbaQulusi LM 0 0 0 15 283 15 283<br />
eDumbe LM 0 0 498 4 659 5 157<br />
Nongoma LM 0 0 0 1239 1 239<br />
Ulundi LM 0 0 0 5 520 5 520<br />
uPhongolo LM 0 0 0 3 557 3 557<br />
Total (urban) - - 498 30 258 30 756<br />
AbaQulusi LM 14 440 10 312 267 0 25 019<br />
eDumbe LM 607 10 917 199 0 11 723<br />
Nongoma LM 16 242 20 690 0 0 36 932<br />
Ulundi LM 14 548 17 255 42 0 31 845<br />
uPhongolo LM 10 920 10 301 358 0 21 579<br />
Total (rural) 56 757 69 475 866 0 127 098<br />
Total (households) 56 757 69 475 1 364 30 258 157 854<br />
Date: May 2013<br />
Page 87 of 194
ZULULAND IDP REVIEW 2013/2014<br />
Source: WSDP 2013<br />
The table below sets out a comparison of community’s access to sanitation facilities in 1996, 2001 and 2011 (as<br />
derived from StatsSA):<br />
Table 34: Community Access to Sanitation Facilities (StatsSA)<br />
Sanitation Facilities<br />
Year<br />
1996 2001 2011<br />
Flush or chemical toilet 18 297 34 984 50 405<br />
Pit latrine 48 412 50 488 68 287<br />
Bucket latrine 1 523 1 002 1 572<br />
None 35 023 54 718 31 272<br />
Source: Census 2011 Municipal Report<br />
80 000<br />
60 000<br />
Type of Sanitation<br />
There has been a dramatic<br />
increase between 1996 and<br />
2001 and again between 2001<br />
and 2011 in the number of<br />
households who had access to<br />
flush or chemical toilets or pit<br />
latrines. However, there were<br />
still some 31,272 households<br />
who indicated that it had no<br />
access to toilet facilities. This<br />
constituted some 19.8% of the<br />
total number of households<br />
within the <strong>District</strong> in 2011.<br />
40 000<br />
1996<br />
20 000<br />
2001<br />
0<br />
Flush or<br />
chemical<br />
toilet<br />
Pit latrine<br />
Bucket<br />
latrine<br />
None<br />
2011<br />
Figure 16: Community Access to Sanitation Facilities<br />
The table below sets out community access to sanitation facilities, as derived from the Census 2011 data:<br />
Table 35: Community Access to Sanitation Facilities (2011)<br />
Toilet facilities<br />
Total<br />
None 31 272<br />
Flush toilet (connected to sewerage system) 30 137<br />
Flush toilet (with septic tank) 6 203<br />
Chemical toilet 14 066<br />
Pit toilet with ventilation (VIP) 32 165<br />
Pit toilet without ventilation 36 122<br />
Bucket toilet 1 572<br />
Other 6 213<br />
Date: May 2013<br />
Page 88 of 194
ZULULAND IDP REVIEW 2013/2014<br />
Map 21: % of Households with No Access to Toilets (2011)<br />
It is particularly the central and eastern parts of the Municipal Area where more than 40.1% of households indicated,<br />
in 2011, that it had no access to toilet facilities. These areas are marked in dark orange and brown on the above map.<br />
Date: May 2013<br />
Page 89 of 194
ZULULAND IDP REVIEW 2013/2014<br />
4.1.6 SANITATION PROVISION<br />
Map 22: Rural Sanitation Rollout 2013 - 2017<br />
Date: May 2013<br />
Page 90 of 194
ZULULAND IDP REVIEW 2013/2014<br />
Map 23: Rudimentary Rollout 2013 – 2017<br />
Date: May 2013<br />
Page 91 of 194
ZULULAND IDP REVIEW 2013/2014<br />
4.1.7 CAPITAL REQUIREMENTS FOR, AND INCOME OF, SANITATION<br />
Table 36: Capital Requirements for Sanitation from 2013/14 to 2017/18<br />
SANITATION<br />
Capital<br />
requirements<br />
2013/14 2014/15 2015/2016 2016/2017 2017/2018<br />
Bulk infrastructure R - R - R - R - R - R<br />
-<br />
Reticulation R - R - R - R - R - R<br />
-<br />
VIP toilets R 383 771 900 69 232 500 79 150 750 79 150 750 79 150 750 77 087 150<br />
Total capital (new) R 383 771 900 R 69 232 500 R 79 150 750 R 79 150 750 R 79 150 750 R 77 087 150<br />
Bulk infrastructure TBA TBA TBA TBA TBA TBA<br />
Reticulation TBA TBA TBA TBA TBA TBA<br />
VIP toilets TBA TBA TBA TBA TBA TBA<br />
Total capital (refurbishment) TBA TBA TBA TBA TBA TBA<br />
Total capital R 383 771 900 R 69 232 500 R 79 150 750 R 79 150 750 R 79 150 750 R 77 087 150<br />
Source: WSDP 2013<br />
Table 37: Sources of Capital Income: Sanitation<br />
SANITATION Expected Funding 2013/14 2014/15 2015/2016 2016/2017 2017/2018<br />
MIG R 220 905 600 R 55 226 400 R 55 226 400 R 55 226 400 R 55 226 400 R 55 226 400<br />
DWA R - R - R - R - R - R<br />
-<br />
Housing R - R - R - R - R - R<br />
-<br />
Other grant funding R - R - R - R - R - R<br />
-<br />
Loans R - R - R - R - R - R<br />
-<br />
TOTAL R 220 905 600 R 55 226 400 R 55 226 400 R 55 226 400 R 55 226 400 R 55 226 400<br />
Capital requirements R 383 771 900<br />
Shortfall R -162 866 300<br />
Source: WSDP 2013<br />
4.2 SOLID WASTE MANAGEMENT<br />
The table below reflects a comparison of the 1996, 2001 and 2011 Census data in respect of solid waste disposal:<br />
Table 38: Solid Waste Disposal – 1996, 2001 and 2011<br />
Solid Waste Disposal<br />
Year<br />
1996 2001 2011<br />
Removed by local 20 431 30 224 37 755<br />
authority/private company<br />
Communal/Own refuse dump 54 610 81 975 99 275<br />
No rubbish disposal 26 969 28 993 17 815<br />
Date: May 2013<br />
Page 92 of 194
ZULULAND IDP REVIEW 2013/2014<br />
120 000<br />
100 000<br />
80 000<br />
60 000<br />
40 000<br />
20 000<br />
0<br />
Solid Waste Disposal<br />
Removed by local<br />
authority /<br />
private company<br />
Communal/Own<br />
refuse dump<br />
No rubbish<br />
disposal<br />
1996<br />
2001<br />
2011<br />
There has been a steady and<br />
significant increase between 1996<br />
and 2001 and between 2001 and<br />
2011 in the number of households<br />
who have received solid waste<br />
removal services from a local<br />
authority or private company.<br />
Over the same time periods, there<br />
has also been a significant increase<br />
in communal or own refuse<br />
dumps. This is of great concern.<br />
The increase in this trend between<br />
1996 and 2011 was some 82%.<br />
Figure 17: Solid Waste Disposal – 1996, 2001 and 2011<br />
Table 39: ZDM Refuse Disposal 2011<br />
Refuse disposal<br />
Number<br />
Removed by local authority/private company at least once a week 35 274<br />
Removed by local authority/private company less often 2 481<br />
Communal refuse dump 2 015<br />
Own refuse dump 97 260<br />
No rubbish disposal 17 815<br />
Other 2 903<br />
Source: SuperCross Census 2011<br />
The <strong>District</strong> has commissioned and completed the preparation of a Waste Management Strategy.<br />
New facilities were proposed and the following issues addressed:<br />
<br />
<br />
<br />
<br />
<br />
<br />
<br />
<br />
<br />
<br />
Positioning of facilities<br />
Sizing of facilities (numbers and land requirement)<br />
Timing and priorities<br />
Tariffs<br />
Management: Local Municipalities or <strong>District</strong> <strong>Municipality</strong><br />
Legal Responsibilities (Environmental and Water Acts)<br />
Rural - Cultural Practices<br />
Groundwater Pollution control<br />
Health Aspects<br />
Cost estimates were done on the CAPEX for infrastructure as well as the operational and maintenance cost of<br />
facilities.<br />
Recommendations were made on the following:<br />
<br />
<br />
<br />
Procedures to be followed for the development of new Waste Disposal<br />
Site facilities and how to maintain the service at a satisfactory level at all times in line with the Minimum<br />
Requirements of DWAF (1998).<br />
Additional services required, e.g. geotechnical investigation, environmental impact assessment, etc.<br />
Date: May 2013<br />
Page 93 of 194
ZULULAND IDP REVIEW 2013/2014<br />
<br />
<br />
Cost recovery.<br />
Operational Control - local or district. Both alternatives to be evaluated and discussed.<br />
4.3 CEMETERIES<br />
Burial arrangements are closely bound with cultural and religious traditions. In most cases burial sites are needed in<br />
relatively close proximity to settlements. Accordingly to the <strong>Zululand</strong> Cemeteries Master Plan, approximately 700 ha<br />
of land will be required in the <strong>Zululand</strong> <strong>District</strong> <strong>Municipality</strong> by the year 2020 to accommodate approximately 800 000<br />
cumulative deaths at that time. The table below shows the breakdown of the land requirements per <strong>Municipality</strong> for<br />
cemetery requirements:<br />
Table 40: Estimated Cemetery Land Requirements (2020)<br />
<strong>Municipality</strong><br />
Projected Population<br />
Cumulative<br />
Deaths up to 2020<br />
Recommended<br />
Land Required<br />
(ha)<br />
EDumbe<br />
(KZ UPongolo 261)<br />
Abaqulusi (KZ 262)<br />
Nongoma (KZ 263)<br />
(KZ Ulundi 265)<br />
67 583 52 723 46<br />
113 149 88 274 78<br />
230 191 179 558 156<br />
253 114 197 479 171<br />
366 677 286 044 249<br />
(KZ ZDM 266)<br />
1 030 714 804 078 700<br />
Source: Cemetery Master Plan<br />
The <strong>District</strong>s Cemetery Plan (2003) provides the following information:<br />
<br />
<br />
<br />
<br />
<br />
<br />
In the urban centres, cemeteries are provided by the Municipalities, who provide gravesites at specified<br />
tariffs and keep records of burials.<br />
Cemeteries are provided and maintained by some religious congregations like the Anglican Church, Catholic<br />
Church and Lutheran Church.<br />
Where land is set aside for cemeteries on tribal land, the cost of burial sites are included in the general fees<br />
payable to the tribal authority.<br />
In selected rural areas with a low population density, burials are allowed near family homesteads.<br />
On some commercial farms, burial sites are provided for staff, but these provisions are now resisted by<br />
farmers as a result of the promulgation of the Extension of Security of Tenure Act.<br />
Because of the low demand for cremations, there are at present no crematoria in the <strong>Zululand</strong> <strong>District</strong>. The<br />
nearest crematoria are situated in Newcastle and Eshowe.<br />
4.4 TRANSPORTATION INFRASTRUCTURE<br />
Transport infrastructure includes road, rail, and air. Transport infrastructure in the <strong>District</strong> has an urban bias, such<br />
that the urban areas are accessible whilst the rural areas face problems of inaccessibility and poor infrastructure<br />
maintenance. With respect to transport infrastructure, the following district responsibilities have to be noted:<br />
Date: May 2013<br />
Page 94 of 194
ZULULAND IDP REVIEW 2013/2014<br />
<br />
<br />
Public transport infrastructure provision; and<br />
Public transport planning<br />
4.4.1 ROADS AND STORM WATER<br />
4.4.1.1 ROAD INFRASTRUCTURE<br />
Road infrastructure is under pressure particularly from heavy vehicles. The responsibility between Local and <strong>District</strong><br />
municipalities as well as the Department of Transport (DOT) for road provision and maintenance still needs to be<br />
finalized and has been flagged as a key development issue.<br />
There are a number of roads in order of priority that are of strategic importance to the <strong>Municipality</strong>, and that should<br />
receive priority as far as the <strong>Municipality</strong> is concerned.<br />
1. Nongoma uPhongola link road: A section of this road between Nongoma and uPhongola (about 35km) need<br />
to be upgraded to blacktop.<br />
2. Nongoma Vryheid link road: There is a portion of road between Nongoma and Vryheid, from Nongoma to<br />
Vryheid that need to be upgraded to blacktop standard.<br />
3. Ceza R66 road: A section of the road need to be upgraded to blacktop.<br />
The National Roads Agency together with the Department of Transport provides funding for roads infrastructure<br />
development. This funding is however not channeled through the <strong>Municipality</strong>, but is directly channeled down from<br />
Provincial level to implementation in the different Municipalities. The priorities from Municipalities as identified in<br />
the IDP are however taken into account in the funding process.<br />
In addition to the strategic roads listed above (that are also reflected in some way in the SDF) the ZDM has drafted a<br />
Public Transport Plan (PTP). The PTP has as its primary objective to provide an appraisal of the public transport<br />
system (based on the results of the CPTR) that should assist decision makers in their efforts to improve the public<br />
transport system.<br />
The following 2 maps have been derived from the PTP that depict:<br />
<br />
<br />
Vehicle Trips<br />
Vehicle Volumes<br />
The backlog determination methodology referred at the start of this section has been applied to determine backlogs<br />
to roads and outlined in the table hereunder and also mapped at overleaf:<br />
Table 41: Road Access Backlog Determination<br />
< 1km<br />
Local <strong>Municipality</strong> Households Population Percentage<br />
Abaqulusi <strong>Municipality</strong> 30645 207252 95%<br />
eDumbe <strong>Municipality</strong> 12124 81995 89%<br />
Nongoma <strong>Municipality</strong> 30726 207800 99%<br />
Ulundi <strong>Municipality</strong> 28166 190487 94%<br />
uPhongolo <strong>Municipality</strong> 20056 135639 95%<br />
Date: May 2013<br />
Page 95 of 194
ZULULAND IDP REVIEW 2013/2014<br />
1km - 2.5km<br />
Local <strong>Municipality</strong> Households Population Percentage<br />
Abaqulusi <strong>Municipality</strong> 173 1170 1%<br />
eDumbe <strong>Municipality</strong> 1121 7581 8%<br />
Nongoma <strong>Municipality</strong> 114 771 0%<br />
Ulundi <strong>Municipality</strong> 379 2563 1%<br />
uPhongolo <strong>Municipality</strong> 541 3659 3%<br />
>2.5km<br />
Local <strong>Municipality</strong> Households Population Percentage<br />
Abaqulusi <strong>Municipality</strong> 1484 10036 5%<br />
eDumbe <strong>Municipality</strong> 333 2252 2%<br />
Nongoma <strong>Municipality</strong> 174 1177 1%<br />
Ulundi <strong>Municipality</strong> 1392 9414 5%<br />
uPhongolo <strong>Municipality</strong> 412 2786 2%<br />
Date: May 2013<br />
Page 96 of 194
ZULULAND IDP REVIEW 2013/2014<br />
Map 24: Transportation Vehicle Trips<br />
Date: May 2013<br />
Page 97 of 194
ZULULAND IDP REVIEW 2013/2014<br />
Map 25: Transportation Vehicle Volumes<br />
Date: May 2013<br />
Page 98 of 194
ZULULAND IDP REVIEW 2013/2014<br />
Map 26: Access to Roads<br />
Date: May 2013<br />
Page 99 of 194
ZULULAND IDP REVIEW 2013/2014<br />
4.4.1.2 ZULULAND DISTRICT RURAL ROADS ASSET MANAGEMENT SYSTEM<br />
The strategic goal of the development of a Rural Roads Asset Management System (RRAMS) for the <strong>Zululand</strong> <strong>District</strong><br />
Municipal area is to ensure efficient and effective investment in rural roads through the development of Road Asset<br />
Management Systems (RRAMS) and the collection of associated road and bridge inventory data condition assessments<br />
and traffic information. Improved data on rural roads will guide infrastructure investment, improve accessibility to and<br />
mobility of rural communities.<br />
The <strong>Zululand</strong> <strong>District</strong> comprises of five (5) local municipalities, as indicated in the table below. Road centreline data<br />
captured using GIS technology is available but this data has not been verified in the field. The length of municipal<br />
roads classified using the RISFSA classification system is approximately 2970km.<br />
Local<br />
<strong>Municipality</strong><br />
Class 1 Class 2 Class 3 Class 4 Class 5 Class 6 Class 7<br />
Uphongola 109.83 0 0 29.64 368.11 749.28 5962.41<br />
Ulundi 0 0 0 35.75 738.69 2130.19 2186.69<br />
Abaqulusi 0 0 0 29.58 755.11 686.54 6919.17<br />
Nongoma 0 0 0.26 19.05 647.83 2986.99 18.10<br />
eDumbe 0 0 0 15.81 220.44 378.78 3783.09<br />
Total 109.83 0 0.26 129.83 2730.18 6931.78 18869.46<br />
CLASS STRATEGIC FUNCTION Length<br />
1 Primary Distributor High mobility, limited access, national importance. 109.83<br />
2 Regional Distributor Relatively high mobility, lower levels of access, regional<br />
0<br />
importance.<br />
3 <strong>District</strong> Distributor Moderate mobility, higher levels of access, local importance. 0.26<br />
4 <strong>District</strong> Collector Low mobility, high levels of access, medium local importance. 129.83<br />
5 Access Roads Very low mobility, high level of access, low local importance. 2730.18<br />
6 Non-motorised Access Roads Public rights of way for non-motorised transport. 6931.78<br />
7 Special purpose public roads Special purpose public roads which cannot be assigned to any<br />
other class such as recreational, forestry, mining, national parks<br />
or dam access<br />
18869.46<br />
The development of a Rural Roads Asset Management System incorporates a Pavement Management System (PMS)<br />
which forms the basis for any further road asset and maintenance functions. A PMS is a clearly defined set of<br />
procedures for collecting relevant pavement condition data, the analysis thereof to identify, quantify and prioritise<br />
needs.<br />
Commencement Date : Aug 2012<br />
Scheduled Completion : Aug 2015<br />
Alignment Structures : RRAMS Project Steering Committee comprising of the <strong>Zululand</strong> Municipalities, National<br />
and Provincial Transport meets to align and ensure contribution of critical stakeholders in<br />
the process.<br />
The following transport related issues should be noted:<br />
Date: May 2013<br />
Page 100 of 194
ZULULAND IDP REVIEW 2013/2014<br />
<br />
<br />
o<br />
o<br />
o<br />
o<br />
o<br />
<br />
<br />
<strong>Zululand</strong> <strong>District</strong> <strong>Municipality</strong> will be required to plan a co-ordination role in the provision and maintenance<br />
of roads within the <strong>District</strong>. The responsibility of roads (excluding Municipal roads) within the district<br />
remains the responsibility of the Department of Transport. The planning responsibility is with the district.<br />
An identification of the road network within the district and their classification has been undertaken based<br />
on the <strong>District</strong>s GIS information. The classification includes:<br />
National and Provincial Roads<br />
<strong>District</strong> Roads<br />
Municipal Roads<br />
Roads in the Ingonyama Trust area<br />
Roads on State land<br />
Rural Access roads have the most important impact for future development of the district. It is thus essential<br />
that the <strong>District</strong> be given opportunity to provide input into the Department of Transport planning for the<br />
<strong>District</strong>.<br />
The Provincial department utilizes the Rural Road Transportation Forums (RRTF) and Community Road Safety<br />
Committee (CRSC) to determine the road priorities.<br />
4.4.1.3 RAIL INFRASTRUCTURE<br />
The most important rail link is the coal line from Mpumalanga Province through Vryheid to Richards Bay Coal Terminal<br />
from where the product is exported. However, railway traffic is generally on the decline, as is the case throughout the<br />
province and rest of South Africa.<br />
“The Coal Line, which started operations in 1976, links 44 coal mines in Mpumalanga to the bulk export port of<br />
Richards Bay. The line runs from Witbank through Piet Retief, Paulpietersburg, Vryheid East, Ulundi to Richards Bay.<br />
Although initially designed to convey 21 million tons of coal exports per annum the route was upgraded in 1989 and in<br />
1997 it conveyed 62 million tons of coal to Richards Bay (Robinson 1999). This was expected to increase to 70 million<br />
tons by the year 2000. Importantly, the Coal Line Study notes that the 200 truck dedicated coal trains (of which there<br />
are 23 per day) “do not stop at stations within the corridor except to changes crews. All these trains return empty”.<br />
Further to this it was found that there is approximately 17 general freight trains on the line, transporting 30 000 tons<br />
of goods to Richards Bay, including fero-chrome, granite, chrome, steel and timber. Although most of the freight is<br />
loaded north of <strong>Zululand</strong> substantial amounts of timber is loaded in the eDumbe and Vryheid areas. The trains are<br />
reported to return with approximately 10 000 tons of goods (Robinson 1999).” 3<br />
4.4.1.4 AIR TRANSPORT INFRASTRUCTURE<br />
According to the <strong>Zululand</strong> Business Sector Plan (May 2006: pg 19), the <strong>District</strong> has two airports of note, viz. the Ulundi<br />
Airport and the Vryheid Airport.<br />
The KZN Provincial Government resolved to transfer the management and ownership of the Ulundi Airport to the<br />
<strong>Zululand</strong> <strong>District</strong> <strong>Municipality</strong> and representative Joint Task Team was established to (1) facilitate the process and (2)<br />
to develop a strategy to ensure the future sustainable operation of the facility.<br />
<br />
The main objective is to make the airport a catalyst and key driver of the <strong>District</strong>’s IDP and LED programmes.<br />
A Strategy document outlining strategies and objectives that need to be implemented to ensure viability of<br />
3 ZDM Business Sector Plan, May 2006: pg 19<br />
Date: May 2013<br />
Page 101 of 194
ZULULAND IDP REVIEW 2013/2014<br />
<br />
the airport was produced and it is the yardstick according to which progress and achievements made are<br />
measured.<br />
Airport operations are governed by the Civil Aviation Regulations of 1997 as amended from time to time. An<br />
Aerodrome Emergency Management System has been developed as per Regulation 139.02.6 and approved<br />
by the South African Civil Aviation Authority (SACAA) as the legislating body monitoring operations of airports<br />
in South Africa. A Full-scale Emergency Exercise has also been performed successfully thereby convincing the<br />
SACAA Inspector that the airport is capable of responding to an emergency of that specific magnitude.<br />
The following progress on Implementation of the Airport Strategic Objectives:<br />
Airport Management<br />
<br />
<br />
<br />
<br />
An organizational chart has been drawn as the proposed Management structure which is yet to be approved<br />
by the council. The most critical post that is mandated by the SACAA regulations have been filled in<br />
compliance with ICAO Doc 9137-AN/898 PART 1 on Rescue and Fire Fighting i.e. the Chief Fire Officer.<br />
An operation Manual has been developed though still under SACAA scrutiny but staff members have started<br />
operationalising this document.<br />
Most staff members have attended a radio communication course i.e. PARTEK and two has already passed<br />
with others still having to do their practical examination. A Dangerous Goods Course has also been presented<br />
to most airport staff members.<br />
A Full scale Aerodrome Emergency Exercise has been performed successfully with all stake holders. The<br />
SACAA Inspector was impressed by the enthusiasm shown by participants who diligently illustrated different<br />
scenarios and thoroughness of Nkonjeni Hospital and EMRS as he found that the patient treatment was<br />
realistically simulated, to the point where patient cards were opened; treatments recorded and even some<br />
patients with X-Ray request forms, in wheelchairs.<br />
Building and Maintenance<br />
<br />
<br />
<br />
<br />
<br />
<br />
The airport has deteriorated tremendously i.e. the infrastructure and buildings received minimal attention.<br />
Navigation equipment has been repaired while the DME and one NDB (SMH) that have been identified as<br />
obsolete are in the process of being replaced.<br />
Electrical and drainage systems are receiving minimal attention on ad hock bases also due to financial<br />
constrain, with the drainage system posing constant problems denoting a need for major overhaul.<br />
Local and Regional Tourism Development and Marketing<br />
Top management of an airline that is readily available to provide scheduled flights, has visited the <strong>District</strong>’s<br />
airport and surrounding Tourists Attraction Venues with an aim of confirming viability of scheduled flights<br />
and a proposal is expected.<br />
A company specializing in the provision of flight schools has visited the airport with an aim of gathering<br />
information towards developing a proposal for presentation to the <strong>Zululand</strong> <strong>District</strong> <strong>Municipality</strong>.<br />
A marketing video has been prepared and shown to the senior management team of one of the prospective<br />
carriers who were hosted by the <strong>Zululand</strong> <strong>District</strong> <strong>Municipality</strong> at Umfolozi/ Hluhluwe Game Reserve.<br />
The Vryheid airport is no longer licensed as scheduled flights to Vryheid were discontinued in the mid-1980s partly<br />
because of a change in the operating company and partly because of the closure of major coal mines in the Vryheid<br />
area. The municipal parks department maintains the airport.<br />
Date: May 2013<br />
Page 102 of 194
ZULULAND IDP REVIEW 2013/2014<br />
4.5 ELECTRICITY / ENERGY<br />
In the <strong>Zululand</strong> <strong>District</strong> <strong>Municipality</strong> electricity is provided by way of connections to the Eskom grid or by way of nongrid<br />
electricity. It is important to note that the electricity network in the southern portions of <strong>Zululand</strong> has very<br />
limited capacity and, as such, no new projects are being commissioned in this part of the <strong>District</strong>. In the northern<br />
portions of the district, notably Edumbe, Ulundi and Abaqulusi, a few projects are proposed.<br />
The calculated backlog for the provision of electricity, in terms of planned grid and non-grid supply is as follow:<br />
<br />
<br />
<br />
55 237 still to be connected to grid supply – this equates to approximately 39% of the total households<br />
13 175 still to be connected to non-grid supply – this equates to approximately 9% of the total households<br />
More details on the electricity network and accessibility to it as shown in the following table and the maps at<br />
overleaf:<br />
Table 42: Status of Electrification<br />
Electrified<br />
Local <strong>Municipality</strong> Households Population Percentage<br />
eDumbe <strong>Municipality</strong> 8596 58135 57%<br />
uPhongolo <strong>Municipality</strong> 5306 35884 24%<br />
Nongoma <strong>Municipality</strong> 25102 169765 70%<br />
Abaqulusi <strong>Municipality</strong> 15308 103528 45%<br />
Ulundi <strong>Municipality</strong> 19817 134022 56%<br />
BACKLOG<br />
Planned Grid Supply<br />
Local <strong>Municipality</strong> Households Population Percentage<br />
eDumbe <strong>Municipality</strong> 4492 30379 30%<br />
uPhongolo <strong>Municipality</strong> 14127 95541 64%<br />
Nongoma <strong>Municipality</strong> 6803 46009 19%<br />
Abaqulusi <strong>Municipality</strong> 16366 110683 47%<br />
Ulundi <strong>Municipality</strong> 13449 90956 38%<br />
Off Grid Supply<br />
Local <strong>Municipality</strong> Households Population Percentage<br />
eDumbe <strong>Municipality</strong> 1930 13053 13%<br />
uPhongolo <strong>Municipality</strong> 2680 18125 12%<br />
Nongoma <strong>Municipality</strong> 4131 27938 11%<br />
Abaqulusi <strong>Municipality</strong> 2378 16082 7%<br />
Ulundi <strong>Municipality</strong> 2056 13905 6%<br />
Date: May 2013<br />
Page 103 of 194
ZULULAND IDP REVIEW 2013/2014<br />
Map 27: Electricity Network<br />
Date: May 2013<br />
Page 104 of 194
ZULULAND IDP REVIEW 2013/2014<br />
Map 28: Access to Electricity<br />
Date: May 2013<br />
Page 105 of 194
ZULULAND IDP REVIEW 2013/2014<br />
The following table reflects a comparison of electricity usage for lighting, cooking and heating for the 1996, 2001 and<br />
2011 Census years:<br />
Table 43: Electricity Usage – 1996, 2001 and 2011<br />
Electricity Usage<br />
Year<br />
1996 2001 2011<br />
Lighting 28 594 54 894 110 055<br />
Heating 17 430 31 851 63 867<br />
150 000<br />
Electricity Usage<br />
Cooking 19 035 33 891 86 326<br />
100 000<br />
1996<br />
There has been more than a significant<br />
increase in the usage of electricity for lighting,<br />
heating and cooking purposes from 1996 to<br />
2001, as well as from 2001 to 2011.<br />
50 000<br />
0<br />
Lighting Heating Cooking<br />
2001<br />
2011<br />
Figure 18: Electricity usage<br />
Table 44: Energy Source for Lighting (2011)<br />
Energy<br />
lighting<br />
for<br />
No.<br />
Households<br />
None 914 0.58<br />
Electricity 110,055 69.77<br />
Gas 636 0.40<br />
Paraffin 795 0.50<br />
Candles 44,677 28.32<br />
Solar 669 0.42<br />
Total 157,746 100.00<br />
of<br />
% of<br />
Households<br />
It is noted that some 70% of all households<br />
indicated in 2011 that they use electricity for<br />
lighting purposes. However, there are still some<br />
28% of households that were dependent on candles<br />
for lighting purposes in 2011.<br />
Energy Source for Lighting 2011<br />
Figure 19: Energy Source for Lighting<br />
Table 45: Energy Source for Cooking<br />
Energy for Cooking No. of Households % of Households<br />
Electricity 86,326 54.72<br />
Gas 7,193 4.56<br />
Paraffin 6,508 4.13<br />
Wood 53,873 34.15<br />
Coal 2,160 1.37<br />
Animal dung 659 0.42<br />
Solar 288 0.18<br />
Other 290 0.18<br />
None 451 0.29<br />
Total 157,748 100.00<br />
Date: May 2013<br />
Page 106 of 194
ZULULAND IDP REVIEW 2013/2014<br />
100 000<br />
80 000<br />
60 000<br />
40 000<br />
20 000<br />
0<br />
Energy Source for Cooking<br />
(2011)<br />
It is encouraging to note that<br />
some 55% of all households<br />
indicated in 2011 that they use<br />
electricity for cooking purposes.<br />
However, there are still some<br />
34% of households that were<br />
dependent on wood for cooking<br />
purposes in 2011.<br />
Figure 20: Energy Source for Cooking<br />
Table 46: Energy Source for Heating<br />
Energy for No. of<br />
Heating Households % of Households<br />
Electricity 63,867 40.49<br />
Gas 3,236 2.05<br />
Paraffin 2,998 1.90<br />
Wood 63,595 40.31<br />
Coal 3,137 1.99<br />
Animal dung 1,136 0.72<br />
Solar 306 0.19<br />
Other 109 0.07<br />
None 19,364 12.28<br />
Total 157,748 100.00<br />
70 000<br />
60 000<br />
50 000<br />
40 000<br />
30 000<br />
20 000<br />
10 000<br />
0<br />
Energy Source for Heating (2011)<br />
It is noted that some 40% of all households indicated<br />
in 2011 that they use electricity for heating<br />
purposes. However, there are still some 40% of<br />
households that were dependent on wood for<br />
cooking purposes in 2011.<br />
Figure 21: Energy Source for Heating<br />
4.6 ACCESS TO COMMUNITY FACILITIES<br />
During 2004, the ZDM commissioned the preparation of an Education, Health and Community Service Sector Plan and<br />
the plan has since been reviewed. As part of this Review phase, an updated backlog determination was undertaken.<br />
Access to community halls/centres is discussed in more detail in this section.<br />
Date: May 2013<br />
Page 107 of 194
ZULULAND IDP REVIEW 2013/2014<br />
4.6.1 COMMUNITY HALLS<br />
Details on the number of community halls/centres in the ZDM area as noted hereunder:<br />
Table 47: Community Halls / Centres in the <strong>District</strong><br />
Local <strong>Municipality</strong> Required Existing<br />
Abaqulusi <strong>Municipality</strong> 17 8<br />
eDumbe <strong>Municipality</strong> 9 3<br />
Nongoma <strong>Municipality</strong> 26 2<br />
Ulundi <strong>Municipality</strong> 14 10<br />
uPhongolo <strong>Municipality</strong> 6 6<br />
Accessibility to community halls/centres with regard to travelling distance is shown in the following table.<br />
Table 48: Accessibility to Community Halls/Centres<br />
0 - 10km<br />
Local <strong>Municipality</strong> Households Population Percentage<br />
Abaqulusi <strong>Municipality</strong> 15122 102270 45%<br />
eDumbe <strong>Municipality</strong> 4307 29128 30%<br />
Nongoma <strong>Municipality</strong> 4381 29629 13%<br />
Ulundi <strong>Municipality</strong> 19033 128720 56%<br />
uPhongolo <strong>Municipality</strong> 13873 93823 67%<br />
10km - 20km<br />
Local <strong>Municipality</strong> Households Population Percentage<br />
Abaqulusi <strong>Municipality</strong> 6408 43337 19%<br />
eDumbe <strong>Municipality</strong> 7547 51040 53%<br />
Nongoma <strong>Municipality</strong> 11534 78004 35%<br />
Ulundi <strong>Municipality</strong> 9840 66548 29%<br />
uPhongolo <strong>Municipality</strong> 2892 19559 14%<br />
> 20km<br />
Local <strong>Municipality</strong> Households Population Percentage<br />
Abaqulusi <strong>Municipality</strong> 12442 84145 37%<br />
eDumbe <strong>Municipality</strong> 2336 15798 16%<br />
Nongoma <strong>Municipality</strong> 17432 117893 52%<br />
Ulundi <strong>Municipality</strong> 5415 36622 16%<br />
uPhongolo <strong>Municipality</strong> 3953 26734 19%<br />
In addition, it was noted that at least one such a facility was needed in every Traditional Authority area.<br />
The following provides details of the Traditional Councils that have and do not have community halls:<br />
Traditional Councils with Community Halls<br />
<br />
<br />
<br />
<br />
<br />
Mthethwa<br />
Mavuso<br />
Msibi<br />
Ndlangamandla<br />
Ntshangase<br />
Date: May 2013<br />
Page 108 of 194
ZULULAND IDP REVIEW 2013/2014<br />
<br />
<br />
<br />
<br />
<br />
<br />
<br />
<br />
<br />
<br />
Simelane<br />
Hlahlindlela<br />
Matheni<br />
Usuthu<br />
Buthelezi<br />
Mbatha<br />
Mlaba<br />
Ndebele<br />
Nobamba<br />
Mpungose<br />
Traditional Councils without Community Halls<br />
<br />
<br />
<br />
<br />
<br />
<br />
Ndlangamandla Ext<br />
Disputed Area<br />
Khambi<br />
Khambi Ext<br />
Mandhlakazi<br />
Zungu<br />
There are no set servicing standards for Tribal Courts. However, it is considered important that all communities do<br />
have access to tribal courts. The ZDM Community Facilities Plan that was prepared in 2004 noted that at least 1 tribal<br />
court facility would be needed for every 20 000 people.<br />
4.7 HUMAN SETTLEMENTS<br />
The Provincial Department of Housing has been engaged in a number of housing projects throughout the <strong>Zululand</strong><br />
<strong>District</strong>. It should be noted that in the past, the focus has solely been in providing housing in urban areas as shown by<br />
the completed and current housing projects in the <strong>District</strong>. However, a shift has been made recently to provide<br />
housing in rural areas in light of poverty prevalence that exists in these rural areas. It should be noted that the<br />
Department of Housing requires of local municipalities to prepare Municipal Housing Plans. The importance of<br />
including housing in a district IDP is borne in the fact that housing, albeit a local function, is dependent on bulk<br />
infrastructure that is planned, coordinated and implemented at the district level.<br />
4.7.1 DETERMINING THE HOUSING DEMAND<br />
In order to quantify the demand for housing, agreement has to be reached on what is considered to be a housing<br />
backlog. There are number of opinions on this matter. Some people consider a ratio of more than 5 people per<br />
household as overcrowding and indicative of a backlog. Other sources are of the opinion that any housing structure<br />
that is not formal (constructed of brick and mortar) is a backlog.<br />
There are three main ways of determining housing demand/need within municipal areas, these are:<br />
using statistical calculations captured through the census or other relevant studies;<br />
through the analysis of housing waiting lists; and<br />
Date: May 2013<br />
Page 109 of 194
ZULULAND IDP REVIEW 2013/2014<br />
<br />
through the provincial housing database.<br />
The Department of Housing and a number of municipalities have initiated the process of establishing municipal<br />
housing demand data bases. It is hoped that, once all of the municipalities have established their databases, the<br />
information from these municipal databases can be aggregated upward to create a provincial housing database. The<br />
establishment of this data base is supported by the DOH’s Capacity Building component which is in the process of<br />
rolling this programme out throughout KZN. However this pilot municipal database has as yet not been compiled in<br />
any of the Municipalities in <strong>Zululand</strong> <strong>District</strong> area.<br />
The Constitution of South African details the right of access to adequate housing when considering backlogs. The<br />
following criteria are used to clarify what adequate housing means:<br />
<br />
<br />
<br />
<br />
<br />
<br />
<br />
Legal security of tenure: Is fundamental to the right of access to adequate housing and protects people<br />
against arbitrary evictions, harassment and other threats.<br />
Affordability: The amount a person or family pays for housing should not compromise the attainment of<br />
other basic needs.<br />
Availability of services, materials, facilities and infrastructure: An adequate house contains facilities essential<br />
for health, security, comfort and nutrition.<br />
Habitability: Inhabitants must be ensured adequate space and protection against the weather and disease.<br />
Accessibility: Disadvantaged groups should be assured some degree of priority consideration in housing.<br />
Location: Adequate housing must be situated so as to facilitate access to employment opportunities, health<br />
care services, schools and other social facilities.<br />
Cultural adequacy: Building materials and design must enable the expression of cultural identity and diversity<br />
without compromising modern technological facilities.<br />
The census data base was used to determine the demand for housing. This is because some beneficiaries may put<br />
their names in more than one municipality’s database thereby inflating the waiting list of several municipalities.<br />
According to the 2011 Census, 34% of the households in <strong>Zululand</strong> live in traditional dwellings.<br />
Table 49: Distribution of households by main dwelling<br />
Main Dwellings 1996 2001 2011<br />
Formal dwelling 43 802 74 117 115 240<br />
Informal dwelling 2 100 3 725 1 905<br />
Traditional dwelling 56 646 62 932 39 485<br />
Total 102 548 140 774 156 630<br />
Source: Census 2011 Municipal Report<br />
Date: May 2013<br />
Page 110 of 194
ZULULAND IDP REVIEW 2013/2014<br />
Type of Main Dwelling<br />
1996 2001 2010<br />
Formal dwelling Informal dwelling Traditional dwelling<br />
There has been a dramatic increase<br />
in the number of households<br />
between 1996 and 2001, and<br />
between 2001 and 2011 in the<br />
number of households residing in<br />
formal dwellings. The increase in<br />
the number of households residing<br />
in formal dwellings between 1996<br />
and 2001 was 30,315 households,<br />
and between 2001 and 2011, some<br />
41,123 households. In 2011, some<br />
1,905 households resided in informal<br />
dwellings.<br />
Table 50: Households by main dwelling<br />
Type of main dwelling<br />
Total<br />
House or brick/concrete block structure on a separate stand or yard or on a farm 101 098<br />
Traditional dwelling/hut/structure made of traditional materials 39 485<br />
Flat or apartment in a block of flats 8 194<br />
Cluster house in complex 551<br />
Townhouse (semi-detached house in a complex) 522<br />
Semi-detached house 199<br />
House/flat/room in backyard 3 933<br />
Informal dwelling (shack; in backyard) 1 131<br />
Informal dwelling (shack; not in backyard; e.g. in an informal/squatter settlement or on a farm) 774<br />
Room/flatlet on a property or larger dwelling/servants quarters/granny flat 743<br />
Caravan/tent 286<br />
Other 831<br />
The following table has a positive aspect in that the number of households that own and have paid for their dwellings<br />
has increased.<br />
Table 51: Tenure Status (2011)<br />
Tenure Status 2001 2011<br />
Owned and fully paid off 65 543 80 282<br />
Owned but not yet paid<br />
off 13 226 15 390<br />
Rented 12 977 21 250<br />
Occupied rent-free 49 446 35 936<br />
Source: Census 2011 Municipal Report<br />
100 000<br />
80 000<br />
60 000<br />
40 000<br />
20 000<br />
0<br />
Owned and<br />
fully paid<br />
off<br />
Tenure status<br />
Owned but<br />
not yet<br />
paid off<br />
Rented<br />
Occupied<br />
rent-free<br />
2001<br />
2011<br />
There has been an increase, between 2001 and<br />
2011, in the number of households who owned and<br />
paid off their respective dwellings. There has also<br />
been a significant increase in rented dwellings.<br />
Figure 22: Tenure Status 2001, 2011<br />
Date: May 2013<br />
Page 111 of 194
ZULULAND IDP REVIEW 2013/2014<br />
4.7.2 DEPARTMENTAL HOUSING PROJECTS<br />
A list of confirmed housing projects, sourced from the Department of Housing is indicated in the Projects section:<br />
Table 52: Departmental Housing Projects per Local <strong>Municipality</strong><br />
Project Name Local <strong>Municipality</strong> Project Type Instrument Total Units<br />
Bhekumthetho Abaqulusi M Rural Rural 1 000<br />
Bhekuzulu Phase 6-B Abaqulusi M Urban PLS 1 078<br />
Coronation Abaqulusi M Urban PLS 1 200<br />
Coronation Aids Abaqulusi M Institutional PLS 500<br />
Frischgewaagd Abaqulusi M Urban PLS 3 094<br />
Mzamo Abaqulusi M Urban PLS 500<br />
Vryheid Ext 16 Abaqulusi M Conditional<br />
Approval<br />
PLS 1 016<br />
Baxedene Nongoma M. Rural Rural 1 400<br />
Holinyoka Nongoma M. Rural Rural 1 100<br />
Maye/Dabhasi Nongoma M. Rural Rural 1 000<br />
Siyazama Nongoma M. Rural Rural 1 000<br />
Ekudubekeni Ulundi M Rural Rural 1 600<br />
Ekushumayeleni Ulundi M Rural Rural 1 600<br />
KwaXimba Ulundi M Rural Rural 2 000<br />
Nsukazi Ulundi M Rural Rural 1 000<br />
Ntsabekhuluma Ulundi M Rural Rural 2 000<br />
Ulundi HIV / AIDS Ulundi M Institutional PLS 1 000<br />
Ulundi L ext Ulundi M urban PLS 954<br />
Zondela Ulundi M Urban PLS 873<br />
Ncotshane Pongola Pongola Urban PLS 1 100<br />
Dumbe lindelani Dumbe M Urban PLS 200<br />
From the above table it is noted that a total of 22 942 housing units are approved by the Department of Housing.<br />
Furthermore, all the Local Municipalities have completed or are nearly complete with the preparation of their Housing<br />
Sector Plans. A process has been initiated by the ZDM to map both the confirmed and the proposed projects in order<br />
to ensure sustainable infrastructure planning and alignment.<br />
4.8 TELECOMMUNICATIONS<br />
Table 53: Household Access to Telecommunications<br />
Telecommunication No of Households % of Households<br />
Goods<br />
2001 2011 2001 2011<br />
Radio 99744 108615 70.64 68.85<br />
Television 42363 91323 30.00 57.89<br />
Computer 2554 11344 1.81 7.19<br />
Landline/Telephone 12954 7240 9.17 4.59<br />
Cell-phone 31848 138124 22.56 87.56<br />
Date: May 2013<br />
Page 112 of 194
ZULULAND IDP REVIEW 2013/2014<br />
Telecommunication No of Households % of Households<br />
Goods<br />
2001 2011 2001 2011<br />
Internet 0 45688 0.00 28.96<br />
Source: Census 2011 Municipal Report<br />
160000<br />
140000<br />
120000<br />
100000<br />
80000<br />
60000<br />
40000<br />
20000<br />
0<br />
Household Access to<br />
Telecommunications (2011)<br />
Between 2001 and 2011, there has<br />
been a dramatic increase in the<br />
number of households who had access<br />
to televisions, cell phones and the<br />
internet. In 2011, some 58% of all<br />
households had access to television;<br />
some 88% had access to a cell phone;<br />
and some 29% had access to internet.<br />
This is important to note, since it<br />
could, in the future, become a means<br />
to directly communicate with<br />
households.<br />
2001 2011<br />
Figure 23: Household Access to Telecommunications (2011)<br />
4.9 SERVICE DELIVERY & INFRASTRUCTURE: SWOT ANALYSIS<br />
4.9.1 STRENGTHS/OPPORTUNITIES<br />
<br />
<br />
<br />
<br />
<br />
<br />
<br />
<br />
The ZDM has an indigent policy in place.<br />
To measure consumption in unmetered zones, the municipality uses the water balance to determine<br />
consumption.<br />
The <strong>Zululand</strong> <strong>District</strong> Water Services Plan gives a clear indication as to where and when water infrastructure<br />
will be provided in the <strong>District</strong>. It provides a clear indication of what amount of water capital infrastructure<br />
will be provided when and at what cost and during which year. MIG business plans in excess of R1,5 billion<br />
have already been approved.<br />
The following forums are in place to attend and align disaster management responses:<br />
Disaster Management, Health and Safety Portfolio Committee<br />
Disaster Management Advisory Forum<br />
Provincial Disaster Management Advisory Forum<br />
The ZDM has finalized the preparation of its Disaster Management Plan and procurement processes are<br />
underway to ensure the implementation of the said plan.<br />
Date: May 2013<br />
Page 113 of 194
ZULULAND IDP REVIEW 2013/2014<br />
4.9.2 THREATS/WEAKNESSES<br />
<br />
<br />
<br />
<br />
<br />
<br />
Large disparities are apparent in terms of the nature and structure of the built environment with the most<br />
significant disparity between the level of services and development in the rural and urban areas of the<br />
<strong>District</strong>.<br />
Only 20 % have access to a formal waste disposal system, and these are in urban areas.<br />
According to the <strong>Zululand</strong> Cemeteries Master Plan, approximately 700 ha of land will be required in the<br />
<strong>Zululand</strong> <strong>District</strong> <strong>Municipality</strong> by the year 2020 to accommodate approximately 800 000 cumulative deaths at<br />
that time.<br />
Road infrastructure is under pressure particularly from heavy vehicles.<br />
The responsibility between Local and <strong>District</strong> municipalities as well as the Department of Transport (DOT) for<br />
road provision and maintenance still needs to be finalized and has been flagged as a key development issue.<br />
The electricity network in the southern portions of <strong>Zululand</strong> has very limited capacity.<br />
5. LOCAL ECONOMIC & SOCIAL DEVELOPMENT ANALYSIS<br />
5.1 LOCAL ECONOMIC DEVELOPMENT ANALYSIS<br />
5.1.1 ECONOMIC PROFILE OF COMMUNITY<br />
Functional age groups indicate the level of the potential work force in the region. Therefore, the key age group relates<br />
to individuals aged 15 to 64 years. The following tables provide a comparison between the 1996, 2001 and 2011<br />
census years in respect of the 0-14, 15-64 and 65+ population age cohorts.<br />
Table 54: Economic Population<br />
Age Cohort Gender 1996 2001 2011<br />
0-14<br />
Male 149 244 164 023 159 770<br />
Female 150 018 164 092 157 937<br />
15-64<br />
Male 151 496 183 483 200 297<br />
Female 200 737 231 772 248 033<br />
65+<br />
Male 10 542 11 745 12 133<br />
Female 19 579 24 955 25 405<br />
Source: Census 2011<br />
Figure 24: Economic Population<br />
Date: May 2013<br />
Page 114 of 194
ZULULAND IDP REVIEW 2013/2014<br />
500 000<br />
450 000<br />
400 000<br />
350 000<br />
300 000<br />
250 000<br />
200 000<br />
150 000<br />
100 000<br />
50 000<br />
0<br />
0-14 15-64 65+<br />
1996<br />
2001<br />
2011<br />
The information presented<br />
herewith illustrates an<br />
increase in the potentially<br />
economic<br />
active<br />
population from 1996 to<br />
2011 and a slight decline<br />
in the 0-14 age cohort<br />
between 2001 and 2011.<br />
Source: Census 2011<br />
5.1.2 MAIN ECONOMIC CONTRIBUTORS<br />
The table hereunder shows the relative share of total provincial GVA for each of the districts in the province. What is<br />
immediately obvious is that eThekwini is by far the largest contributor to economic output in the province,<br />
contributing over 53% in 2010. Umgungundlovu and uThungulu at 11.7% and 7.6% respectively are the next biggest<br />
contributors. <strong>Zululand</strong> ranks 6th out of the 11 districts, contributing 4.1% to provincial GVA. <strong>Zululand</strong> is ranked<br />
lower for economic output for the province than it is for total population, wherein it is ranked 4th. This indicates that<br />
GVA per capita within <strong>Zululand</strong> is comparatively low in the provincial context.<br />
Table 55: GVA per Capita per <strong>District</strong> <strong>Municipality</strong><br />
<strong>District</strong> 2003 2005 2007 2009<br />
Ugu 4.20% 4.20% 4.30% 4.40%<br />
Umgungundlovu 12.00% 11.90% 11.80% 11.70%<br />
Uthukela 3.90% 4.10% 4.40% 4.70%<br />
Umzinyathi 1.80% 1.80% 2.00% 2.10%<br />
Amajuba 3.80% 3.60% 3.60% 3.50%<br />
<strong>Zululand</strong> 3.50% 3.50% 3.70% 4.10%<br />
Umkhanykude 1.80% 2.00% 2.20% 2.40%<br />
Uthungulu 8.10% 7.80% 7.80% 7.50%<br />
iLembe 4.00% 4.00% 3.90% 3.80%<br />
Sisonke 1.90% 2.00% 2.00% 2.30%<br />
eThekwini 54.90% 55.10% 54.30% 53.40%<br />
Source: DEDT calculations based on Quantec data (2011)<br />
Total GVA for <strong>Zululand</strong> in 2010 was estimated at R10.9 billion. In the same way that provincial GVA is not evenly split<br />
between districts, district GVA is not evenly split between municipalities. Abaqulusi and Ulundi municipalities<br />
contribute the majority of economic output for the district, between them contributing almost 63%. Abaqulusi<br />
<strong>Municipality</strong> contains the town of Vryheid, which is the district’s business and economic hub, while the town of Ulundi<br />
within Ulundi <strong>Municipality</strong> was formerly the seat of provincial government and remains a town of significant regional<br />
importance. It is not surprising that eDumbe <strong>Municipality</strong> contributes the least to GVA as the municipality also has the<br />
Date: May 2013<br />
Page 115 of 194
ZULULAND IDP REVIEW 2013/2014<br />
smallest population in <strong>Zululand</strong>. It is concerning, however, that Nongoma, which has the second highest population<br />
of all the <strong>Zululand</strong> municipalities, only contributes 13.6% to economic output.<br />
Gross Value Added is the total of all production or services from every sector within the period of a year. It is useful,<br />
however, to know the main economic drivers within an economy, namely, which sectors add the most value to the<br />
local economy. The following table displays the relative contributions of each industry to <strong>Zululand</strong>’s Gross Value<br />
Added. In 2010, General Government was the greatest contributor to value added/economic output, accounting for<br />
22.5% of district GVA. This is not unusual for developing and relatively impoverished local economies, as government<br />
attempts to act as a catalyst for future private investments. In addition to general government, manufacturing; and<br />
wholesale and retail trade are important sectors. The share of both of these sectors is growing. This is particularly<br />
encouraging to see in the manufacturing sector, as this sector is targeted at national government level as an engine of<br />
economic growth and employment creation for the South African economy. Both agriculture and mining have<br />
experienced falling shares over the past 8 years. This is reflective of the larger national and provincial trend in these<br />
sectors which has seen a steady decline in their economic contribution.<br />
Table 56: Sector/Industry share of GVA (2003-2010)<br />
Sector 2003 2004 2005 2006 2007 2008 2009 2010 Ave<br />
share<br />
Agriculture and 12.4% 11.9% 10.9% 9.9% 9.3% 10.0% 9.5% 9.4% 10.4%<br />
forestry<br />
Mining and quarrying 7.0% 6.8% 5.7% 5.3% 5.4% 5.1% 7.1% 6.7% 6.1%<br />
Manufacturing 9.5% 10.4% 11.4% 12.5% 13.3% 13.8% 13.1% 13.4% 12.2%<br />
Electricity, gas and 2.4% 2.4% 2.4% 2.3% 2.2% 1.9% 1.9% 1.9% 2.2%<br />
water<br />
Construction 2.0% 2.2% 2.5% 2.6% 2.9% 3.1% 3.1% 3.1% 2.7%<br />
Wholesale and retail 12.8% 13.4% 14.1% 14.8% 15.0% 14.7% 14.5% 14.6% 14.2%<br />
trade<br />
Transport and 11.0% 11.0% 11.2% 11.1% 11.1% 11.0% 10.7% 10.8% 11.0%<br />
communication<br />
Finance 12.1% 11.8% 11.9% 12.1% 12.0% 12.1% 11.8% 11.8% 12.0%<br />
Community, social 7.6% 7.4% 7.4% 7.3% 7.2% 7.0% 6.8% 6.7% 7.2%<br />
and personal services<br />
General government 23.1% 22.6% 22.6% 22.1% 21.5% 21.3% 21.4% 21.7% 22.1%<br />
Source: DEDT calculations based on Quantec data (2011)<br />
Changes in the GVA share of each sector is perhaps more clearly seen in the growth rates for each sector over the past<br />
8 years. As expected, considering the low GVA growth in 2010 for the district, all sectors recorded relatively low<br />
growth rates in 2010. General Government sustained the highest growth rate at 3%, further highlighting the fact that<br />
government spending is often not as sensitive to prevailing economic conditions as private sector spending is. In fact,<br />
Government spending often operates counter-cyclically, spending more in times of economic downturns, in order to<br />
stimulate the economy and retain employment. This trend, however, does not appear to be represented in the data,<br />
and even government spending has been constrained by the general post-recession slump in <strong>Zululand</strong>.<br />
The following graph provides a graphic representation of the importance of each sector to district economic output, as<br />
well as showing the average growth of each sector. It is evident that the district’s largest contributors to GVA are not<br />
necessarily the fastest growth sectors. While General Government yields the highest in terms of Gross Value Added, it<br />
is one of the lower growth sectors. Construction, on the other hand, contributes relatively little in terms of GVA, but<br />
is a high growth sector, averaging 12.5% per annum, over an 8 year period, despite registering very little growth<br />
(1.1%) in 2010. This indicates that significant construction and development activities have taken place in <strong>Zululand</strong>,<br />
over the period under review. Unusually Electricity, Gas and Water, has grown very little, despite increased<br />
construction taking place. Wholesale and Retail Trade has reflected relatively strong growth over the period. This is<br />
in accordance with the expanding needs of a growing population and increasing levels of wealth (GVA per capita).<br />
Date: May 2013<br />
Page 116 of 194
ZULULAND IDP REVIEW 2013/2014<br />
Figure 25: Total GVA and GVA Growth by Economic Sector<br />
Source: DEDT calculations based on Quantec data (2011<br />
5.1.3 EMPLOYMENT AND INCOME LEVELS<br />
5.1.3.1 LABOUR FORCE PARTICIPATION<br />
High unemployment undermines the equitable distribution of income and underpins poverty. Employment is one of<br />
the main desired outcomes of economic growth and is currently a major focus of government policy at the national<br />
level. The table hereunder summarizes some critical labour market indicators for <strong>Zululand</strong> in 2009.<br />
Table 57: ZDM General Labour Indicators 2009<br />
Indicator eDumbe uPhongolo Abaqulusi Nongoma Ulundi <strong>Zululand</strong><br />
Employed 7,918 19,864 36,873 14,033 24,294 102,983<br />
Unemployed 10,846 11,886 14,536 12,017 51,842<br />
Not Economically<br />
active<br />
Labour force<br />
participation rate<br />
32,131 48,015 93,759 97,070 72,794 343,768<br />
24.60% 39.00% 34.20% 22.70% 33.30% 31.10%<br />
Unemployment<br />
rate<br />
24.40% 35.30% 24.40% 50.90% 33.10% 33.50%<br />
Source: DEDT calculations based on Quantec data (2011)<br />
A large degree of economic inactivity is borne out by the labour force participation rate, which indicates that only<br />
31.1% of the working age population are engaged in actual employment or are actively seeking work. This level of<br />
labour force participation is very low and is significantly lower than the provincial rate of 43.9%. The implication of<br />
this finding is that there are probably a large number of discouraged work-seekers in the economy. This is typical of<br />
an economy in which there are high and persistent rates of unemployment.<br />
At 33.5%, on the strict definition of<br />
Date: May 2013<br />
Page 117 of 194
ZULULAND IDP REVIEW 2013/2014<br />
unemployment, compared to 23.2% for the province, unemployment in <strong>Zululand</strong> is unsustainably high and is having<br />
the negatively impact of discouraging people from spending the time and money to actively search for jobs.<br />
Table 58: Comparative Labour Indicators for ZDM<br />
Employment Status 1996 2001 2011<br />
Employed 63 161 66 481 83 361<br />
Unemployed 76 849 103 086 58 247<br />
Unemployed Rate 54.9 60.8 41.1<br />
Source: Census 2011<br />
The above table provides a comparison of the 1996, 2001 and 2011 census information. It can be seen that<br />
unemployment has decreased over the census years but seems to have increased between the 2009 Quantec<br />
estimates (as per previous table) and the 2011 census. This incidence can be explained by the onset of the global<br />
economic recession.<br />
Table 59: Employment Status by Gender 2011<br />
Employment status 2011 Male Female<br />
Employed 42 502 40 859<br />
Unemployed 25 370 32 878<br />
Discouraged work-seeker 20 852 29 400<br />
Other not economically active 111 573 144 895<br />
Not applicable 171 903 183 342<br />
Source: Census 2011<br />
Figure 26: Employment Status by Gender 2011<br />
The table and figure herewith depicts<br />
that employment levels in the district are<br />
close of similar between males and<br />
females in the district, but the<br />
unemployment, discouraged and not<br />
economically-active counts are higher for<br />
females. This could be as a result of the<br />
higher male: female ratio or as an result<br />
of males finding employment outside the<br />
district.<br />
Source: Census 2011<br />
Date: May 2013<br />
Page 118 of 194
1995<br />
1996<br />
1997<br />
1998<br />
1999<br />
2000<br />
2001<br />
2002<br />
2003<br />
2004<br />
2005<br />
2006<br />
2007<br />
2008<br />
2009<br />
Rate %<br />
ZULULAND IDP REVIEW 2013/2014<br />
Figure 27: Comparison of Labour Force Participation Trends (1995 - 2009)<br />
70<br />
60<br />
50<br />
40<br />
30<br />
20<br />
<strong>Zululand</strong> LFP<br />
KZN LFP<br />
10<br />
0<br />
Source: DEDT calculations based on Quantec data (2011)<br />
The figure above depicts a downward sloping trend in labour force participation both for <strong>Zululand</strong> and for the entire<br />
province. This then puts the declining strict unemployment rate into perspective. Evidently one of the major causes<br />
of a declining strict unemployment in <strong>Zululand</strong> is decreasing labour force participation and not rapidly expanding<br />
employment. This must be seen as a severe challenge for the district, as decreasing labour force participation is not<br />
so much a product of a decreased desire to work but rather of the discouraging impact of long-term unemployment<br />
on the search activities of individuals.<br />
Table 60: Employment by <strong>Municipality</strong><br />
<strong>Municipality</strong> 2003 2005 2007 2009<br />
eDumbe 10,959 10,102 9,311 7,918<br />
uPhongolo 21,665 21,194 21,117 19,864<br />
Abaqulusi 30,369 32,472 35,808 36,873<br />
Nongoma 9,005 10,149 12,185 14,033<br />
Ulundi 17,131 18,856 21,780 24,294<br />
<strong>Zululand</strong> 89,129 92,773 100,201 102,983<br />
Source: DEDT calculations based on Quantec data (2011)<br />
Employment has increased by just over 13,000 people between 2003 and 2009. This is insufficient in the light of<br />
population growth of over 106 000 in the same period. The low total employment growth is partly a result of<br />
declining employment in eDumbe and uPhongolo municipalities. The figure hereunder depicts the share of each<br />
municipality in total employment for <strong>Zululand</strong>. Abaqulusi is by far the biggest employer in the district, while eDumbe<br />
has the least employed individuals. This corresponds with the GVA share findings presented earlier.<br />
Date: May 2013<br />
Page 119 of 194
ZULULAND IDP REVIEW 2013/2014<br />
Figure 28: Municipal Share of Total <strong>District</strong> Employment<br />
Nongoma<br />
14%<br />
Ulundi<br />
23%<br />
eDumbe<br />
8% uPhongola<br />
19%<br />
Abaqulusi<br />
36%<br />
Source: DEDT calculations based on Quantec data (2011)<br />
The 2011 census data was used to compile the following map that indicates the unemployment in the ZDM spatially.<br />
The map clearly indicates that unemployment levels are most significant in the uLundi and Nongoma Local<br />
Municipalities as well as the northern parts of the uPhongolo Local <strong>Municipality</strong>. High unemployment is also noted in<br />
the areas around eMondlo in the Abaqualusi Local <strong>Municipality</strong>.<br />
Map 29: Unemployment in 2011<br />
Date: May 2013<br />
Page 120 of 194
ZULULAND IDP REVIEW 2013/2014<br />
5.1.3.2 INCOME AND DEPENDENCY<br />
The following table indicates that the majority (about 80%) of the population of ZDM earn less than R38 200 per<br />
annum, this equates to just over R3 000 per month.<br />
Table 61: Annual household income 2011<br />
Annual Household Income Total %<br />
No income 20 369 13<br />
R 1 - R 4800 8 826 6<br />
R 4801 - R 9600 16 842 11<br />
R 9601 - R 19 600 37 581 24<br />
R 19 601 - R 38 200 37 164 24<br />
R 38 201 - R 76 400 17 159 6<br />
R 76 401 - R 153 800 9 829 6<br />
R 153 801 - R 307 600 6 066 4<br />
R 307 601 - R 614 400 2 843 2<br />
R 614 001 - R 1 228 800 557 0<br />
R 1 228 801 - R 2 457 600 246 0<br />
R 2 457 601 or more 263 0<br />
Unspecified 4 0<br />
Source: Census 2011<br />
The spatial analysis of the above trend has been mapped on the following inset. It can be seen that the northern<br />
section of the eDumbe and uPongolo Local Municipalities have very large percentages of households earning less than<br />
R1600 per month. Similar trends are observed in the eastern parts of Nongoma and uLundi while a number of areas<br />
of the Abaqulusi <strong>Municipality</strong> has very low households income levels for large portions of the population, specifically<br />
around Louwsburg, Enyati and Emondlo.<br />
Date: May 2013<br />
Page 121 of 194
ZULULAND IDP REVIEW 2013/2014<br />
Map 30: Lowest Income Levels<br />
The dependency ratio measures the proportion of the population that is outside the labour force and is dependent on<br />
the economic activity of those working. A high dependency ratio can cause serious problems for a country. A high<br />
dependency ratio implies that a large proportion of the government's expenditure is on health, pension, social<br />
security and education which are most used by old and young population. Generally, there has been a declining trend<br />
in the dependency ratio for South Africa and the regional economies during the period under review primarily due to a<br />
number of developmental programmes that were introduced by the government since the advent of the new<br />
democratic South Africa post-1994. Some of these programmes include, inter-alia, social grants, economic<br />
transformation, a myriad of poverty reduction programmes and the high economic growth trajectory observed since<br />
1994. The decline in the dependency ratio, however, depends on a number of other factors such fertility rate, death<br />
rate, working and retirement ages.<br />
The dependency ratio can be interpreted as a crude measure of poverty. This argument is correct in the sense that<br />
only a handful of people in the labour force are sustaining a large proportion of dependents.<br />
The following table indicates how dependency rates have changed between 1996, 2001 and 2011. The very high<br />
population below the 14 years of age and above 65 is placing an additional burden on the economically active<br />
population.<br />
Date: May 2013<br />
Page 122 of 194
ZULULAND IDP REVIEW 2013/2014<br />
Table 62: Dependency Number<br />
<strong>Zululand</strong> 1996 2001 2011<br />
Population aged 14 years and younger 299 262 328 115 317 707<br />
Population aged 65 years and older 30 121 36 699 37 537<br />
Dependent population 329 383 364 814 355 244<br />
Population aged between 15 and 64 years 352 233 415 254 448 330<br />
Dependency ratio 93.5 87.9 79.2<br />
Source: Census 2011<br />
Figure 29: Dependency Number<br />
500 000<br />
450 000<br />
400 000<br />
350 000<br />
300 000<br />
250 000<br />
200 000<br />
150 000<br />
100 000<br />
50 000<br />
0<br />
Population aged 14<br />
years and younger<br />
Population aged 65<br />
years and older<br />
Population aged<br />
between 15 and 64<br />
years<br />
1996<br />
2001<br />
2011<br />
Source: Census 2011<br />
The following graph indicates that dependency has decreased although it remains high considering the low income<br />
levels of people/households employed.<br />
Figure 30: Comparative Dependency Ratio<br />
93.5<br />
87.9<br />
With the graph below it is evident that the <strong>Zululand</strong> <strong>District</strong><br />
<strong>Municipality</strong> has one of the highest dependency ratios<br />
between children and adults respectively. This<br />
demonstrates a need to sustain social development<br />
programmes and support to such communities by the<br />
municipality and its stakeholders.<br />
79.2<br />
1996 2001 2011<br />
Source: Census 2011<br />
Date: May 2013<br />
Page 123 of 194
ZULULAND IDP REVIEW 2013/2014<br />
Dependency is visually depicted in the following map inset that has been based on the 2011 census results. It can be<br />
seen that dependency levels in the district are higher in the southern and south western portions, i.e. the Nongoma<br />
and Ulundi Local Municipal areas.<br />
Map 31: Dependency<br />
5.1.3.3 POVERTY AND INEQUALITY<br />
More than 5.2 million people or 49% of the province’s population is considered to be living in poverty. <strong>Zululand</strong><br />
contributes 602,895 or 11.5% to that figure, and has a poverty rate of 65.8%. Poverty in <strong>Zululand</strong> and in the broader<br />
province was on a decreasing trend until 2008, when the recessionary global climate pushed the incidence of poverty<br />
back up again. The majority of <strong>Zululand</strong>’s impoverished population can be found residing in Abaqulusi and Nongoma<br />
municipalities.<br />
The Gini coefficient is perhaps the best known inequality measure and can be derived from the Lorenz curve.<br />
Mathematically the Gini coefficient varies between zero and one, although in reality values usually range between<br />
0.20 and 0.30 for countries with a low degree of inequality and between 0.50 and 0.70 for countries with highly<br />
unequal income distributions.<br />
Date: May 2013<br />
Page 124 of 194
ZULULAND IDP REVIEW 2013/2014<br />
Table 63: Gini Coefficient for <strong>Zululand</strong> (2003-2008)<br />
<strong>Municipality</strong> 2003 2004 2005 2006 2007 2008<br />
eDumbe 0.6 0.6 0.59 0.59 0.6 0.6<br />
uPhongolo 0.6 0.6 0.59 0.6 0.6 0.6<br />
Abaqulusi 0.66 0.66 0.65 0.65 0.66 0.66<br />
Nongoma 0.6 0.6 0.6 0.6 0.6 0.6<br />
Ulundi 0.61 0.62 0.62 0.62 0.62 0.62<br />
<strong>Zululand</strong> 0.62 0.62 0.62 0.62 0.62 0.63<br />
KZN 0.67 0.67 0.67 0.67 0.67 0.67<br />
Source: Global Insight 2009<br />
<strong>Zululand</strong>, on average is less unequal than the province as a whole, with a Gini Coefficient of 0.63. This may be because<br />
there are less high-earning individuals in <strong>Zululand</strong>, and so the scope for inequality, although high, is not as great.<br />
Interestingly, Abaqulusi is the most unequal of the municipalities in <strong>Zululand</strong>. This is no doubt attributable to the<br />
greater degree of economic activity taking place in the district’s biggest municipal economy, providing greater scope<br />
for inequality to exist.<br />
The following map has been developed using census 2011 data and indicates that the highest rate of poverty exists in<br />
the area with the highest dependency ratio’s, namely the southern and south western portions, i.e. the Nongoma and<br />
Ulundi Local Municipal areas.<br />
Map 32: Poverty Index<br />
Date: May 2013<br />
Page 125 of 194
ZULULAND IDP REVIEW 2013/2014<br />
The spatial relation between poverty and population density is indicated in the following map inset that has been<br />
derived from the 2011 census results. The importance is such an analysis is borne therein that efforts to redress<br />
poverty could be focused on areas that have high density and therefore maximum benefit could be attained.<br />
Map 33: Spatial Relation between Population Density and Poverty<br />
5.1.4 SMME’s<br />
One of the development objectives of the ZDM is to identify and develop economic opportunities for the rural<br />
population in the <strong>District</strong> in order to reduce poverty. The promotion of SMME development in the district is an action<br />
from this and this has also been identified in the LED Plan, i.e. development and support opportunities for business<br />
development have been identified.<br />
The KwaZulu-Natal Department of Economic Development and Tourism has embarked on a number of initiatives to<br />
assist the development of emerging entrepreneurs:<br />
• Access to Finance: The Department has entered into an agreement with three banking institutions (Standard<br />
Date: May 2013<br />
Bank, ABSA and Ithala Bank) to establish a joint SMME fund to assist with finance for small businesses.<br />
Contribution to this fund is on a 50 / 50 basis – the Department contributes 50% and the banking institution<br />
Page 126 of 194
ZULULAND IDP REVIEW 2013/2014<br />
the remaining 50% - and it is left to the banking institution to handle all finance arrangements with the<br />
beneficiaries of this programme.<br />
• Access to Markets: By being visible through the attendance of the Department at SMME fairs and Business<br />
fairs, the opportunity is created for small enterprises to have their products marketed to a large potential<br />
customer base. Municipalities are invited to partner with the Department in the establishment of a presence<br />
at these fairs and, while promoting the SMME sector also have the opportunity of promoting the unique<br />
features of its municipal area.<br />
• Training and Capacity Building: The Department provides opportunity to members of the SMME sector to<br />
attend training courses offered by FET Colleges at no cost. Courses offered include financial management,<br />
business management and courses relating to specific technical disciplines.<br />
The needs of agricultural cooperatives within the municipal area are provided for by the KZN Department of<br />
Agriculture while, in general, any non-agricultural cooperatives will make their approach for funding to Ithala Bank.<br />
Regarding funding for SMMEs and cooperatives the primary challenge is to comply with the requirements of the bank<br />
before funding can be made available. Generally the applicant is requested to prepare and present a business plan as<br />
support to the funding request which is beyond the capacity of the majority of individuals and cooperatives that<br />
comprise this particular sector.<br />
The National Department of Energy has embarked on an initiative known as the Integrated Energy Programme. An<br />
Integrated Energy Centre (IeC) is a one-stop energy shop owned and operated by a community cooperative and<br />
organised as a community project. It provides energy solutions to communities and access to affordable, safe and<br />
sustainable energy services. The IeC’s act as community hubs located closer to the community than the urban centres<br />
from which they would ordinarily obtain their energy needs. The IeC is able to purchase products such as illuminated<br />
paraffin, liquid petroleum gas, petrol and diesel direct from oil companies and then sell these products to the<br />
community at more affordable prices. Funding for the development of the IeC is generally provided by the oil<br />
company concerned (it is also likely to set up a forecourt as part of the development) and the Department of Energy.<br />
The Department of Energy has commenced the process of establishing an IeC within the municipal area; the<br />
community cooperative for this project has already been formed and registered. There is no reason why the IeC<br />
should not act as a catalyst for other participants in the SMME sector to participate by offering related products and<br />
services; given the location of this particular IeC it can beneficially be used by the <strong>Municipality</strong> as part of its tourism<br />
marketing initiatives.<br />
5.1.5 AGRICULTURE<br />
The <strong>Zululand</strong> Agricultural Sector Plan (prepared by PR Africa in 2006) provides the following summary in terms of the<br />
agricultural potential in the <strong>District</strong>.<br />
Good agricultural potential exists in the western highlands and the eDumbe <strong>Municipality</strong> has very high potential as has<br />
most of the Abaqulusi municipality. High potential in the Phongola valley is as a result of irrigation opportunities that<br />
have been developed in this area. Current land cover reflects these potentials.<br />
The communal areas of Ulundi and Nongoma are however not as fortunate and the agricultural potential is marginal<br />
to poor except for the high lying plateaus in each district. However, these make up a small portion of the total area.<br />
Valley bushveld of the two Umfolozi Rivers does provide considerable potential for the development of irrigation.<br />
Given the high temperatures in these valleys and the moderate winters, these areas are perfectly suited for the<br />
production of vegetables in the winter or off-season. Moreover, the deep low altitude river valleys of Pongolo and<br />
Mfolozi Rivers provide an excellent opportunity for intensive agricultural production where irrigation is available where<br />
Date: May 2013<br />
Page 127 of 194
ZULULAND IDP REVIEW 2013/2014<br />
sugar cane and out of season vegetables and sub-tropical fruits can be planted. Agricultural potential outside these<br />
valleys is limited to stock and game farming. 4<br />
The said document tabled interventions that need to be employed in order to develop the agricultural sector and<br />
these include:<br />
o<br />
o<br />
o<br />
o<br />
Institutional structuring for agriculture<br />
Sustainable land reform<br />
Visible delivery in agriculture sector<br />
Improved market access for agricultural products<br />
The agricultural sector is presently under strain throughout the country. Some of the key concerns to the sector are:<br />
o<br />
o<br />
o<br />
o<br />
Uncertainty that is caused by land reform<br />
Lack of imagination on what can be done with the land once the claimants have received the land and in some<br />
instances the land is not productively utilized<br />
Increasing input costs<br />
Rising interest rates<br />
It has been argued that, in order for the agriculture sector to be developed, opportunities for tapping into the<br />
international markets need to be created and in the case of <strong>Zululand</strong>, these opportunities can be linked to the Dube<br />
Trade Port Developments. Where possible, major co-operates will need to be involved and focus should be paid to<br />
various areas of opportunity in the <strong>District</strong>. The need for improved railway infrastructure in the <strong>District</strong> was also<br />
identified.<br />
Agriculture is a major sector within the <strong>Municipality</strong> and has the potential to contribute to the development of<br />
employment opportunities as well as addressing matters related to food security. The KZN Department of Agriculture<br />
has three primary programmes that focus on the emerging farmer community within the <strong>Municipality</strong>.<br />
commercial farms are located within the western part of the <strong>Municipality</strong>; these farmers require limited assistance<br />
from the Department. Each ward in the <strong>Municipality</strong> has its own farmers association representing the interests of the<br />
farmers, commercial and emerging, in that ward.<br />
Under the auspices of the Flagship Programme, the Department of Agriculture has commenced implementation of the<br />
One Home, One Garden initiative with effect from January 2011. The initiative is the responsibility of the extension<br />
officers employed by the KZN Department of Agriculture; it is proposed to provide training to 700 participants per<br />
ward in the <strong>Municipality</strong>. Participants are identified by the extension officers on the basis of need; each extension<br />
officer has a list of community gardens including those located within the traditional authority areas. However,<br />
participation in this initiative is not limited to existing community gardens; individuals are encouraged to make an<br />
approach to the Department for assistance with a community garden. Part of this initiative is to continue assisting<br />
local schools by providing them with a supply of vegetable seeds. The extension officers employed by the KZN<br />
Department of Agriculture will jointly capacitate participants in this initiative on a ward by ward basis, commencing<br />
with those wards identified as being most deprived.<br />
At overleaf, a map depicting the agricultural potential in the district is provided.<br />
Large<br />
4 <strong>Zululand</strong> Agriculture Sector Plan: (2006); pg. 17.<br />
Date: May 2013<br />
Page 128 of 194
ZULULAND IDP REVIEW 2013/2014<br />
Map 34: Agricultural Land Potential<br />
Date: May 2013<br />
Page 129 of 194
ZULULAND IDP REVIEW 2013/2014<br />
The mechanisation programme implemented by the KZN Department of Agriculture assists indigent and subsistence<br />
farmers with a tractor to plough their fields and provides these farmers with maize and vegetable seeds. The<br />
Department sub-contracts small operators to make their tractors available to assist – the cost of this initiative is paid<br />
for by the Department. The provision of maize and vegetable seeds is sufficient to plant between one and two<br />
hectares per individual farmer of between twenty and thirty hectares per farmer group.<br />
Protection of animals by the provision of veterinary health services is the third programme operated by the KZN<br />
Department of Agriculture within the service area of the <strong>Municipality</strong>. In addition to assisting farmers with the<br />
management of their livestock, the Department undertakes immunisation campaigns for identified diseases such as<br />
rabies.<br />
It is the intention of the KZN Department of Agriculture to deploy an extension officer and an extension office<br />
assistant in each ward within the <strong>Municipality</strong> – each ward will also have the services of an animal production<br />
technician and a plant production technician. All agricultural projects undertaken are owned by the participating<br />
farmers with Departmental officials providing a production advisory role; while these projects are funded from the<br />
KZN Department of Agriculture budget, the funding is provided in the form of materials (tools and seeds) only.<br />
It useful to consider the spatial relationship between areas of highest poverty and areas of highest land capability as<br />
specific measures or interventions may present themselves to address poverty from an agricultural perspective. This<br />
relationship between poverty and agricultural potential is depicted in the following map inset.<br />
Map 35: Relationship between Poverty and Agricultural Potential<br />
Date: May 2013<br />
Page 130 of 194
ZULULAND IDP REVIEW 2013/2014<br />
5.1.6 TOURISM<br />
The <strong>District</strong> finalized its Tourism Sector Plan was completed in 2006. The report presents the following picture as to<br />
the state of the sector in the <strong>District</strong>:<br />
“While the <strong>Zululand</strong> <strong>District</strong> has a wealth of attractions that are authentic and different, the key obstacles to tourism<br />
growth lie in lack of awareness and information, lack of accessibility and the failure to package these assets in an<br />
attractive way that distinguishes from the other two districts forming the greater <strong>Zululand</strong>: uThungulu and<br />
Umkhanyakude. These two districts currently attract the overwhelming majority of tourists traveling north of the<br />
Tugela.<br />
While there are a number of notable developments in the pipeline, individual land owners are battling to attract<br />
investment because of the reasons above. There is an urgent need to develop a high powered presentation and<br />
prospectus which will outline the actions planned by <strong>Zululand</strong> <strong>District</strong> <strong>Municipality</strong> to solve the infrastructural and<br />
information problems so that outside investors would be more confident to consider development in the district.” 5<br />
A number of hindrances to the growth of the tourism sector have been identified, notably:<br />
<br />
<br />
<br />
<br />
Lack of facilities<br />
Lack of private investment<br />
Poor road infrastructure<br />
Lack of coordinated effort in the development of the sector and poor marketing of facilities/destinations<br />
The following critical steps in developing and promoting the sector in the <strong>District</strong> are noted:<br />
<br />
<br />
<br />
<br />
<br />
<br />
Need to market the <strong>District</strong> as a favoured destination<br />
Need for creation of authentic cultural experiences<br />
Need of opening up the Royal Palace to tourists<br />
Need to capacitate and create awareness among the previously disadvantaged communities<br />
Need to co-ordinate efforts of tourism development within the <strong>District</strong><br />
Need to set standards for accreditation and grading to take place<br />
In context of the above, the Siyaphambili Local Economic Development Strategy (2003) proposed some development<br />
strategies which include:<br />
<br />
<br />
<br />
<br />
The development and upgrading of game reserves, dams and nature reserves<br />
The establishment and marketing of arts and craft centres<br />
The need for tourism information tools, e.g. brochures, information offices and signage<br />
Development of festivals and events<br />
A travelers’ centre at Ulundi 19<br />
<br />
<br />
The development of the Emakhosini Valley<br />
The upgrade of roads<br />
It has been noted that a number of developments are in the pipeline or being implemented. Most notably and related<br />
to tourism are the Pongolapoort Dam Proposals as well as the Emakhosini Ophathe Development Proposals.<br />
There are a number of very interesting tourism options that need to be pursued or warrant further investigation in the<br />
district. In addition, there are some critical projects needed to boost tourism development. These include:<br />
5 <strong>Zululand</strong> Tourism Sector Plan: 2006, pg. 20<br />
Date: May 2013<br />
Page 131 of 194
ZULULAND IDP REVIEW 2013/2014<br />
<br />
<br />
<br />
<br />
<br />
<br />
<br />
<br />
<br />
<br />
The uQweqwe area, approximately 25km from Babanango attracts substantial French interest every year<br />
understood to be the site where Prince Glenn Flanagan was captured. The site does not provide any basic<br />
facilities to tourists.<br />
Every year the Zulu Reed Dance is celebrated at Nsibaya/Enyokeni. There are a number of tourism development<br />
options that could be pursued with the annual celebration. Providing tourists with a better understanding of the<br />
Zulu Royal Family is only one of the opportunities presented.<br />
Development funding to the value of about R20 million has been allocated for the further development of the<br />
Emakhosini project, including a new entrance area as well as an amphitheatre. These still require<br />
implementation. The Emakhosini project at present does not provide accommodation facilities to visitors.<br />
The road between Nongoma and Pongola (R66) has to be tarred (only about 27 km) to open up the district to<br />
tourism. It is understood that more than 30 tour buses enter the district at Golela every day that do not spend<br />
time and money in the district.<br />
The linkage between Nongoma and Ulundi via the R66 (Tangami Spa, Swart Umfolozi and Vryheid) should be<br />
improved.<br />
Access road to Ithala Game Reserve, via the Klipwal Mine. The Klipwal Mine (the only Gold Mine in KZN) is only<br />
about 3 km from the northern boundary of the Ithala Reserve.<br />
The R69 (Rooirante Road) between Magudu and the Pongolapoort dam is another very important link road.<br />
The P700 link to Empangeni/Richards Bay.<br />
An important link between Paulpietersburg, Wakkerstroom and Luneburg.<br />
About 20km of untarred road between Nongoma and Vryheid.<br />
Apart from the road priorities listed above, a number of important themes have also been identified:<br />
<br />
<br />
<br />
<br />
<br />
<br />
Heart of the Zulu Kingdom and the Emakhosini project.<br />
Possible Zulu cultural museum at Ondini linked to the P700 development.<br />
Accommodation facilities in the ZDM in the traditional Zulu Cultural style.<br />
The Isibaya/Enyokeni annual reed dance.<br />
The monthly Mona craft and cattle sale (as well as traditional medicine) in Nongoma. This event lasts for 4 days<br />
but there is no market facility available.<br />
Proposals have already been prepared for the Ngome forest development.<br />
All studies done on district level clearly indicated that for <strong>Zululand</strong>, tourism is a key factor. It is one of the two legs on<br />
which development in <strong>Zululand</strong> stand the other being agriculture. The <strong>Zululand</strong> Tourism Office is now comfortably<br />
settled in the Ulundi Airport Centre. Looking ahead at tourism development in the future the Airport complex in<br />
Ulundi is ideal.<br />
Local Tourism Structures are in place and getting these to<br />
run more efficiently remains a main objective. In Ulundi<br />
where a local tourism office has been lacking for some 2<br />
years a post has been created and we trust that Ulundi will<br />
shortly join the other 4 municipalities each having its local<br />
tourism office.<br />
Key Tourism Events in <strong>Zululand</strong> are growing year by year<br />
and these include i.e.<br />
<br />
<br />
<br />
<br />
<br />
Zulu Royal Reed Dance at Enyokeni<br />
Monthly Mona Market outside of Nongoma<br />
Annual Mayfair in Vryheid<br />
Tiger fishing Bonanza on the Pongolapoort Dam<br />
Ithala Canoe Challenge starting at the oBivane Dam<br />
Date: May 2013<br />
Page 132 of 194
ZULULAND IDP REVIEW 2013/2014<br />
<br />
<br />
Annual Innie Rietfees in uPhongolo<br />
The Ulundi – Nongoma Marathon<br />
KwaZulu-Natal has 5 Tourism Gateways entering the province and of these 2 are on the <strong>Zululand</strong> border i.e. Golela<br />
Border Post and the Piet Retief Gateway. Tourism Routes in and into <strong>Zululand</strong> got an important addition when Route<br />
66 (The <strong>Zululand</strong> Heritage Route) was launched. This adds a key third leg to the existing KZN Battlefields Route and<br />
the <strong>Zululand</strong> Birding Route which have been operational for several years. One facet of the Route 66 project that<br />
calls for urgent attention is to get the short stretch of road (some 21 km) between uPhongolo and Nongoma tarred as<br />
soon as possible. Currently this un-tarred portion effectively blocks all tourism bus traffic from entering <strong>Zululand</strong> from<br />
the north, causing the tourism industry to lose out immensely.<br />
5.1.6.1 TOURISM IN ULUNDI<br />
The air over Ulundi is clean and fresh, and only a hint of shimmering heat haze is likely to blur the sharpness of the<br />
horizon as you approach the Valley of the Kings. When approaching uLundi by plane, the Umfolozi River, glinting in<br />
the sunlight as it flows lazily through a wide horseshoe, and the darker hills of the Emakhosini – the legendary Valley<br />
of the Kings – are visible before you. On top of one of the higher hills is the proud Emakhosini memorial, with its long<br />
silver horns reaching skyward.<br />
The aircraft terminal and everything around you seems so ordinary, so<br />
predictable. But this is an illusion and soon after when entering Ulundi<br />
you realise that you have entered a land of contrasts, where the modern<br />
world has met traditional Africa in a delightful mixture the old, the new<br />
and the ageless.<br />
In Ulundi, high-rise, modern government buildings, shops, hotel and<br />
lodges are little more than a stone's throw from traditional Zulu beehive<br />
huts. Zulu women in long traditional dresses and headscarves hoe their<br />
fields near modern suburban homes. Modern, luxury cars share dirt roads<br />
with slowly-plodding Nguni cattle.<br />
Goats and chickens wonder unhindered into modern shops - and nobody<br />
cares in this easy-going Heart of <strong>Zululand</strong>. But these contrasts are to be expected for Ulundi is the gateway to the<br />
Heart of the Zulu Kingdom. It has many modern trappings, but it is also deep within the ancestral land of a nation that<br />
has proudly maintained its traditional way of life.<br />
When you leave the centre of town you are within a few minutes drive from Ulundi's museums, with their wealth of<br />
historical and traditional artefacts, and a good road - the P700 - links you to the Ondini Cultural Reserve, where the<br />
treasured past of <strong>Zululand</strong> has been well preserved. At Ondini, King Cetshwayo's residence has been partially<br />
recreated and well-trained tour guides are on hand to help bring back the era of great Zulu leaders and warriors.<br />
Only 35km from Ulundi - also along the P700 which is newly tarred - is the world-renowned Hluhluwe-Umfolozi Park,<br />
made famous for the invaluable part it has played in saving both the white and black rhino.<br />
The road brings you to the Cengeni gate at the south western entrance to the Umfolozi section of the park. This<br />
section offers you some of the best game viewing in the park and is also known for its wilderness trails. You can<br />
explore the area on your own - it is perfectly safe, and the people are warm and welcome- but you will miss a lot<br />
without a good tour guide to identify wildlife and point out places of interest.<br />
Date: May 2013<br />
Page 133 of 194
ZULULAND IDP REVIEW 2013/2014<br />
At Ondini you will find the headquarters of AMAFA, the heritage organization for KwaZulu-Natal, and it has a number<br />
of trained guides who will make your visit an enjoyable learning experience. When you visit Ondini you can stay in<br />
Zulu beehive hut, and enjoy the traditional food and hospitality offered by the Umuzi, or homestead. The Umuzi is run<br />
by Tinta Safaris. Its owner Rex Duke offers fully-escorted excursions around the area. Cultural, historical and other<br />
excursions are also offered by Wilfred Mcunu from the Mthonjaneni Lodge.<br />
Ulundi is the ideal springboard for exploring the <strong>Zululand</strong> <strong>District</strong>. The town has banking and shopping facilities a<br />
Garden Court, luxury and themed lodges and a variety of bed and breakfast owned by locals who will all go out of<br />
their way to link you to guides and outfits offering escorted tours. The new down town shopping mall is worth a visit.<br />
Most accommodation facilities will provide transport and tours and there are a couple who have resident historians<br />
and cultural/wildlife guides to take you on guided excursions in <strong>Zululand</strong> and beyond to well known battlefields like<br />
Ulundi, Isandlwana and Rorke's Drift.<br />
The Umuzi, a traditional Zulu lodge is inside the Ondini Cultural Reserve and fully escorted tours are offered from this<br />
base by Tinta Safaris. Mlungisi (Percy) Nzuza, the owner of Nongoma Lodge, will gladly collect guests from the Ulundi<br />
Airport and take you around the Ulundi area before moving on to the Royal City of Nongoma.<br />
5.1.6.2 TOURISM IN UPHONGOLO<br />
There is a lake the far north eastern corner of <strong>Zululand</strong> where<br />
the water stretches across 34 kilometres AND it is the only<br />
major dam in South Africa where you find the ferocious<br />
fighting tiger fish. Pongolapoort Dam, also known as Lake<br />
Jozini, lies at Golela some 34 km from the town of Pongola -<br />
the northern gateway into KwaZulu-Natal for Johannesburg<br />
and Swaziland. Most international visitors come through the<br />
Golela Border Post from Swaziland into KZN. Pongola is the<br />
junction where travelers refresh and refuel before moving on<br />
to the World Heritage Site of Greater Lake St Lucia Park, the<br />
coral reefs of Sodwana and Mozambique. There is a small<br />
airport at Pongola, an airport at Mkuze and a private airstrip<br />
at KwaZulu Private Game Reserve, at the Dam.<br />
The uPhongolo area is one of the best kept secrets in South Africa, it's not an idle claim. There are two very special<br />
attractions at Pongolapoort Dam; the opportunity to catch tiger fish and the only houseboats in South Africa.<br />
Shayamoya Tiger Fishing and Game Lodge also offer breathtaking views over Pongola Game Reserve, the lake and the<br />
mountains. The warm and welcoming atmosphere goes hand in hand with plenty of guided activities like game drives,<br />
boat cruises, elephant monitoring, horse riding, canoeing, mountain biking, rhino tracking and of course tiger fishing.<br />
uPhongolo is also the place to be at close of day for a very practical reason. It has an unparalleled selection of first<br />
class game camps and lodges in which to spend the night. Around Pongolapoort Dam there are 10 lodges in the<br />
Pongola Game Reserve which has four of the Big five. Although it has no lions, it does have more than 70 elephants,<br />
as well as rhino, buffalo, leopard, cheetah, hyena, giraffe, zebra and many kinds of antelope. The lake and its nearby<br />
game reserves are among the most important assets of Pongola's growing tourism trade.<br />
Leaving Pongola two options exist, going west on the N2 towards Piet Retief, the route takes you through the rural<br />
area of Simdlangentsha with its tribal settlements, community halls, some very unique schools and the Klipwal Mine,<br />
Page 134 of 194<br />
Date: May 2013
ZULULAND IDP REVIEW 2013/2014<br />
the only gold mine in KZN. The Itshelejuba Hospital on the route is worth a visit. The other option turns south onto<br />
Route 66 (R66) towards Nongoma, in the heart of <strong>Zululand</strong>, or on to the R69 to Vryheid. On the R66 you will find<br />
unique attractions and facilities. The Pakamisa Private Game Reserve (with its Austrian flavour), Magudu Hotel, The<br />
Omoyeni Lodge on the Magudu Mountain Range each have a unique theme. Game farms further on Route 66 include<br />
the Amakhosi Lodge (with the Big five) the Mkuze Falls Private Game Reserve (Five star grading overlooking the Mkuze<br />
River Falls) and some 10 smaller game farms and facilities.<br />
On the road to Vryheid (R69) the game experience culminates in two reserves. The Ithala Game Reserve (just outside<br />
Louwsburg) with its beautifully situated Ntshondwe Camp is run by Ezemvelo KZN Wildlife and is one of its kind<br />
because of the diversity of habitats running from high Highveld to low Lowveld at the Pongolo River. The turn off from<br />
the R69 to the Bivane with its Caravan Park chalets offers you an experience from fishing to hiking, boating and<br />
birding, canoeing or cycling.<br />
5.1.6.3 TOURISM IN NONGOMA<br />
Nongoma is the royal City of <strong>Zululand</strong>. It is the home of King Goodwill Zwelethini, the hereditary leader of the nation<br />
and his royal palaces are among the main tourist attractions in Nongoma. The royal family is highly respected and has<br />
a dominating presence in this rural and very traditional part of <strong>Zululand</strong>.<br />
Tours are organized to royal palaces, to the local schools and to some of<br />
the natural attractions such as the indigenous Ngome ForestZulu dancing is<br />
also organized for visitors to the area. Tradition reaches fever pitch at the<br />
traditional Mona Market, which is held in the third week of every month.<br />
The market attracts thousands of people from all over KwaZulu-Natal.<br />
They bring a fascinating variety of wares from fruit and vegetables to<br />
beadwork and beer pots, and cattle on the hoof - to the open market on<br />
the outskirts of the town. The market is a hive of activity, with people<br />
buying, selling and bartering to meet their most pressing needs.<br />
But the event that most captures the imagination is the annual Royal Reed Dance Festival, Umkhosi woMhlanga. The<br />
Reed Dance Festival is held at the king's royal residence, Kwa-Nyokeni Palace, and is attended by thousands of people<br />
from all over the world. The festival takes its name from the riverbed reeds and the symbolic part they play in the four<br />
day event. The reeds are carried by more than 25000 maidens who have been invited to the king's palace to take part<br />
in the traditional ceremony, which celebrates their virginity and their preparation for womanhood.<br />
The maidens come from all parts of <strong>Zululand</strong> and have been joined in recent years by groups of girls from Swaziland<br />
and as far afield as Botswana and Pondoland.<br />
5.1.6.4 TOURISM IN VRYHEID/ABAQULUSI<br />
There is something enchanting about Vryheid, a friendly agricultural town with many historical buildings and sites, and<br />
the surrounding district is rich in natural attractions and wildlife conservation areas, of which the Ithala Game Reserve<br />
is the finest example.<br />
The northern area has the Hlobane Mountain that was used by the Zulus as a fortress during their war against the<br />
British. Hlobane's rich coal seams have been mined for more than 100 years. The Vryheid Hill Nature Reserve is on<br />
the edge of town and offers excellent bird watching opportunities in a beautiful conservation area. The reserve<br />
Page 135 of 194<br />
Date: May 2013
ZULULAND IDP REVIEW 2013/2014<br />
includes grasslands, rocky slopes, forest and mixed woodland, and is able to support a wide variety of animal, bird and<br />
plant species.<br />
Animal life in the reserve includes grey duiker, mountain reedbuck, oribi, eland, Burchell's zebra and blesbok. But<br />
pride of place in the reserve goes to a pair of crowned eagles who nest in a Cape ash tree in the forest overlooking the<br />
town. The reserve also includes the Ntinginono Eco Centre. Ntinginono focuses on environmental education for school<br />
groups and can seat 100 people in the main hall. The tented camp has accommodation for 60. Many private land<br />
owners offer hunting and game viewing with accommodation ranging from rustic to very upmarket. Vryheid has<br />
grown as a conference and event centre and delegates can combine their Safari experience with a visit to one of the<br />
natural mineral spa resorts in the area.<br />
In the southern areas is the Klipfontein Bird Sanctuary which includes a large wetland and provides a safe refuge for<br />
many rare and secretive wild water-birds. The sanctuary has a small hide overlooking a pan, allowing for great views<br />
of 10 duck species, African Rail, Red-chested Flufftail, and Black and Baillon's Crakes. The pan's reedbeds also attract a<br />
number of warbler, weaver, and widowbird and whydah species. Pairs of Grey Crowned Crane and African Fish Eagle<br />
also breed in the sanctuary<br />
In the eastern areas are two special nature/wildlife areas, Ngome Forest and Ntendeka Wilderness as well as Ithala<br />
Game Reserve. The reserve is linked to the town by a good tarred road and also has a landing strip.<br />
Ithala's main camp is at Ntshondwe and there are secluded bush lodges, camping facilities and a luxurious lodge that<br />
sleeps six. The camp's fully-equipped conference centre can seat up to 90 people. Ithala has four of the Big Five<br />
animals: elephant, rhino - both black and white - buffalo and leopard. It also has many species of antelope, including<br />
the only tsessebe in KwaZulu-Natal. Ithala has 315 species of bird.<br />
In the western parts of the area is the Blood River Vlei with its 5 000ha of wetland, known for its many and diverse<br />
waterbirds. Nearby is the Ncome Blood River heritage site where a major confrontation took place between the<br />
Voortrekkers and AmaZulu on 16 December 1838. One really experiences both sides of this historic battle. Vryheid<br />
was founded in 1884 when Voortrekker settlers were granted a large area of land by the Zulu King Dinizulu. The<br />
Voortrekkers proclaimed the land as the Nieuwe Republiek, with Vryheid as its capital and Lucas Meijer as its<br />
president.<br />
The republic's parliament building, the raadsaal, and the town jail are well-preserved relics of that time. Lucas Meijer's<br />
home is now a museum. The town is the largest in the <strong>Zululand</strong> <strong>District</strong> and offers the widest variety of<br />
accommodation. Tours are offered by Villa Prince Imperial.<br />
5.1.6.5 TOURISM IN PAULPIETERSBURG/EDUMBE<br />
Paulpietersburg is said to be the healthiest town in South Africa, because of its excellent climate and the naturally high<br />
quality of its water which has attracted two spring-water bottling plants to the area.<br />
The town, which lies at the base of eDumbe Mountain, has a distinctly German character. The German influence dates<br />
back to the 19th century, when Lutheran missionaries and colonists founded settlements at Luneburg, Braunschweig<br />
and Augsburg near the town. German tourists enjoy visiting the area nowadays, taking delight in the local inhabitant's<br />
quaint mixtures of 19th century and modern custom. Luneburg is known for its excellent German butchery.<br />
One of the best known attractions in the area is the Natal Spa resort and conference centre with its nine hot and cold<br />
mineral water pools. The invigorationg and healing qualities of hot mineral water are well documented. It boasts<br />
"triple waters" which means they contain carbonates, chlorides and sulphates and the temperature at source is 40℃<br />
as well as a "Support Tube". Today, it has a super tube and makes for an experience of top quality.<br />
Page 136 of 194<br />
Date: May 2013
ZULULAND IDP REVIEW 2013/2014<br />
Paulpietersburg has the largest collection of grass orchids in South<br />
Africa. These bloom in December and Photographic and nature tours<br />
are run.<br />
Paulpietersburg's information office is in the Drostdy building on the<br />
main road into town. The Drostdy also has a tea garden and a<br />
museum, and good-quality local crafts are on sale. The information<br />
office can organize a hour-long walkabout through the town, taking in<br />
some of the fine old sandstone homes and other historical buildings.<br />
The office can also arrange tours to an authentic Zulu kraal, where<br />
visitors can meet the local people in their homes, or to the Valpre<br />
Bottling Plant to check out that highly-rated spring water.<br />
Paulpietersburg draws many visitors because of the excellent conditions for paragliding. The DUMBE MOUNTAIN OF<br />
WONDERS is highly rated by paragliders. A walking trail through exotic flora with a magnificent view of the<br />
countryside and surrounding mountains has been established. On a clear day you can see Jozini Town from Dumbe<br />
Mountain. The name of the mountain was derived from the amadumbe, a tuberous edible plant which grows on the<br />
mountain and resembles a potato. The mountain is accessible by two wheel drive vehicles.<br />
5.1.7 MANUFACTURING (INDUSTRIAL)<br />
Manufacturing activity within the <strong>District</strong> is low, at an estimated 11% contribution to the GGP for the area. The only<br />
agri-processing of note in the <strong>District</strong> is the Illovo sugar mill in the uPhongola <strong>Municipality</strong>. Despite the lack of large<br />
scale manufacturing in the <strong>District</strong> a number of interesting ventures have been, or are in the process of being,<br />
established. These activities generally relate to the raw materials and skills available in the <strong>District</strong>. The ventures<br />
include (1) arts and crafts production and marketing, (2) taxidermy, (3) mineral water and (4) charcoal manufacturing<br />
for export.<br />
Some of the opportunities that are presented by this sector include:<br />
<br />
<br />
<br />
<br />
Opportunities generally promoted in the region in terms of agri-processing include traditional medicines, venison<br />
production for export, leather production as well as vegetable and fruit processing. The diversification of<br />
agricultural production in the <strong>District</strong> will lead to further potential for agri-processing.<br />
Opportunities exist for the diversification of the products of the district and the improvement of marketing<br />
systems that will open up new local, national and international markets. Other markets for arts and crafts<br />
include curio shops in national parks, curio shops in private game reserves, arts and craft centres in the <strong>District</strong>, as<br />
well as established marketing agents focusing on the national and international markets.<br />
Opportunities relating to timber product manufacturing should continue to be investigated. Timber construction<br />
relating to specifically the tourism industry may present opportunities for local contractors in future.<br />
Development of clothing and textile as well as building materials sector in the <strong>District</strong>.<br />
5.1.8 RETAIL AND SERVICES<br />
The commercial sector is well established in the towns of the <strong>District</strong>. However, it is not easily accessible for the<br />
majority of the rural population that currently account for 75% of the district population. A number of potential<br />
Date: May 2013<br />
Page 137 of 194
ZULULAND IDP REVIEW 2013/2014<br />
commercial markets exist. The lack of business support services will, however, limit entry of emerging entrepreneurs<br />
into these markets. Some of the opportunities that are presented in this sector include:<br />
<br />
<br />
Developing the commercial sector in the Rural Services Centres that are being developed in the <strong>District</strong> and to<br />
utilise the supporting infrastructure of these Rural Services Centres such as taxi ranks to tap into the markets that<br />
these draw.<br />
Commercial enterprises focused on tourism market through sale of locally produced goods, the restaurant<br />
industry, travel agencies/services and others.<br />
5.1.9 MINING<br />
Mining activities in the district have decreased in the mid 1990’s mainly due to closure of mines as a result of open<br />
market in coal mining and agriculture. Opportunities still exist for small scale mining. These opportunities include:<br />
<br />
<br />
<br />
<br />
Mine rehabilitation<br />
Engineering support<br />
Equipment maintenance and support<br />
Preparing Environmental Management Plans<br />
5.1.10 CONSTRUCTION<br />
The sector has experienced growth in recent years. Some of the major recent and current construction activities in<br />
the <strong>District</strong> would include:<br />
<br />
<br />
<br />
<br />
<br />
<br />
The general residential market.<br />
Major infrastructure construction, e.g. the Paris Dam, major roads such as the P700 and other strategic linkages.<br />
The building of lodges and tourism facilities, e.g. lodges to be built at Emakhosini, in areas surrounding the<br />
Pongolapoort Dam and on private game farms.<br />
The provision of basic services to the previously disadvantaged urban and rural communities within the <strong>District</strong><br />
municipality.<br />
The provision of low income housing to the urban and rural communities of the <strong>District</strong>.<br />
Building of municipal and public sector buildings, e.g. the offices of the <strong>District</strong> <strong>Municipality</strong>.<br />
5.1.11 TRANSPORTATION<br />
In the transport industry in the <strong>Zululand</strong> <strong>District</strong> <strong>Municipality</strong> distinction can be made between various sub-sectors,<br />
viz. road freight transport, public road transport, (dominated by the taxi industry) air transport and rail freight<br />
transport. In terms of the “informal” sector stakeholders also identify the so-called “bakkie” industry responsible for<br />
the transport of goods from distributors/wholesalers to a range of retailers located in the rural areas. Some of the<br />
opportunities that are presented in this sector include:<br />
<br />
Rural road maintenance and upgrading of rural roads which will continue to establish better linkages between<br />
settlements, rural nodes and municipal centres, thus increasing access to economic opportunities whilst<br />
increasing access to job opportunities.<br />
The proposed petrol filling station and information centre (Ulundi “19”) is viewed as a lead project impacting on<br />
both the transport and tourism sector in the <strong>District</strong>. This strategically located development will increase the<br />
attractiveness of this alternative route between Gauteng and the KwaZulu-Natal coast. It will also provide an<br />
opportunity for informing people passing through the area of the attractions which the area has to offer.<br />
Page 138 of 194<br />
Date: May 2013
ZULULAND IDP REVIEW 2013/2014<br />
<br />
The need for establishing a stop-over point for trucks in the Vryheid area has been identified in various planning<br />
studies.<br />
5.1.12 LOCAL ECONOMIC DEVELOPMENT INITIATIVES<br />
The Local Economic Development Unit is within the Community Services Department. The fundamental focus of this<br />
unit is promoting the Social and Economic Development of the <strong>Municipality</strong> by implementing the Siyaphambili<br />
programme which is a strategic document for economic development in the <strong>Municipality</strong>.<br />
The Local Economic Development Forum forms part of the overarching institutional structure of the IDP Process.<br />
Apart from sharing information on future economic activities, the purpose of the forum is to jointly agree on a<br />
direction, and seek guidance from all stakeholders and experts in the field of economic development in the district.<br />
Sub-Forums under the Local Economic Development Forum include Tourism and the recently established General<br />
Business and Agricultural Forums.<br />
Achievements of the LED Unit include the following:<br />
o Ukuzakha Nokuzenzela Program: This programme was established to assist the pro-poor communities within the<br />
<strong>District</strong>. ZDM is assisting the organized groups through ward Councillors. There are five tractors that are ploughing<br />
the fields for the communities and seeds are given.<br />
o<br />
o<br />
The following projects are under implementation with the partnership from COGTA:<br />
Laundromat Centre<br />
Informal Traders Facilities within Nongoma Town<br />
Mona Market Regularization<br />
o Fencing the entire market<br />
o Construction of informal traders facilities<br />
o Fencing the entire market<br />
<br />
<br />
<br />
<br />
Ulundi Tourism Hub including the following<br />
o Construction of New Office Block<br />
o Restaurant<br />
o Kitchen<br />
o Toilet Block, and External works<br />
Ulundi Integrated Energy Centre<br />
o Sasol Filling Station<br />
o Bakery<br />
o Community Library<br />
o Internet Café<br />
Hydrophonics<br />
P700 Nodal Development<br />
o Servicing twenty nine (29) commercial sites i.e. sewer reticulation, water and electrification<br />
The following Business Plans were completed, ZDM is looking for potential investors/partners for their<br />
implementation:<br />
Cengeni Gate Community Tourism Project<br />
Cengeni Gate Community Tourism Project<br />
Phongola Private Public Partnership<br />
Nongoma Poultry Project<br />
Louwsberg Agro-processing Initiative<br />
Aloe processing facility and<br />
<strong>District</strong> Nursery<br />
Date: May 2013<br />
Page 139 of 194
ZULULAND IDP REVIEW 2013/2014<br />
5.1.13 MUNICIPAL COMPARATIVE AND COMPETITIVE ADVANTAGES<br />
Main railway line from Gauteng to Richards Bay, traverses the Municipal Area;<br />
Large areas of rich Biodiversity, including a siginificant number of nature reserves;<br />
Rich Cultural Heritage and Historical Sites;<br />
Main Provincial Road traverses the <strong>Municipality</strong> from Richards Bay to Vryheid to Mpumalanga and/or Gauteng;<br />
Large labour force in close proximity to major towns;<br />
Headquarters of the Zulu monarch;<br />
P700 Development Corridor;<br />
Ulundi Regional Airport; and<br />
Two large dams, namely Pongolapoort Dam and Bivane Dam.<br />
<br />
5.1.14 LOCAL ECONOMIC DEVELOPMENT SWOT ANALYSIS<br />
5.1.14.1 STRENGTHS/OPPORTUNITIES<br />
<br />
<br />
<br />
<br />
<br />
<br />
<br />
<br />
<br />
<br />
It is evident that the district’s largest contributors to GVA are not necessarily the fastest growth sectors.<br />
A number of tourism developments are in the pipeline or being implemented, notably the Pongolapoort Dam<br />
Proposals as well as the Emakhosini Ophathe Development Proposals.<br />
The commercial sector is well established in the towns of the <strong>District</strong>.<br />
Opportunities generally promoted in the region in terms of agri-processing include traditional medicines, venison<br />
production for export, leather production as well as vegetable and fruit processing. The diversification of<br />
agricultural production in the <strong>District</strong> will lead to further potential for agri-processing.<br />
The diversification of the products of the district and the improvement of marketing systems that will open up<br />
new local, national and international markets.<br />
Opportunities relating to timber product manufacturing should continue to be investigated. Timber construction<br />
relating to specifically the tourism industry may present opportunities for local contractors in future.<br />
Opportunities exist for the development of clothing and textile as well as building materials sector in the <strong>District</strong>.<br />
Rural road maintenance and upgrading of rural roads which will continue to establish better linkages between<br />
settlements, rural nodes and municipal centres, thus increasing access to economic opportunities whilst<br />
increasing access to job opportunities.<br />
The proposed petrol filling station and information centre (Ulundi “19”) is viewed as a lead project impacting on<br />
both the transport and tourism sector in the <strong>District</strong>. This strategically located development will increase the<br />
attractiveness of this alternative route between Gauteng and the KwaZulu-Natal coast. It will also provide an<br />
opportunity for informing people passing through the area of the attractions which the area has to offer.<br />
Opportunities still exist for small scale mining relating to mine rehabilitation as well as equipment maintenance<br />
and support.<br />
5.1.14.2 THREATS/WEAKNESSES<br />
<br />
<br />
<br />
<br />
<br />
<br />
<strong>Zululand</strong> is ranked lower for economic output for the province than it is for total population indicating that the<br />
GVA per capita within <strong>Zululand</strong> is comparatively low in the provincial context.<br />
Abaqulusi and Ulundi municipalities contribute the majority of economic output for the district, between them<br />
contributing almost 63% being indicative of an economy that is not diversified throughout the district.<br />
Nongoma, which has the second highest population of all the <strong>Zululand</strong> municipalities, only contributes 13.6% to<br />
economic output.<br />
Only 31.1% of the working age population are engaged in actual employment or are actively seeking work.<br />
Unemployment in <strong>Zululand</strong> is unsustainably high and is having the negatively impact of discouraging people from<br />
spending the time and money to actively search for jobs.<br />
Employment has increased by just over 13,000 people between 2003 and 2009. This is insufficient in the light of<br />
population growth of over 106,000 in the same period.<br />
Date: May 2013<br />
Page 140 of 194
ZULULAND IDP REVIEW 2013/2014<br />
<br />
<br />
<br />
<br />
<strong>Zululand</strong> DM has very high dependency ratios. The dependency ratio can be interpreted as a crude measure of<br />
poverty.<br />
Uncertainty relating to the roll-out or implementation of the Land Reform programme has impacted negatively on<br />
agricultural development and growth.<br />
The commercial sector is not easily accessible for the majority of the rural population that currently account for<br />
75% of the district population.<br />
Manufacturing activity within the <strong>District</strong> is low, at an estimated 11% contribution to the GGP for the area.<br />
5.1.15 LOCAL ECONOMIC DEVELOPMENT KEY ISSUES AND EXISTING STRATEGIES<br />
Table 64: Key Issues and Existing Strategies<br />
No. Key Challenge Existing Strategies<br />
2<br />
3<br />
1<br />
4<br />
5<br />
Limited funding to implement LED<br />
Programmes<br />
Lack of coordinated efforts to<br />
implement LED<br />
Improve internal capacity, skills<br />
development and optimise stakeholder<br />
participation.<br />
Promote sustainable community-based<br />
entrepreneurship and investment and<br />
market the district to attract<br />
investments.<br />
Expand production and promote<br />
beneficiation in agriculture, tourism and<br />
manufacturing sectors.<br />
6 Local business support.<br />
7<br />
Provision of strategic infrastructure<br />
development<br />
Development of Business Plans<br />
Review of LED Plans<br />
Internal funding (although its often too little)<br />
External sourcing of funding<br />
Integration of IDP and LED Forum<br />
Local Tourism forums<br />
Establishment of Business Chambers<br />
Establishment of general business and agricultural forum<br />
Establishment of Informal Traders Chamber<br />
Training municipal staff in supporting tourists and promoting<br />
various products<br />
Standing support to all LMs by <strong>District</strong> office<br />
Invite all relevant stakeholders to LED, business and<br />
agricultural Forums<br />
Training of SMMEs<br />
Inter linked <strong>Zululand</strong> tourism website<br />
Established tourism offices in all LMs and the <strong>District</strong><br />
Small contractor incubator programme<br />
Development of SMME Development Plan<br />
Formalisation of SMMEs and Co-operatives<br />
Implementation of Ukuzakha Nokuzenzela Programme<br />
Implementation of Community Works Programme (CWP)<br />
Hold Business Breakfasts Seminars<br />
Agricultural points identified in the SDFs<br />
Mining Sector plan currently underway<br />
Promotion of diversification of agricultural production will lead<br />
to further potential for agri-processing<br />
Agri-processing feasibility study<br />
Public Private Partnership established on different levels<br />
Procurement policies giving preferences to local businesses<br />
EPWP Labour intensive<br />
Airports upgrade<br />
Small Town Rehabilitation Programme<br />
Extension of Taxi Ranks<br />
Date: May 2013<br />
Page 141 of 194
ZULULAND IDP REVIEW 2013/2014<br />
No. Key Challenge Existing Strategies<br />
Establishment of Market Stalls<br />
Establishment of Shopping Centres<br />
Establishment of Filling Stations<br />
Development of By-pass roads and Trucks one stop shops<br />
Tourism link road (P700)<br />
8 High rate of unemployment<br />
CWP<br />
EPWP<br />
Agriculture<br />
Rural road maintenance programme<br />
Reopening of mines<br />
9 High rate of Poverty<br />
Ukuzakha nokuzenzela programme<br />
Promotion of one home one garden projects<br />
All wards have War Rooms (Sukuma Sakhe)<br />
10 High incidence of HIV/AIDS<br />
HIV/AIDS <strong>District</strong> and Local labour forum<br />
HIV/AIDS awareness campaigns<br />
HIV/AIDS combating groups<br />
11 High rate of child headed households Special groups development plan underway<br />
5.2 SOCIAL DEVELOPMENT ANALYSIS<br />
5.2.1 EDUCATION<br />
Backlog determination for education purposes is informed by the following:<br />
<br />
The Department of Education applied a travelling distance of 7 km to the nearest school<br />
The teacher: learner ratio is acceptable at 35<br />
<br />
Schools, particularly secondary schools, which have less than 250 learners, are considered less viable as they are<br />
restricted in terms of teacher allocations and therefore limited subject choices are available to the learners.<br />
A backlog analysis (households at a distance further that 5km from a primary school were considered to be a backlog<br />
and every 3500 people constituting the need for a another primary school) was undertaken that indicates the backlog<br />
as per the following table and the mapping at overleaf indicates the distribution of primary schools as well as the<br />
backlog mapping with regard to access to primary schools.<br />
Table 65: Primary Schools in the <strong>District</strong> Primary Schools<br />
Local <strong>Municipality</strong> Required Existing<br />
Abaqulusi <strong>Municipality</strong> 25 104<br />
eDumbe <strong>Municipality</strong> 10 71<br />
Nongoma <strong>Municipality</strong> 33 98<br />
Ulundi <strong>Municipality</strong> 27 158<br />
uPhongolo <strong>Municipality</strong> 15 101<br />
Source: ZDM IDP 2012/2017<br />
Table 66: Access to Primary Schools<br />
0 - 2.5km<br />
Date: May 2013<br />
Page 142 of 194
ZULULAND IDP REVIEW 2013/2014<br />
Local <strong>Municipality</strong> Households Population Percentage<br />
Abaqulusi <strong>Municipality</strong> 23231 157111 64%<br />
eDumbe <strong>Municipality</strong> 9808 66332 65%<br />
Nongoma <strong>Municipality</strong> 16908 114349 50%<br />
Ulundi <strong>Municipality</strong> 21081 142571 60%<br />
uPhongolo <strong>Municipality</strong> 15185 102696 66%<br />
2.5km - 5km<br />
Local <strong>Municipality</strong> Households Population Percentage<br />
Abaqulusi <strong>Municipality</strong> 9064 61300 25%<br />
eDumbe <strong>Municipality</strong> 3493 23623 23%<br />
Nongoma <strong>Municipality</strong> 10264 69415 30%<br />
Ulundi <strong>Municipality</strong> 9792 66223 28%<br />
uPhongolo <strong>Municipality</strong> 4965 33578 22%<br />
> 5km<br />
Local <strong>Municipality</strong> Households Population Percentage<br />
Abaqulusi <strong>Municipality</strong> 3730 25226 10%<br />
eDumbe <strong>Municipality</strong> 1896 12823 12%<br />
Nongoma <strong>Municipality</strong> 6874 46489 20%<br />
Ulundi <strong>Municipality</strong> 4439 30021 13%<br />
uPhongolo <strong>Municipality</strong> 2797 18916 12%<br />
Source: ZDM IDP 2012/2017<br />
With regard to secondary schools the following information is reported with regard to the number of facilities<br />
(existing) and the required (additional) number of facilities:<br />
Table 67: Secondary Schools<br />
Local <strong>Municipality</strong> Required Existing<br />
Abaqulusi <strong>Municipality</strong> 7 45<br />
eDumbe <strong>Municipality</strong> 3 27<br />
Nongoma <strong>Municipality</strong> 12 49<br />
Ulundi <strong>Municipality</strong> 7 66<br />
uPhongolo <strong>Municipality</strong> 5 42<br />
Source: ZDM IDP 2012/2017<br />
A backlog analysis (households at a distance further that 5km from a secondary school were considered to be a<br />
backlog and every 8000 people constituting the need for a another secondary school) was undertaken that indicate<br />
the backlog as per the following table above. The table hereunder indicates the distribution of secondary schools as<br />
well as the backlog mapping with regard to access to secondary schools:<br />
Table 68: Access to Secondary Schools<br />
0 - 2.5km<br />
Local <strong>Municipality</strong> Households Population Percentage<br />
Abaqulusi <strong>Municipality</strong> 20157 136322 56%<br />
eDumbe <strong>Municipality</strong> 8058 54496 53%<br />
Nongoma <strong>Municipality</strong> 10509 71072 31%<br />
Ulundi <strong>Municipality</strong> 13938 94263 39%<br />
uPhongolo <strong>Municipality</strong> 10818 73162 47%<br />
2.5km - 5km<br />
Date: May 2013<br />
Page 143 of 194
ZULULAND IDP REVIEW 2013/2014<br />
0 - 2.5km<br />
Local <strong>Municipality</strong> Households Population Percentage<br />
Local <strong>Municipality</strong> Households Population Percentage<br />
Abaqulusi <strong>Municipality</strong> 7124 48180 20%<br />
eDumbe <strong>Municipality</strong> 3863 26125 25%<br />
Nongoma <strong>Municipality</strong> 9804 66304 29%<br />
Ulundi <strong>Municipality</strong> 13169 89062 37%<br />
uPhongolo <strong>Municipality</strong> 5877 39746 26%<br />
> 5km<br />
Local <strong>Municipality</strong> Households Population Percentage<br />
Abaqulusi <strong>Municipality</strong> 8744 59136 24%<br />
eDumbe <strong>Municipality</strong> 3276 22156 22%<br />
Nongoma <strong>Municipality</strong> 13733 92876 40%<br />
Ulundi <strong>Municipality</strong> 8205 55490 23%<br />
uPhongolo <strong>Municipality</strong> 6252 42282 27%<br />
Source: ZDM IDP 2012/2017<br />
Date: May 2013<br />
Page 144 of 194
ZULULAND IDP REVIEW 2013/2014<br />
Map 36: Distribution of Primary Schools<br />
Date: May 2013<br />
Page 145 of 194
ZULULAND IDP REVIEW 2013/2014<br />
Map 37: Access to Primary Schools<br />
Date: May 2013<br />
Page 146 of 194
ZULULAND IDP REVIEW 2013/2014<br />
Map 38: Distribution of Secondary Schools<br />
Date: May 2013<br />
Page 147 of 194
ZULULAND IDP REVIEW 2013/2014<br />
Map 39: Access to Secondary Schools<br />
Date: May 2013<br />
Page 148 of 194
ZULULAND IDP REVIEW 2013/2014<br />
Regarding school attendance, the following information is forthcoming form the 2011 census and discussed in more<br />
details, i.e.:<br />
o<br />
o<br />
o<br />
School Attendance<br />
Highest Educational Qualification<br />
Distribution of Attendance at Educational Facilities<br />
The following series of tables and figures provide more information in respect of the above.<br />
Table 69: School Attendance (5-24 years)<br />
School<br />
Attendance<br />
Attending<br />
Not<br />
Attending<br />
1996 248 305 96 091<br />
2001 308 049 95 366<br />
2011 289 548 79 699<br />
Source: Census 2011<br />
There has been a decline in the number of<br />
persons attending school in the district<br />
although the decline is also observed<br />
regarding the number of persons not<br />
attending school between the 3 census years.<br />
Figure 31: School Attendance (5-24 years)<br />
350 000<br />
300 000<br />
250 000<br />
200 000<br />
150 000<br />
100 000<br />
1996<br />
2001<br />
2011<br />
50 000<br />
0<br />
Attending<br />
Not Attending<br />
Source: Census 2011<br />
Table 70: Highest Educational Qualification<br />
Education level Number<br />
No schooling 81 939<br />
Some primary 237 867<br />
Completed primary 39 386<br />
Some secondary 186 587<br />
Grade 12/Std 10 115 438<br />
Higher 20 954<br />
Unspecified 543<br />
Not applicable 120 861<br />
Source: Census 2011<br />
The census data provided indicates that there is still a<br />
very high incidence of no schooling in the district and a<br />
very low incidence of completed higher or tertiary<br />
education.<br />
Date: May 2013<br />
Page 149 of 194
ZULULAND IDP REVIEW 2013/2014<br />
Figure 32: Highest Educational Qualification<br />
Not applicable<br />
Unspecified<br />
Higher<br />
Grade 12/Std 10<br />
Some secondary<br />
Completed primary<br />
Some primary<br />
No schooling<br />
0 50 000 100 000 150 000 200 000 250 000<br />
Source: Census 2011<br />
The highest educational level of persons aged over 20 years for the 1996, 2001 and 2011 census years is outlined<br />
below:<br />
Table 71: Education Level of Population aged 20+ years in 1996, 2001, 2011<br />
<strong>Zululand</strong> 1996 2001 2011<br />
No schooling 103 135 133 014 72 725<br />
Some primary 59 152 59 954 61 658<br />
Complete primary 17 993 17 081 16 687<br />
Some secondary 68 142 73 671 102 554<br />
Std 10/Grade 12 30 834 45 205 104 340<br />
Higher 8 586 15 267 20 150<br />
Source: Census 2011<br />
The information presented shows that<br />
fewer people have no schooling and that<br />
there has been a 20% increase since<br />
2001 in the number of persons with a<br />
higher education.<br />
Figure 33: Education Level of Population aged 20+ years in 1996, 2001 and 2011<br />
140 000<br />
120 000<br />
100 000<br />
80 000<br />
60 000<br />
40 000<br />
20 000<br />
1996<br />
2001<br />
2011<br />
0<br />
Source: Census 2011<br />
Map 40: % of persons older than 20 yrs, with no education<br />
Date: May 2013<br />
Page 150 of 194
ZULULAND IDP REVIEW 2013/2014<br />
Some 25.1% of perons older than 20 years of age residing mainly in the central and eastern parts of the Municipal<br />
Area (coinciding with the Ingonyama Trust Areas) indicated, in 2011, that they had no education. There are, however,<br />
large parts in the Nongoma LM which are not as affected as other Ingonyama Trust areas.<br />
Table 72: Distribution of Attendance by Educational Institution<br />
Education institution<br />
Pre-school including day care, crèche, Grade R and Pre-Grade R in an ECD centre 964<br />
Ordinary school including Grade R learners who attend a formal school; Grade 1-12<br />
learners & learners in special class<br />
Special school 864<br />
Number<br />
283 603<br />
Further Education and Training College FET 5 177<br />
Other College 1 768<br />
Higher Educational Institution University/University of Technology 12 988<br />
Adult Basic Education and Training Centre ABET Centre 11 990<br />
Literacy classes e.g. Kha Ri Gude; SANLI 2 914<br />
Home based education/ home schooling 1 270<br />
Not applicable 482 036<br />
Date: May 2013<br />
Page 151 of 194
ZULULAND IDP REVIEW 2013/2014<br />
Source: Census 2011<br />
The above table indicates that there is a very low number of children that attend pre-school, grade R or other school<br />
readiness programmes. There are also very low levels of attendance of special schools, FET type education facilities<br />
that could be as a result of the lack of access to such facilities in the district.<br />
5.2.2 HEALTH<br />
The Department of Health provides a range of health facilities to the communities as outlined in the table hereunder.<br />
Table 73: Department of Health Standards and Facilities<br />
Population Recommended Facility Estimated Attendees (per month)<br />
Scattered
ZULULAND IDP REVIEW 2013/2014<br />
Table 75: Hospitals in the ZDM<br />
Local <strong>Municipality</strong> Existing Required<br />
Abaqulusi <strong>Municipality</strong> 3 2<br />
eDumbe <strong>Municipality</strong> 2 1<br />
Nongoma <strong>Municipality</strong> 2 2<br />
Ulundi <strong>Municipality</strong> 2 2<br />
uPhongolo <strong>Municipality</strong> 1 2<br />
Source: ZDM IDP 2012/2017<br />
The Municipal Health function is preventative in nature and seeks to protect humans from contracting diseases from<br />
the environment they live in. The National Health Act, 2003 (Act No.61 of 2003) defines Municipal Health Services As<br />
<br />
<br />
<br />
<br />
<br />
<br />
<br />
<br />
<br />
<br />
Water Quality Monitoring<br />
Food Control<br />
Waste Management<br />
Health Surveillance of Premises<br />
Surveillance and Prevention of Communicable diseases, excluding immunizations<br />
Vector Control<br />
Environmental Pollution Control<br />
Disposal of the dead, and<br />
Chemical Safety<br />
The transfer of Provincial Environmental Health Practitioners is still outstanding and the service delivery is still<br />
fragmented and it will remain like that until the transfer is concluded.<br />
<strong>Zululand</strong> <strong>District</strong> <strong>Municipality</strong> has a commitment to improve the lives of its citizens. Our commitment as the<br />
municipality is to ensure that all communities of <strong>Zululand</strong> are taken care of holistically, which means that we are also<br />
concerned about people’s health and welfare while implementing our core mandates as the municipality. The ZDM<br />
Social Programmes Unit is housed at the municipal health centre known as Princess Mandisi Health Care Centre. This<br />
was the ZDM initiative of addressing the serious increase rate of HIV and AIDS in the <strong>District</strong>. Princess Mandisi Health<br />
Care Centre has the following intervention programmes:<br />
<br />
<br />
<br />
<br />
<br />
Aids Councils<br />
HIV and Aids Programmes<br />
Care and Support Programmes<br />
Lovelife Programme<br />
Orphans and Vulnerable Children<br />
5.2.3 SAFETY AND SECURITY<br />
The distribution of police stations is provided in the following map. A backlog analysis map indicating the accessibility<br />
of households to police stations is also shown. The standards that were applied were each household further than a<br />
distance of 20km from a police station was considered not to be accessible to such a facility with every 25000<br />
cumulative people not accessible to a police station indicating the need for a facility as shown in the table herewith:<br />
Date: May 2013<br />
Page 153 of 194
ZULULAND IDP REVIEW 2013/2014<br />
Table 76: Police Stations in the ZDM<br />
Local <strong>Municipality</strong> Required Existing<br />
Abaqulusi <strong>Municipality</strong> 14 6<br />
eDumbe <strong>Municipality</strong> 13 1<br />
Nongoma <strong>Municipality</strong> 49 1<br />
Ulundi <strong>Municipality</strong> 41 4<br />
uPhongolo <strong>Municipality</strong> 32 2<br />
Source: Census 2011<br />
Date: May 2013<br />
Page 154 of 194
ZULULAND IDP REVIEW 2013/2014<br />
Map 41: Distribution of Police Stations<br />
Date: May 2013<br />
Page 155 of 194
ZULULAND IDP REVIEW 2013/2014<br />
Map 42: Access to Police Stations<br />
Date: May 2013<br />
Page 156 of 194
ZULULAND IDP REVIEW 2013/2014<br />
5.2.4 NATION BUILDING AND SOCIAL COHESION<br />
Sports Development is one of the community’s activities that cut across racial, gender and culture. It promotes<br />
development, personal discipline, leadership, team work skills and entertainment through sporting activities. It also<br />
contributes to the development and empowerment of local communities and encourages interests of learning and<br />
gaining more skills. The <strong>Zululand</strong> <strong>District</strong> <strong>Municipality</strong> held a very successful and developmental Mayoral Cup Games.<br />
The <strong>Zululand</strong> <strong>District</strong> <strong>Municipality</strong> 56 km Marathon competition races from Nongoma (KwaGqikazi) to Ulundi (Ulundi<br />
Regional Stadium). Hundreds of runners from all over the country of South Africa as well as other African Countries<br />
took part in this event.<br />
From 2008 <strong>Zululand</strong> <strong>District</strong> <strong>Municipality</strong> has managed to create good relationship with KZN based PSL team<br />
(Amazulu).As a result some of Amazulu home games are played in Ulundi Regional stadium, and some of the PSL<br />
competitions are played in Ulundi.<br />
5.2.5 COMMUNITY DEVELOPMENT WITH PARTICULAR FOCUS ON VULERABLE GROUPS<br />
One of the social development IDP Objectives of the ZDM is the social upliftment of communities in the ZDM. It<br />
entails to reduce poverty by implementing community development projects. One of the indicators of this objective is<br />
the number of people participating in Capacity Building Programmes. Community Development is further embedded<br />
in many ways in the Community Services Department.<br />
<strong>Zululand</strong> <strong>District</strong> <strong>Municipality</strong> has gone extra mile to ensure that widows, orphans and people living with disabilities<br />
are in the map and are fully recognized and involved in all social and economic development programmes by providing<br />
them with a platform and a budget to cater for their projects and moreover, have their special celebration day known<br />
as widows, orphans and disability day. Typical activities include:<br />
o<br />
o<br />
o<br />
Women’s Summit and Women’s Day<br />
Youth Summit<br />
Quality of Life Forum<br />
5.2.5.1 DEVELOPMENT OF WOMEN<br />
The aim of the Women’s summit is to empower women citizens through developmental information dissemination by<br />
ZDM and other development external organs. This is a platform where women share information and enter into<br />
dialogues on issues pertaining to their development. The topics for discussion cover business opportunities, self-help<br />
programmes/projects, and education on gender based violence, women’s health, HIV/AIDS and Local Economic<br />
Development (LED) initiatives, etc.<br />
These summits have great effect in improving the quality of the lives of women of <strong>Zululand</strong> <strong>District</strong> <strong>Municipality</strong>.<br />
Women also do seize business opportunities availed through the municipal LED programmes to alleviate poverty.<br />
5.2.5.2 CHILDREN’S PROGRAMMES<br />
<strong>Zululand</strong> district is rural and poor with high HIV/AIDS infections rate therefore most of the children in the district come<br />
from indigent homes some of which are child headed. The Honourable Mayor therefore initiated a Play and Party<br />
programme for children of <strong>Zululand</strong> whereby she brings together over 5 000 children from the 5 ZDM local<br />
Date: May 2013<br />
Page 157 of 194
ZULULAND IDP REVIEW 2013/2014<br />
municipalities and brings various playing equipment and set them in a sports field for children to truly experience<br />
being children and play. Each child is then given a year end (Christmas) gift in the form of toys. Thereafter children are<br />
treated to a party with entertainment and a feast with the Mayor.<br />
5.2.5.3 AGED PROGRAMMES<br />
There are programs for the Senior citizens whereby 6 000 of them together to meet with the council annually at an<br />
event to be addressed by the Mayor on issues pertaining to their general welfare and they are afforded an<br />
opportunity to also discussed their social issues as well. This meeting takes place in December. The mayor gives them<br />
gifts and has lunch with them.<br />
There are also community LED ward projects which assist the communities to start self help projects which may be<br />
blocks making, poultry farming, vegetable gardens, sewing, etc. This programme has proven to have a great impact<br />
on the lives of people of <strong>Zululand</strong>.<br />
5.2.5.4 WIDOWS AND ORPHANS<br />
The Council’s concern about the welfare of widows and orphans prompted it to start a programme in order to assist<br />
widows to improve their lives through self help projects.<br />
5.2.5.5 DISABILITY PROGRAMMES<br />
Working with organizations such as CREATE has been beneficial to the <strong>Municipality</strong>; workshop programmes for<br />
Disability Forums of the Local Municipalities are periodically arranged in order for people living with disabilities to get<br />
exposed to their rights and opportunities relating to projects that they may start and opportunities for employment.<br />
On their special day the municipality stages an event where the Council meets with them and assist with handing out<br />
wheel chairs and other equipments as to make their lives easy.<br />
5.2.5.6 SPORT PROGRAMMES<br />
Sport programmes in ZDM are vibrant; there are annual games for the aged called Golden Games, an ultra marathon,<br />
Mayoral Cup, Indigenous Games, and ZDM participates in SALGA Games every year. These games have seen our<br />
people being selected to represent the Province and national level and some proceeding to represent the country at<br />
the world games.<br />
It is very important to consider the prevalence of HIV/Aids and the impact it has on the socio-economic conditions of<br />
the <strong>District</strong>. HIV/Aids will have a significant negative impact on the whole South African society, <strong>Zululand</strong> being no<br />
exception. KwaZulu-Natal’s present share of the South African population is about 21%. However, KZN has the<br />
highest recorded HIV-positive rate in the country indicating that the impact is likely to be more severe than in the rest<br />
of South Africa, rather than less so. It is further noted that the prevalence appears to be higher among women than<br />
among men.<br />
The table hereunder was sourced from Quantec data in 2011 and indicates the highest number of HIV/Aids related<br />
deaths occurred in the two municipalities with the highest populations, namely Nongoma and Abaqulusi. Abaqulusi<br />
has the highest number of HIV infected people and the highest HIV prevalence rate of over 17%. The district as a<br />
Date: May 2013<br />
Page 158 of 194
ZULULAND IDP REVIEW 2013/2014<br />
whole has an HIV prevalence rate of just fewer than 16%. Nongoma has the lowest HIV prevalence rate of all the<br />
municipalities. The high prevalence of HIV in the district poses a severe challenge for future development as HIV/AIDS<br />
inhibits economic growth by reducing the availability of human capital. The labour force decreases as more people fall<br />
sick and/or die. This may result in a young labour force that lacks experience, leading to reduced productivity and a<br />
smaller skilled population.<br />
Table 77: Impact of HIV/Aids on ZDM Municipalities<br />
<strong>Municipality</strong><br />
Number of<br />
Household<br />
Total<br />
Population<br />
HIV<br />
Infected<br />
AIDS<br />
Deaths<br />
Other<br />
deaths<br />
eDumbe 16,419 79,466 12,022 969 634<br />
uPhongolo 26,700 140,482 23,605 1,792 1,049<br />
Abaqulusi 41,208 247,755 42,129 3,235 1,986<br />
Nongoma 56,834 244,272 35,104 2,744 1,953<br />
Ulundi 41,962 203,163 31,911 2,518 1,640<br />
<strong>Zululand</strong> 183,122 915,139 144,770 11,258 7,261<br />
Source: Quantec 2011<br />
5.2.6 SOCIAL DEVELOPMENT SWOT ANALYSIS<br />
5.2.6.1 STRENGTHS/OPPORTUNITIES<br />
<br />
<br />
Education, Health and Community Service Sector Plan in place although it required a review.<br />
Concerted effort to involve widows, orphans and people living with disabilities in social and economic<br />
development programmes.<br />
5.2.6.2 WEAKNESSES/THREATS<br />
<br />
<br />
<br />
<br />
<br />
<br />
Backlog in the provision of primary and secondary education facilities.<br />
Significant backlog with the distribution of clinic facilities.<br />
Poor accessibility to community halls.<br />
The high prevalence of HIV in the district poses a severe challenge for future development as HIV/AIDS inhibits<br />
economic growth by reducing the availability of human capital.<br />
Alignment of housing projects with other social and infrastructure requirements remains a challenge.<br />
Backlog with the provision of police stations.<br />
Date: May 2013<br />
Page 159 of 194
ZULULAND IDP REVIEW 2013/2014<br />
6. MUNICIPAL FINANCIAL VIABILITY & MANAGEMENT ANALYSIS<br />
6.1 FINANCIAL VIABILITY & MANAGEMENT ANALYSIS<br />
6.1.1 CAPABILITY OF THE MUNICIPALITY TO EXECUTE CAPITAL PROJECTS<br />
6.1.1.1 CAPITAL BUDGET ANALYSIS (2008/2009 to 2014/2015)<br />
Table 78: Capital Expenditure by Standard Classification (2008/2009 to 2014/2015)<br />
Capital Expenditure by Standard<br />
Classification<br />
08/09<br />
AUD<br />
09/10<br />
AUD<br />
10/11<br />
AUD<br />
CY 11/12<br />
BUD<br />
CY 11/12<br />
ADJ<br />
CY 11/12<br />
FCST<br />
CY 11/12<br />
ACT<br />
Budget<br />
Year<br />
12/13<br />
Budget<br />
Year +1<br />
13/14<br />
Budget<br />
Year +2<br />
14/15<br />
Corporate Services 4 037 14 037 14 037 14 037 20 884 932 982<br />
Environmental Protection<br />
Public Safety 2 174 2 174<br />
Executive & Council 29 731 31 496 49 899 3 800 3 800 3 800 3 800 5 261 5 545 5 844<br />
Health 13 13<br />
Sport and Recreation<br />
Community & Social Services 381 1 732 3 960 183 183 183 183 693 730 770<br />
Waste Management<br />
Budget & Treasury Office 2 996 4 656 3 820 2 165 2 165 2 165 2 165 4 287 2 410 2 540<br />
Waste Water Management<br />
Road Transport<br />
Electricity<br />
Water 1 032 301 1 123 667 1 401 587 233 116 288 116 288 116 288 116 361 884 338 173 318 043<br />
Housing<br />
Planning & Development 3 789 3 878 3 789 4 751 4 751 4 751 4 751 5 010 5 273 5 565<br />
TOTAL 1 071 383 1 167 616 1 463 056 248 052 313 052 313 052 313 052 398 019 353 063 333 745<br />
Date: May 2013<br />
Page 160 of 194
ZULULAND IDP REVIEW 2013/2014<br />
From the above table, and the graph overleaf, it is evident that the bulk of all capital expenditure is to address the backlogs in water provision. However, it is also noted that there has<br />
been a significant drop in budget provision for this, following the 3-year period from 2008/2009 to 2010/2011.<br />
Table 79: Capital Expenditure by Standard Classification (2008/2009 to 2014/2015)<br />
Rm<br />
08/09<br />
AUD<br />
09/10<br />
AUD<br />
10/11<br />
AUD<br />
CY 11/12<br />
BUD<br />
CY 11/12<br />
ADJ<br />
CY 11/12<br />
FCST<br />
CY 11/12<br />
ACT<br />
Budget<br />
Year<br />
12/13<br />
Budget<br />
Year +1<br />
13/14<br />
Budget<br />
Year +2<br />
14/15<br />
Planning & Development 3 789 3 878 3 789 4 751 4 751 4 751 4 751 5 010 5 273 5 565<br />
Housing<br />
Water 1 032 301 1 123 667 1 401 587 233 116 288 116 288 116 288 116 361 884 338 173 318 043<br />
Electricity<br />
Road Transport<br />
Waste Water Management<br />
Budget & Treasury Office 2 996 4 656 3 820 2 165 2 165 2 165 2 165 4 287 2 410 2 540<br />
Waste Management<br />
Community & Social Services 381 1 732 3 960 183 183 183 183 693 730 770<br />
Sport and Recreation<br />
5000000<br />
4500000<br />
4000000<br />
3500000<br />
3000000<br />
2500000<br />
2000000<br />
1500000<br />
1000000<br />
500000<br />
Health 13 13<br />
Executive & Council 29 731 31 496 49 899 3 800 3 800 3 800 3 800 5 261 5 545 5 844<br />
Public Safety 2 174 2 174<br />
Environmental Protection<br />
0<br />
Capital expenditure by Standard Classification<br />
Corporate Services 4 037 14 037 14 037 14 037 20 884 932 982<br />
Date: May 2013<br />
Page 161 of 194
ZULULAND IDP REVIEW 2013/2014<br />
6.1.1.2 OPERATIONAL BUDGET ANALYSIS (2008/2009 TO 2014/2015)<br />
Table 80: Revenue by Major Source (2008/2009 to 2014/2015)<br />
Revenue by Major Source 08/09<br />
AUD<br />
09/10<br />
AUD<br />
10/11<br />
AUD<br />
CY 11/12<br />
BUD<br />
CY 11/12<br />
ADJ<br />
CY 11/12<br />
FCST<br />
CY 11/12<br />
ACT<br />
Budget<br />
Year<br />
12/13<br />
Budget<br />
Year +1<br />
13/14<br />
Budget<br />
Year +2<br />
14/15<br />
Dividends received<br />
Agency services<br />
Contributions 70<br />
Contributed assets<br />
Licences and permits<br />
Gains on disposal of PPE 61 23<br />
Service charges - sanitation revenue 5 204 7 447 4 796 4 796 4 796 4 796 7 820<br />
Interest earned - outstanding debtors 272 574<br />
Service charges - other 17 692<br />
Rental of facilities and equipment 83 84<br />
Service charges - refuse 392<br />
Other revenue 461 2 792 1 411 48 803 60 053 60 053 60 053 81 540 65 032 65 091<br />
Fines<br />
Interest earned - external investments 21 195 9 351 12 317 12 067 12 067 12 067 12 067 12 567 13 246 13 961<br />
Transfers recognised 350 874 193 327 418 603 238 063 252 063 252 063 252 063 271 333 290 097 311 448<br />
Service charges - water revenue 18 322 16 239 15 105 15 105 15 105 15 105 24 952<br />
Transfers recognised - capital 216 688 195 741 248 052 293 788 293 788 293 788 378 363 338 670 318 575<br />
Service charges - electricity revenue<br />
Property rates<br />
TOTAL 396 472 439 851 652 439 566 886 637 872 637 872 637 872 776 966 707 045 709 075<br />
As evident from the above table, and the graph overleaf, the bulk of Municipal Revenue is via Transfers, whilst virtually no income is derived from rates of service charges.<br />
Date: May 2013<br />
Page 162 of 194
ZULULAND IDP REVIEW 2013/2014<br />
800 000<br />
Revenue by Source - Major<br />
700 000<br />
600 000<br />
500 000<br />
Rm<br />
400 000<br />
300 000<br />
200 000<br />
100 000<br />
Property rates<br />
Service charges - electricity revenue<br />
08/09 AUD 09/10 AUD 10/11 AUD<br />
CY 11/12<br />
BUD<br />
CY 11/12<br />
ADJ<br />
CY 11/12<br />
FCST<br />
CY 11/12<br />
ACT<br />
Budget<br />
Year 12/13<br />
Budget<br />
Year +1<br />
13/14<br />
Budget<br />
Year +2<br />
14/15<br />
Transfers recognised - capital 216 688 195 741 248 052 293 788 293 788 293 788 378 363 338 670 318 575<br />
Service charges - water revenue 18 322 16 239 15 105 15 105 15 105 15 105 24 952<br />
Transfers recognised 350 874 193 327 418 603 238 063 252 063 252 063 252 063 271 333 290 097 311 448<br />
Figure 34: Revenue by Major Source (2008/2009 to 2014/2015)<br />
Date: May 2013<br />
Page 163 of 194
ZULULAND IDP REVIEW 2013/2014<br />
Table 81: Operating Expenditure by Major & Minor Type (2008/2009 to 2014/2015)<br />
Operating Expenditure by Major & Minor Type<br />
Other materials<br />
Loss on disposal of PPE<br />
Remuneration of councillors 4 934 5 039 4 792 5 467 5 717 5 717 5 717 5 939 6 479 7 069<br />
Grants and subsidies 813 845 900 1 081 1 081 1 081 1 081 1 152 490 490<br />
Debt impairment 14 996 3 055 3 055 3 055 3 055 3 226 4 071 4 441<br />
Contracted services 4 344 10 759 10 759 10 759 10 759 13 757 14 500 15 283<br />
Finance charges 833 697 618 310 310 310 310 50 53 56<br />
Depreciation & asset impairment 30 029 31 979 31 574 33 108 33 108 33 108 33 108 31 574<br />
Other expenditure 145 930 160 762 145 883 89 588 112 088 112 088 112 088 112 317 104 451 108 059<br />
Bulk purchases 25 188 35 064 39 166 49 929 52 429 52 429 52 429 71 789 75 665 79 751<br />
Employee related costs 59 638 74 960 84 261 85 304 85 304 85 304 85 304 98 499 105 432 115 027<br />
TOTAL 267 365 309 346 326 534 278 602 303 852 303 852 303 852 338 301 311 141 330 175<br />
Rm<br />
700 000<br />
600 000<br />
500 000<br />
400 000<br />
300 000<br />
200 000<br />
100 000<br />
Expenditure by Type - Major<br />
08/09<br />
AUD<br />
09/10<br />
AUD<br />
10/11<br />
AUD<br />
CY<br />
11/12<br />
BUD<br />
CY<br />
11/12<br />
ADJ<br />
CY<br />
11/12<br />
FCST<br />
CY<br />
11/12<br />
ACT<br />
Budget<br />
Year<br />
12/13<br />
Budget<br />
Year +1<br />
13/14<br />
Budget<br />
Year +2<br />
14/15<br />
check 267 365 309 346 326 534 278 602 303 852 303 852 303 852 338 301 311 141 330 175<br />
Employee related costs 59 638 74 960 84 261 85 304 85 304 85 304 85 304 98 499 105 432 115 027<br />
Bulk purchases 25 188 35 064 39 166 49 929 52 429 52 429 52 429 71 789 75 665 79 751<br />
Other expenditure 145 930 160 762 145 883 89 588 112 088 112 088 112 088 112 317 104 451 108 059<br />
Figure 35: Operating Expenditure - Major (2008/2009 to 2014/2015)<br />
Date: May 2013<br />
Page 164 of 194
ZULULAND IDP REVIEW 2013/2014<br />
30 000<br />
Expenditure by Type - Minor - Chart A7<br />
25 000<br />
20 000<br />
15 000<br />
Rm<br />
10 000<br />
5 000<br />
08/09 AUD 09/10 AUD 10/11 AUD<br />
CY 11/12<br />
BUD<br />
CY 11/12<br />
ADJ<br />
CY 11/12<br />
FCST<br />
CY 11/12<br />
ACT<br />
Budget<br />
Year 12/13<br />
Budget<br />
Year +1<br />
13/14<br />
Finance charges 833 697 618 310 310 310 310 50 53 56<br />
Budget<br />
Year +2<br />
14/15<br />
Contracted services 4 344 10 759 10 759 10 759 10 759 13 757 14 500 15 283<br />
Debt impairment 14 996 3 055 3 055 3 055 3 055 3 226 4 071 4 441<br />
Grants and subsidies 813 845 900 1 081 1 081 1 081 1 081 1 152 490 490<br />
Remuneration of councillors 4 934 5 039 4 792 5 467 5 717 5 717 5 717 5 939 6 479 7 069<br />
Loss on disposal of PPE<br />
Other materials<br />
Figure 36: Operating Expenditure - Minor (2008/2009 to 2014/2015)<br />
In terms of Major Operating Expenditure, there has been a steady increase in both bulk purchases and Employee related costs.<br />
In terms of Minor Operating Expenditure, there has been a steady increase in contracted services and remuneration of councillors.<br />
Date: May 2013<br />
Page 165 of 194
ZULULAND IDP REVIEW 2013/2014<br />
6.1.2 INDIGENT SUPPORT (INCLUDING FREE BASIC SERVICES)<br />
The definition of a poor household relates to income poverty, or the lack of sufficient income to satisfy basic and<br />
essential needs such as food, clothing, energy and shelter. The ZDM Indigent Policy is in line with this definition which<br />
also takes into consideration the total monthly household income.<br />
Like many other <strong>District</strong>s, the majority of the population in the <strong>Zululand</strong> <strong>District</strong> <strong>Municipality</strong> is indigent<br />
(approximately 80%) and that means a small revenue base. Therefore a significant portion of the budget<br />
goes towards infrastructure development with very little revenue generated.<br />
National Government Policy derives its standard for free basic water supply from that of the World Health<br />
Organisation (25l/p/p/day) which is regarded as sufficient to promote healthy living. The ZDM has an average<br />
household rate of 8 persons, meaning that the standard is equal to 6 kilolitres per household per month.<br />
6.1.3 REVENUE ENHANCEMENT AND PROTECTION STRATEGIES<br />
The following are noted hereunder:<br />
<br />
<br />
<br />
<br />
Revision of implementation of a credit control policy<br />
Strengthening the Customer Services Centre<br />
Customer education<br />
All water and sewerage debtors are to be followed up and collected in terms of the credit control policy. It is<br />
imperative to collect debtors so as to be able to undertake service delivery. Writing off bad debts will be<br />
dealt with in the delegated powers.<br />
Date: May 2013<br />
Page 166 of 194
ZULULAND IDP REVIEW 2013/2014<br />
6.1.4 MUNICIPAL CONSUMER DEBT POSITION<br />
The nature and extent of poverty in the district is negatively affecting the ability of the majority of our residents to pay for the services rendered. As a result, the value of outstanding<br />
debtors is increasing.<br />
To reduce this outstanding balance, council has resorted to the strict implementation of the credit control and debt collection policy by installing controlled flow meters for the indigent<br />
consumers and the restriction of water supply for the non-indigent consumers.<br />
The <strong>Municipality</strong>’s Consumer and Other Debts are reflected in the table below:<br />
Table 82: Municipal Assets (including Debts)<br />
In 2012/2013 the Municipal Budget made provision for R6,766,000 consumer debt. This amounted to a year-on-year increase of 216% increase.<br />
Date: May 2013<br />
Page 167 of 194
ZULULAND IDP REVIEW 2013/2014<br />
6.1.5 GRANTS & SUBSIDIES<br />
The table below gives an indication of Transfer and Grants Receipts:<br />
Table 83: Transfer and Grants Receipts<br />
Description 2008/9 2009/10 2010/11 Current Year 2011/12<br />
2012/13 Medium Term Revenue & Expenditure<br />
Framework<br />
R thousand<br />
Audited<br />
Outcome<br />
Audited<br />
Outcome<br />
Audited<br />
Outcome<br />
Original Budget Adjusted Budget Full Year Forecast<br />
Budget<br />
2012/13<br />
Year<br />
Budget Year<br />
+1 2013/14<br />
Budget Year<br />
+2 2014/15<br />
RECEIPTS:<br />
Operating Transfers and Grants<br />
National Government: – 160 532 – 242 375 236 576 236 576 269 372 288 258 309 509<br />
Local Government Equitable Share 159 047 234 326 234 326 234 326 258 854 277 840 299 001<br />
Finance Management 750 1 250 1 250 1 250 1 250 1 250 1 250<br />
Municipal Systems Improvement 735 1 000 1 000 1 000 1 000 900 1 000<br />
Water Services Operating Subsidy Grant 8 268 8 268 8 258<br />
Other transfers/grants [insert description] 5 799<br />
Provincial Government: 159 877 222 956 – 1 487 15 487 15 487 1 961 1 839 1 939<br />
159 877 222 656 –<br />
DEVELOPMENT PLANNING SHARED<br />
SERVICES – 200 210<br />
DISTRICT GROWTH DEVELOPMENT<br />
SUMMIT 400 – –<br />
INDONSA GRANT 1 487 1 487 1 487 1 561 1 639 1 729<br />
P700 CORRIDOR DEVELOPMENT 14 000 14 000<br />
Other transfers/grants [insert description] 300<br />
<strong>District</strong> <strong>Municipality</strong>: – – – – – – – – –<br />
[insert description]<br />
Other grant providers: – – – – – – – – –<br />
[insert description]<br />
Date: May 2013<br />
Page 168 of 194
ZULULAND IDP REVIEW 2013/2014<br />
Description 2008/9 2009/10 2010/11 Current Year 2011/12<br />
2012/13 Medium Term Revenue & Expenditure<br />
Framework<br />
R thousand<br />
Audited<br />
Outcome<br />
Audited<br />
Outcome<br />
Audited<br />
Outcome<br />
Original Budget Adjusted Budget Full Year Forecast<br />
Budget<br />
2012/13<br />
Year<br />
Budget Year<br />
+1 2013/14<br />
Budget Year<br />
+2 2014/15<br />
Total Operating Transfers and Grants 159 877 383 488 – 243 862 252 063 252 063 271 333 290 097 311 448<br />
Capital Transfers and Grants<br />
National Government: – – – – 55 000 55 000 358 363 338 670 318 575<br />
Municipal Infrastructure Grant (MIG) 275 487 290 606 316 603<br />
Regional Bulk Infrastructure 55 000 55 000 81 100 46 200<br />
Rural Roads Assets Management Grants 1 776 1 864 1 972<br />
Other capital transfers/grants [insert desc] – – –<br />
Provincial Government: – – – – 10 000 10 000 20 000 – –<br />
Upgrading of airport 10 000 10 000 20 000 – –<br />
<strong>District</strong> <strong>Municipality</strong>: – – – – – – – – –<br />
[insert description]<br />
Other grant providers: – – – – – – – – –<br />
[insert description]<br />
Total Capital Transfers and Grants – – – – 65 000 65 000 378 363 338 670 318 575<br />
TOTAL RECEIPTS OF TRANSFERS &<br />
GRANTS<br />
159 877 383 488 – 243 862 317 063 317 063 649 696 628 767 630 023<br />
A total amount of R649,767,000 was budgeted for in 2012/2013 for receipts of transfers and grants.<br />
Date: May 2013<br />
Page 169 of 194
ZULULAND IDP REVIEW 2013/2014<br />
6.1.6 MUNICIPAL INFRASTRUCTURE ASSETS & MAINTENANCE (Q&M)<br />
The table below gives an indication of the Expenditure on Repairs and Maintenance of Municipal Assets:<br />
Table 84: Repairs and Maintenance Expenditure (2008/2009 to 2014/2015)<br />
Description 2008/9 2009/10 2010/11 Current Year 2011/12<br />
2012/13 Medium Term Revenue & Expenditure<br />
Framework<br />
R thousand<br />
Repairs and maintenance expenditure by<br />
Asset Class/Sub-class<br />
Audited<br />
Outcome<br />
Audited<br />
Outcome<br />
Audited<br />
Outcome<br />
Original Budget Adjusted Budget Full Year Forecast<br />
Budget<br />
2012/13<br />
Year<br />
Budget Year<br />
+1 2013/14<br />
Budget Year<br />
+2 2014/15<br />
Infrastructure 17 496 23 240 23 280 32 080 32 080 32 080 35 436 37 350 39 367<br />
Infrastructure - Road transport – – – – – – – – –<br />
Roads, Pavements & Bridges<br />
Storm water<br />
Infrastructure - Electricity – – – – – – – – –<br />
Generation<br />
Transmission & Reticulation<br />
Street Lighting<br />
Infrastructure - Water 17 496 23 240 23 280 32 080 32 080 32 080 35 436 37 350 39 367<br />
Dams & Reservoirs<br />
Water purification<br />
Reticulation 17 496 23 240 23 280 32 080 32 080 32 080 35 436 37 350 39 367<br />
Infrastructure - Sanitation – – – – – – – – –<br />
Reticulation<br />
Sewerage purification<br />
Infrastructure - Other – – – – – – – – –<br />
Waste Management<br />
Transportation<br />
Gas<br />
Other<br />
Community – 587 1 715 – – – – – –<br />
Date: May 2013<br />
Page 170 of 194
ZULULAND IDP REVIEW 2013/2014<br />
Description 2008/9 2009/10 2010/11 Current Year 2011/12<br />
2012/13 Medium Term Revenue & Expenditure<br />
Framework<br />
R thousand<br />
Audited<br />
Outcome<br />
Audited<br />
Outcome<br />
Audited<br />
Outcome<br />
Original Budget Adjusted Budget Full Year Forecast<br />
Budget<br />
2012/13<br />
Year<br />
Budget Year<br />
+1 2013/14<br />
Budget Year<br />
+2 2014/15<br />
Parks & gardens<br />
Sportsfields & stadia<br />
Swimming pools 587 1 715<br />
Community halls<br />
Libraries<br />
Recreational facilities<br />
Fire, safety & emergency<br />
Security and policing<br />
Buses<br />
Clinics<br />
Museums & Art Galleries<br />
Cemeteries<br />
Social rental housing<br />
Other<br />
Heritage assets – – – – – – – – –<br />
Buildings<br />
Other<br />
Investment properties – – – – – – – – –<br />
Housing development<br />
Other<br />
Other assets 1 781 2 301 2 842 8 152 8 152 8 152 5 210 5 491 5 788<br />
General vehicles 1 832 2 087<br />
Specialised vehicles – – – – – – – – –<br />
Plant & equipment<br />
Computers - hardware/equipment 66 50<br />
Furniture and other office equipment 8 13<br />
Abattoirs<br />
Markets<br />
Civic Land and Buildings<br />
Other Buildings 395 693<br />
Other Land<br />
Surplus Assets - (Investment or Inventory)<br />
Date: May 2013<br />
Page 171 of 194
ZULULAND IDP REVIEW 2013/2014<br />
Description 2008/9 2009/10 2010/11 Current Year 2011/12<br />
2012/13 Medium Term Revenue & Expenditure<br />
Framework<br />
R thousand<br />
Audited<br />
Outcome<br />
Audited<br />
Outcome<br />
Audited<br />
Outcome<br />
Original Budget Adjusted Budget Full Year Forecast<br />
Budget<br />
2012/13<br />
Year<br />
Budget Year<br />
+1 2013/14<br />
Budget Year<br />
+2 2014/15<br />
Other 1 781 8 152 8 152 8 152 5 210 5 491 5 788<br />
Agricultural assets – – – – – – – – –<br />
List sub-class<br />
Biological assets – – – – – – – – –<br />
List sub-class<br />
Intangibles – – – – – – – – –<br />
Computers - software & programming<br />
Other (list sub-class)<br />
Total Repairs and Maintenance Expenditure 19 277 26 128 27 837 40 232 40 232 40 232 40 646 42 841 45 154<br />
The ZDM budgeted in 2012/2013 an amount of R40,646,000 for repairs and maintenance of municipal assets.<br />
Date: May 2013<br />
Page 172 of 194
ZULULAND IDP REVIEW 2013/2014<br />
Repairs & Maintenance<br />
0-Jan-00<br />
0-Jan-00<br />
0-Jan-00<br />
0-Jan-00<br />
0-Jan-00<br />
0-Jan-00<br />
0-Jan-00<br />
0-Jan-00<br />
0-Jan-00<br />
0-Jan-00<br />
0-Jan-00<br />
0-Jan-00<br />
0-Jan-00<br />
0-Jan-00<br />
0-Jan-00<br />
Repairs & Maintenance<br />
2008/09 2009/10 2010/11 2011/12<br />
Repairs and Maintenance – This represents the propotion of operating expenditure spent and<br />
is calculated by dividing the total repairs and maintenace.<br />
Data used from MBRR SA8<br />
Figure 37: Repairs & Maintence Trends<br />
Date: May 2013<br />
Page 173 of 194
ZULULAND IDP REVIEW 2013/2014<br />
6.1.7 CURRENT & PLANNED BORROWINGS<br />
The <strong>Municipality</strong> has no current or planned Borrowings.<br />
6.1.8 RISK ASSESSMENT<br />
The risk assessment has been conducted in conjunction with Provincial Treasury. A risk register has been developed<br />
and presented to the Audit Committee for approval. Internal Audit used the risk register to prioritize the areas of<br />
attention in the 2010/2011 financial year. The municipality is exposed to various risks of loss including theft of,<br />
damage to, and destruction of assets, errors and omissions, injuries to employees, employee health and natural<br />
disasters. The municipality generally obtains insurance to mitigate the risks associated with possible losses but has<br />
chosen to retain the risks associated with underground infrastructure i.e. water and sewer pipes networks.<br />
The Audit and Risk Management Committee will, in terms of its authority delegated by Council, facilitate the<br />
development of a formal Risk Management Framework and Strategy. The results of the risk assessments should be<br />
used to direct internal audit efforts and priorities, and to determine the skills required of managers and staff to<br />
improve controls and to manage these risks.<br />
Management has formed an Operational Risk Management Committee (Risk Sub Committee) chaired by the Chief<br />
Financial Officer. The aim of the Risk Sub Committee is to implement the risk management strategies and give<br />
feedback to the Audit and Risk Management committee on a regular basis .The risk register will be updated regularly<br />
with identified and new emerging risks including mitigating responses and action plans.<br />
6.1.9 MUNICIPALITY’S CREDIT RATING<br />
The <strong>Zululand</strong> <strong>District</strong> <strong>Municipality</strong> currently does not have a Credit Rating.<br />
Date: May 2013<br />
Page 174 of 194
ZULULAND IDP REVIEW 2013/2014<br />
6.1.10 EMPLOYEE RELATED COSTS (INCLUDING COUNCILOR ALLOWANCES)<br />
Description 2008/9 2009/10 2010/11 Current Year 2011/12<br />
2012/13 Medium Term Revenue & Expenditure<br />
Framework<br />
R thousand<br />
Audited<br />
Outcome<br />
Audited<br />
Outcome<br />
Audited<br />
Outcome<br />
Original<br />
Budget<br />
Adjusted<br />
Budget<br />
Full Year<br />
Forecast<br />
Pre-audit<br />
outcome<br />
Budget Year<br />
2012/13<br />
Budget Year<br />
+1 2013/14<br />
Budget Year<br />
+2 2014/15<br />
Expenditure By Type<br />
Employee related costs 59 638 74 960 84 261 85 304 85 304 85 304 85 304 98 499 105 432 115 027<br />
Remuneration of councillors 4 934 5 039 4 792 5 467 5 717 5 717 5 717 5 939 6 479 7 069<br />
Debt impairment 14 996 3 055 3 055 3 055 3 055 3 226 4 071 4 441<br />
Depreciation & asset<br />
impairment 30 029 31 979 31 574 33 108 33 108 33 108 33 108 31 574 – –<br />
Finance charges 833 697 618 310 310 310 310 50 53 56<br />
Bulk purchases 25 188 35 064 39 166 49 929 52 429 52 429 52 429 71 789 75 665 79 751<br />
Other materials<br />
Contracted services 3 008 3 707 4 344 10 759 10 759 10 759 10 759 13 757 14 500 15 283<br />
Transfers and grants 813 845 900 1 081 1 081 1 081 1 081 1 152 490 490<br />
Other expenditure 142 921 157 056 145 883 89 588 112 088 112 088 112 088 112 317 104 451 108 060<br />
Loss on disposal of PPE<br />
Total Expenditure 267 365 309 346 326 534 278 602 303 852 303 852 303 852 338 301 311 141 330 176<br />
Date: May 2013<br />
Page 175 of 194
ZULULAND IDP REVIEW 2013/2014<br />
Employee Costs<br />
0-Jan-00<br />
0-Jan-00<br />
0-Jan-00<br />
0-Jan-00<br />
0-Jan-00<br />
0-Jan-00<br />
0-Jan-00<br />
0-Jan-00<br />
0-Jan-00<br />
0-Jan-00<br />
0-Jan-00<br />
0-Jan-00<br />
0-Jan-00<br />
0-Jan-00<br />
0-Jan-00<br />
0-Jan-00<br />
Employee costs<br />
2008/09 2009/10 2010/11 2011/12<br />
Employee cost – Measures what portion of the revenue was spent on paying employee costs.<br />
It is calculated by dividing the total employee cost by the difference between total revenue<br />
and capital revenue.<br />
Data used from MBRR SA8<br />
Figure 38: Employee Costs Trends<br />
Date: May 2013<br />
Page 176 of 194
ZULULAND IDP REVIEW 2013/2014<br />
6.1.11 SUPPLY CHAIN MANAGEMENT (SCM)<br />
The Council approved a SCM policy. The bid committees were established and are functional. The SCM procurement<br />
thresholds as per the SCM regulations are adhered to. However, at times there are deviations that are approved in<br />
terms of regulation 36 mainly in case of emergency, sole supplies and where it is impractical to follow the<br />
procurement process. The required SCM reports are submitted to the relevant authorities.<br />
7. GOOD GOVERNANCE & PUBLIC PARTICIPATION ANALYSIS<br />
7.1 GOOD GOVERNANCE ANALYSIS<br />
7.1.1 NATIONAL AND PROVINCIAL PROGRAMMES ROLLED-OUT AT MUNICIPAL LEVEL<br />
1.10.8.1 EPWP<br />
Research was conducted to evaluate the impact of the Expanded Public Works Programmes on job creation in the<br />
<strong>Zululand</strong> <strong>District</strong> in order to guide government in developing a policy that will assist future job creation programmes.<br />
The Provincial government has prioritized poverty reduction and job creation as key focus areas in KwaZulu-Natal. This<br />
study attempted to determine whether the Expanded Public Works Programme contributes towards job creation and<br />
economic growth in <strong>Zululand</strong> <strong>District</strong> <strong>Municipality</strong>.<br />
As training of people on the Expanded Public Works Programme is often conducted in less than six months and as the<br />
training is often not accredited, it is concluded that the jobs created by the Expanded Public Works Programme in the<br />
<strong>Zululand</strong> <strong>District</strong> <strong>Municipality</strong> are not sustainable. A high percentage of people worked on the Expanded Public Works<br />
Programme projects. Although these jobs are not sustainable, they do contribute towards the reduction of<br />
unemployment during the construction phase of the project. Most people agree with and support the Expanded<br />
Public Works Programme as a successful programme that gives hope for job creation. The output and impact of the<br />
Expanded Public Works Programme on skills training, monthly gross household income, daily wage, sustainable jobs<br />
and reduction in unemployment is shown to be minimal or not having a very noticeable impact. It is recommended<br />
that registered institutions under the Department of Education should be used to conduct training on these projects<br />
so that the level of training received can be consistent for all people trained.<br />
Table 85: Job Creation through EPWP Projects within ZDM<br />
JOB CREATION THROUGH EPWP PROJECTS<br />
Details EPWP Projects Jobs created through EPWP<br />
projects no.<br />
2010/11 123 2071<br />
2011/12 156 3366<br />
Date: May 2013<br />
Page 177 of 194
ZULULAND IDP REVIEW 2013/2014<br />
1.10.8.2 CWP<br />
The <strong>Zululand</strong> Centre for Sustainable Development (ZCSD) is a Local Implementing Agent for the CWP Programme in<br />
<strong>Zululand</strong>. Of the 35,000 work opportunities implemented by Teba Development, 3000 are managed by the ZCSD,<br />
resulting in 1000 new Work Opportunities being created in each of three <strong>Zululand</strong> sites: Dlangubo, Dukuduku and<br />
Mbazwana. As of August 2011 two new sites have joined the fold of ZCSD Implemented sites: Nkandla and Ndwedwe.<br />
ZCSD has been involved with the Community Work Programme since August 2009. In that time the programme has<br />
grown in maturity and impact. Much has been achieved, but there is still much work to be done and growth to take<br />
place.<br />
Despite various interventions by the State, unemployment remains a critical challenge that requires attention given<br />
the symptoms and knock-on effects such as crime, under-stimulated local economies, malnutrition, infant mortality,<br />
social decay, and many others that currently prevails the environment.<br />
Thankfully, we have organisations in South Africa, who have dedicated themselves to addressing this problem at its<br />
core, and who are beginning to see some real positive change in three of the most poverty stricken areas. This has all<br />
been made possible through a government funded programme managed by the Department of Co-Operative<br />
Governance and Traditional Affairs (CoGTA) and implemented by a national NGO, TEBA Development.<br />
What is the CWP<br />
CWP (Community Work Programme) is a Government Programme that provides an employment safety net, by giving<br />
participants a minimum level of regular work opportunities, with a predictable number of days of work provided per<br />
month.<br />
Workers are paid R60 per day to work eight days a month. They are arranged into work teams that carry out<br />
Community Improvement Work within their own villages. They are also supplied with tools and training relevant to<br />
the tasks that they are carrying out.<br />
What this means is that, not only are the households of participants receiving much needed income, but the<br />
communities in which these people live are themselves being slowly and steadily improved through the work done by<br />
the CWP participants.<br />
The CWP forms part of a Presidential Job Creation Initiative. To quote Jacob Zuma from his State of the Nation<br />
Address of 3 June 2009:<br />
"As part of Phase 2 of the Expanded Public Works Programme, the Community Work Programme will be fast-tracked.”<br />
As of 1 April 2010, the Department of Co-opperative Governance has taken over the overall, National Management of<br />
the CWP. TEBA Development is one of two NGO's contracted to roll this programme out nationwide. They currently<br />
manage 35 420 work opportunities in 30 sites. A site is defined as a minimum of 1,000 work opportunities in at least<br />
two wards of a local municipality.<br />
Impact of this programme in <strong>Zululand</strong><br />
The following was axtracted from the “<strong>Zululand</strong> Centre for Sustainable Development” website<br />
(http://zcsd.org.za/index.php/features/55-interview-with-gavin-eichler-on-the-cwp):<br />
ZCSD has been operating as a Local Implementing Agent for the CWP programme since the initial pilot phase in<br />
October 2009. The programme looks at real community assistance. Using hands to do real work where it is needed in<br />
Date: May 2013<br />
Page 178 of 194
ZULULAND IDP REVIEW 2013/2014<br />
the community: fixing roads, cleaning pathways, play areas, assisting pensioners to get their pensions, building<br />
structures that make it humane. Other activities includes vegetable gardens, making compost for the poor soils that<br />
are out there, fixing up orphan homes, cleaning graveyards, etc. The programme is also looking at assisting the SPCA<br />
who does a lot of work for the community. Building wells, setting up strategically placed water-harvesting systems,<br />
and water efficient irrigation systems is also some of the outcomes.<br />
Together with the community the ZCSD identify and establish the greatest needs of the people in each village. They<br />
have advised the leadership of the communities that whenever they propose a new project or activity, they must be<br />
able to clearly answer the question how that helps the community as a whole. The ZCSD helps Municipalities in<br />
disadvantaged communities to improve basic service delivery. 65% of all funding allocated to these projects ends up in<br />
the hands of the people doing the work.<br />
There is about R24 million going into this project alone, directly benefitting 3000 zululanders. That is 3000 people who<br />
didn’t have any jobs at all, and who have now been uplifted, trained, and supplied with tools. This allows those people<br />
to have some respect in their families and within their communities by showing their neighbours that they are<br />
working and to gain some skills to move to the next step. ZCSD also found that a lot of the people that joined them are<br />
also leaving. In fact 4400 people have participated, and they are not leaving because they don’t want to work<br />
anymore, but leaving to take up better positions, or because the programme has stimulated some thought to start up<br />
a little business such as a nursery for example. Because this programme encourages compost, waste recycling and<br />
beading, it has environmental advantages as well.<br />
The vision for the programme is to see people becoming productive, giving real time for the money they receive and<br />
making full use of the equipment that they have received – to improve their livelihoods and lifestyles within that<br />
community. The intention is to reach a point at which the local community, mentored by a locally represented NGO,<br />
can actually run the programme. With this in mind, they want to build capacity of their CWP participants, team<br />
leaders, supervisors, and assistant facilitators; so that they understand that this is not just another government<br />
handout - that this is a real project, that has real long term impact in their community; and that if they want to cross<br />
the system, all that it means is that they are stealing from themselves.<br />
The reason for ineffective and failed programmes is that they are not from the people. Projects are imposed on them<br />
or are what the municipality decides they need for example a poultry project or a sports centre being built when it is<br />
not actually what the community wants. Also there is no ownership. They see it as the Government’s or the<br />
Councillor’s project, because they were not involved or consulted in developing it. The project has to be from the<br />
people for the people. The project is starting to look at the real needs of the community in more creative ways such as<br />
people building their own houses. The CWP is in an excellent position to provide such solutions, sayd Gavin Eichler,<br />
the Managing Director of ZCSD.<br />
1.10.8.3 OPERATION SUKUMA SAKHE<br />
The origin of Masisukuma Sakhe, which is the motto on the crest of of the Provincial Government of KwaZulu-Natal, is<br />
taken from the Prophet Nehemiah 2:18, where he yearns to rebuild a city that has been destroyed. Operation Sukuma<br />
Sakhe then is a call for the people of KwaZulu-Natal to be determined to overcome the issues that have destroyed the<br />
communities such as poverty, unemployment, crime, substance abuse, HIV & AIDS and TB.<br />
Newsletter stating Operation Sukuma Sakhe has gone far in <strong>Zululand</strong>:<br />
The program which is an initiative of the cabinet started in July 2009 as Flagship has now been branded to Operation<br />
Sukuma Sakhe (OSS) it focuses in fighting diseases such as HIV/AIDS, TB and Chronic, women and youth<br />
empowerment, food security,etc.<br />
Date: May 2013<br />
Page 179 of 194
ZULULAND IDP REVIEW 2013/2014<br />
In <strong>Zululand</strong> <strong>District</strong>, team members were elected to represent all departments who further visit five local<br />
municipalities. Local task teams were also elected. There are Master trainers who trained cadres on the program<br />
which includes households profiling. In this district the program was initiated in the 10 most deprived wards out of 89<br />
wards, that was ward 1,2,3,6,16 and 24 in Ulundi and 1,3 and 14 in Nongoma and ward 3 in Abaqulusi.<br />
Household profiling started in these wards, the main aim was to identify and analyse needs of people and give<br />
intervention which could immediately, medium term or long term be effective. Where needs have been identified the<br />
team plan an operation Mbo where departments which includes Health, Education, Social Development, SASSA,<br />
DAERD, DHA, DHS, DAC, DOL, etc visits the area.<br />
Five local AIDS councils and <strong>District</strong> AIDS council were launched. Various conferences were hosted. Ward committees<br />
were also launched and the new areas are being orientated on Operation Sukuma Sakhe. In different wards<br />
community halls are identified as war rooms. In specific days ward convener, community leaders and different<br />
stakeholders meet in war rooms so that the community bring their needs for the attention of Operation Sukuma<br />
Sakhe.<br />
Every year in July Senior managers for <strong>Zululand</strong> <strong>District</strong> is allocated in different wards for profiling and this helps in<br />
giving them the experience on what is happening in the <strong>District</strong>. This is a new approach which emphasizes the service<br />
delivery in every ward. In <strong>Zululand</strong> <strong>District</strong> the program is championed by the KwaZulu-Natal Premier Dr. Zweli Mkhize<br />
and the Head of Department of Health Dr. Sbongile Zungu. The Provincial convener is Mr. Skhumbuzo Gumede.<br />
7.1.2 IGR<br />
1.10.8.4 LEGAL FRAMEWORK<br />
Intergovernmental Relations (IGR) in South African context concern the interaction of the different spheres of<br />
government. The Constitution declares that government is comprised of National, Provincial and Local spheres of<br />
government which are distinctive, interdependent and interrelated. According to the Constitution of the Republic of<br />
South Africa, Act, No.108 of 1996, <strong>Section</strong> 41 (2), an Act of Parliament must establish or provide structures and<br />
institutions to promote and facilitate Intergovernmental Relations and provide for appropriate mechanisms and<br />
procedures to facilitate settlement of Intergovernmental disputes.<br />
1.10.8.5 DEVELOPMENT OF AN IGR STRATEGY AND FRAMEWORK<br />
7.1.2.1.1 Background<br />
In its endeavor to strengthen relations amongst its institutional and co-operative governance structures as well as to<br />
accelerate service delivery excellence the <strong>Zululand</strong> <strong>District</strong> <strong>Municipality</strong> (in conjunction with the Department of<br />
COGTA) is developing an IGR Strategy and Framework which will promote co-ordination, and integration of efforts, as<br />
well as monitoring and evaluating implementation. The IGR Strategy and Framework has the following targeted<br />
objectives:<br />
a) Establishment of a fully functional and operational IGR structure;<br />
b) Development of a business engagement model which will encourage all stake holder involvement towards<br />
economic viability within the district;<br />
c) Capacitation of Mayors on IGR; and<br />
Date: May 2013<br />
Page 180 of 194
ZULULAND IDP REVIEW 2013/2014<br />
d) Development of a monitoring mechanism which will be used to track and report on IGR progress.<br />
7.1.2.1.2 Project Steering Committee<br />
A project steering committee has been established and comprises of the IGR Champion (<strong>Zululand</strong> <strong>District</strong><br />
<strong>Municipality</strong>), the Service Provider, COGTA and Local Municipalities.<br />
7.1.2.1.3 Protocol Agreement<br />
A protocol agreement was signed between all the Mayors in <strong>Zululand</strong> back in February 2012 committing themselves<br />
towards improving Inter-governmental Relations.<br />
7.1.2.1.4 Established Forums<br />
There are two forums established for inter-governmental relations, the IGR Forum for the mayors of the municipalities<br />
that comprise the area of jurisdiction of the <strong>Zululand</strong> <strong>District</strong> <strong>Municipality</strong> and a Technical Forum to be attended by<br />
the respective municipal managers; however, neither of these forums currently meet on a regular basis which<br />
complicates the communication processes that are essential for cooperation and coordination to take effect.<br />
In the past the sector departments of the KZN Provincial Government have delivered projects and programmes within<br />
the service area of the Ulundi <strong>Municipality</strong> without reference to the needs expressed in the IDP; in preparation for this<br />
IDP review significant contact has been made with the sector department representatives in order to promote<br />
alignment between the programmes and projects driven by the <strong>Municipality</strong> and those that are undertaken by sector<br />
departments, whether at a national or provincial level. In future it is purposed that a regular schedule of engagement<br />
between the <strong>Municipality</strong> and the sector departments will be agreed and adhered to.<br />
7.1.3 MUNICIPAL STRUCTURES<br />
Other than legislated and political structures, the following structures are also in place in the <strong>Zululand</strong> <strong>District</strong><br />
<strong>Municipality</strong>:<br />
7.1.3.1 PLANNING DEPARTMENT<br />
<br />
<br />
<br />
<br />
<strong>District</strong> Planners Forum<br />
IDP Representative Forum<br />
Pongola Poort dam Inter Municipal Forum<br />
<strong>Zululand</strong> / Umkhanyakude cross boundary bulk water supply Technical Committee<br />
7.1.3.2 SOCIAL SERVICES<br />
<br />
<br />
<br />
<br />
<br />
<br />
<br />
Human rights forum<br />
Sports forum<br />
Gender forum<br />
Youth Council<br />
Men’s forum (about to be launched)<br />
<strong>District</strong> Aids Council<br />
Local Aids Council<br />
7.1.3.3 LED SECTION<br />
Date: May 2013<br />
Page 181 of 194
ZULULAND IDP REVIEW 2013/2014<br />
<br />
<br />
<br />
Tourism forum<br />
Agricultural forum<br />
Business forum<br />
7.1.3.4 CORPORATE SERVICES<br />
<br />
<br />
<br />
<strong>District</strong> Disaster Management Advisory Forum<br />
<strong>District</strong> Disaster Management Practitioners Forum<br />
Skills Development Facilitators Forum<br />
7.1.3.5 FINANCE<br />
<br />
<strong>District</strong> CFO Forum: This forum comprises of all CFO’s in the district.<br />
7.1.3.6 OFFICE OF THE MAYOR AND MUNICIPAL MANAGER<br />
<br />
<br />
<br />
<strong>District</strong> Coordinating Forum<br />
Mayors Coordinating Forum<br />
Technical Committee<br />
7.1.4 AUDIT COMMITTEE<br />
7.1.4.1 AUDIT AND RISK MANAGEMENT COMMITTEE<br />
The <strong>Zululand</strong> <strong>District</strong> <strong>Municipality</strong> has an Audit and Risk Management Committee set up in accordance with the<br />
prescripts of the Municipal Finance Management Act No. 56 of 2003, section 166. The Committee comprises of two<br />
independent members, who are not in the employ of the <strong>Zululand</strong> <strong>District</strong> <strong>Municipality</strong>, nor are they political office<br />
bearers.<br />
The Chairperson of the Audit Committee is an independent person who is knowledgeable of the status of the position<br />
and has the requisite legal, business and leadership skills. The Committee operates in terms of written terms of<br />
reference approved by the municipality’s Accounting Officer and Council’s Executive Committee, which is in<br />
accordance with best practice.<br />
The Committee performs its responsibilities as required in terms of the Municipal Finance Management Act (MFMA),<br />
as well as the code of Corporate Governance. The Audit Committee meets a minimum of four (4) times during a<br />
financial year. The Following issues are deliberated upon:<br />
<br />
<br />
<br />
<br />
<br />
The adequacy, reliability and accuracy of financial reporting and information;<br />
The activities and effectiveness of internal audit function;<br />
The accounting and auditing concerns identified as a result of the internal or external audits;<br />
The effectiveness of the internal control systems;<br />
Risk Management;<br />
Date: May 2013<br />
Page 182 of 194
ZULULAND IDP REVIEW 2013/2014<br />
<br />
<br />
<br />
Compliance with the MFMA and other applicable legislation;<br />
Performance Management; and<br />
Reports on forensic investigations.<br />
7.1.4.2 INTERNAL AUDIT<br />
The <strong>Zululand</strong> <strong>District</strong> <strong>Municipality</strong> has a system of Internal Audit under the control and direction of its Audit and Risk<br />
Committee. Based on the results of assurance work carried out by the Internal Audit unit, areas of weakness are<br />
identified and addressed. The weaknesses in internal control systems are brought to the attention of management to<br />
take corrective measures.<br />
7.1.5 ANTI-CORRUPTION AND FRAUD PREVENTION<br />
The fraud prevention policy was approved in the 2010/2011 financial year. However, during the 2010/2011 financial<br />
year, they were incidents of fraud involving the stealing of municipal cheques, presently, there are two pending court<br />
cases in this regard as the syndicates were identified by our forensic team of investigators and the hawks arrested all<br />
the suspects. For the first batch of cheques that were stolen, the bank has refunded the full amount, for the second<br />
batch no refunds have been made though some of the funds were actually intercepted and frozen.<br />
The issuing of cheques has been identified as a key risk area and electronic funds transfer (EFT) is now used as a mode<br />
of payment.<br />
7.1.6 STATUS OF MUNICIPAL SECTTOR PLANS AND POLICIES<br />
The table overleaf provides a detailed breakdown of the status of Municipal Policies and Sector Plans:<br />
Date: May 2013<br />
Page 183 of 194
ZULULAND IDP REVIEW 2013/2014<br />
Table 86: Status of Sector Plans and Policies within the ZDM<br />
A<br />
B<br />
Focus Area<br />
Spatial and Environmental Planning<br />
Existing<br />
(Y/N)<br />
Date of last<br />
review<br />
Completion of<br />
next review Comments Directorate<br />
1 Spatial Development Framework Y Jun-09 Apr-13 na Planning<br />
2 Land Use Management Framework Y Jun-09 Apr-13 na Planning<br />
Not a DM Function; coordination<br />
3 Housing Sector Plan N - na<br />
Planning<br />
5 Current Public Transport Record Y Jun-10 Jun-14 na Planning<br />
Not a DM Function; coordination<br />
6 Energy Sector Plan N - -<br />
Planning<br />
7 Environmental Management Plan (SEA) Y Jun-09 Jun-14 na Planning<br />
8 Environmental Management Framework N - -<br />
Infrastructure Development &Municipal<br />
Services<br />
DEAT to consider funding in<br />
2013/14 Planning<br />
1 Water Services Development Plan Y Jun-11 Jun-12 na Planning<br />
2 Social Cohesion Strategy N Jun-09 Sep-12 na Planning<br />
3 Water Bylaws Y Jun-11 Jun-12 na Planning<br />
4 Disaster Management Plan Y Aug-05 Jun-12 na Planning<br />
5 Telecommunications Plan Y May-06 - To be determined Planning<br />
6 Water Services Bylaws Y May-10 - To be determined Planning<br />
7 Water Loss Strategy Y May-11 -<br />
8 Occupational Health and Safety Policy Y May-11 -<br />
9 Cemeteries Y Jun-05 -<br />
10 Community Facilities Y Jun-07 -<br />
Will be reviewed on a needs<br />
basis<br />
Will be reviewed on a needs<br />
basis<br />
Regional Cemeteries not found<br />
to be feasible<br />
Will be reviewed on a needs<br />
basis<br />
Planning<br />
Community Services<br />
Planning<br />
Planning<br />
Date: May 2013<br />
Page 184 of 194
ZULULAND IDP REVIEW 2013/2014<br />
Focus Area<br />
Existing<br />
(Y/N)<br />
Date of last<br />
review<br />
Completion of<br />
next review Comments Directorate<br />
C<br />
Economic Development<br />
D<br />
1 Regional/Local Economic Development Plan Y Jun-03 Jun-13 na<br />
Finance<br />
Local Economic<br />
Development<br />
E<br />
1 Fraud Prevention Strategy Y Jun-10 -<br />
Will be reviewed on a needs<br />
basis<br />
Finance<br />
2 Financial Management Plan Y Jun-11 Jun-12 na Finance<br />
3 Supply Chain Management Policy Y Jun-11 Jun-12 na Finance<br />
4 SDBIP Y Jun-11 Jun-12 na Finance<br />
5 Cash Management and Investment Strategy Y May-11 -<br />
6 Credit Control and Tarriff Policy Y May-11 -<br />
7 Insurance Policy Y May-11 -<br />
8 Travel, subsistence and entertainment policy Y May-11 -<br />
9 Revenue Enhance Strategy N - -<br />
Will be reviewed on a needs<br />
basis<br />
Will be reviewed on a needs<br />
basis<br />
Will be reviewed on a needs<br />
basis<br />
Will be reviewed on a needs<br />
basis<br />
COGTA approached to assist in<br />
March 2012<br />
Finance<br />
Finance<br />
Finance<br />
Finance<br />
Finance<br />
10 Funding and Reserves Policy N - - Lack of Funding Finance<br />
Human Resource Management<br />
1 Workplace Skills Plan Y Jun-12 Jun-13 na Corporate Services<br />
2 Employment Equity Plan Y Jun-12 Jun-13 na Corporate Services<br />
3 Policy and Procedure Manual Y Jun-08 -<br />
4 Human Resource Strategy Y Jun-10 -<br />
Will be reviewed on a needs<br />
basis<br />
Will be reviewed on a needs<br />
basis<br />
Corporate Services<br />
Corporate Services<br />
Date: May 2013<br />
Page 185 of 194
ZULULAND IDP REVIEW 2013/2014<br />
Focus Area<br />
Existing<br />
(Y/N)<br />
Date of last<br />
review<br />
5 Fleet Management Policy Y Jun-10 -<br />
Completion of<br />
next review Comments Directorate<br />
Will be reviewed on a needs<br />
basis<br />
Corporate Services<br />
F<br />
G<br />
H<br />
6 Records Policy Y -<br />
Social Development<br />
Will be reviewed on a needs<br />
basis<br />
Corporate Services<br />
1 Youth Strategy Y Jun-10 - na Community Services<br />
2 Gender Strategy Y Jun-10 - na Community Services<br />
3 HIV/AIDS Strategy Y Jun-11 Jun-12 na Community Services<br />
Good Governance<br />
1 Performance Management Framework Y Jun-09 Jun-12 na Planning<br />
2 Performance Agreements Y Jul-11 Jun-12 na Planning<br />
3 Municipal Scorecard Y Jul-11 Jul-12 na Planning<br />
4 Delegations Y Jul-11 Aug-12 na Corporate Services<br />
5 Indigent Policy N - Jun-13 Under review Finance<br />
Institutional Transformation<br />
1 Risk Management Policy Y May-11 -<br />
2 Use and Application of IT Technology Y May-10 -<br />
Will be reviewed on a needs<br />
basis<br />
Will be reviewed on a needs<br />
basis<br />
Finance<br />
Finance<br />
Will be reviewed on a needs<br />
3 Policy and Procedure Management Y May-08 - basis<br />
Corporate Services<br />
4 Asset Management Policy Y May-11 May-12 Finance<br />
All existing and reviewed Municipal Policies are being implemented.<br />
Date: May 2013<br />
Page 186 of 194
ZULULAND IDP REVIEW 2013/2014<br />
7.2 PUBLIC PARTICIPATION ANALYSIS<br />
Apart from the public participation processes pursued as part of the IDP preparation, communication with<br />
constituents is achieved in the municipal area by way of newsletters, radio and other media forms.<br />
More specifically, the following organization arrangements are in place for the IDP preparation process:<br />
<br />
<br />
<br />
<br />
IDP Steering Committee was resolved by the Council to act as a support to the ZDM Municipal Forums,<br />
the Municipal Manager and the IDP Manager.<br />
The ZDM Representative Forum is the participation forum that has to recommend the IDP for adoption to<br />
the <strong>Zululand</strong> <strong>District</strong> <strong>Municipality</strong> Council.<br />
IDP Planners Forum is a technical forum that supports the IDP Steering Committee and consists of<br />
planners and IDP experts from within the <strong>District</strong>. The coordination of alignment of interaction with sector<br />
Departments and Local Municipalities.<br />
The LED Forum is a technical forum consisting of three sub-forums namely agriculture, business and<br />
tourism. The LED forums reports and give input to the IDP Steering committee. These sub-forums are used<br />
as a platform for interaction with the private sector.<br />
It should also be noted that the IDP and its implementation for the ZDM will start focusing on international<br />
alignment with the district international neighbour, i.e. Swaziland. At the district alignment level, work<br />
sessions have been held with neighbouring district while an Inter-municipal Forum (IMUF) has been<br />
established as part of the Pongolapoort Dam Development Initiative.<br />
Some of the tools used for communicating the IDP include:<br />
<br />
<br />
<br />
Road shows during the IDP comment phase<br />
Advertisements in local and provincial newspapers as required<br />
Local Service Providers/Stakeholders Alignment meetings<br />
During the Review of the 2013/2014 ZDM IDP, the following key public engagements were held:<br />
IDP Representative Forum: 02 May 2013<br />
Growth and Development Summit: 14 March 2013<br />
Planning and Development Forum: 08 March 2013, 12 September 2013 and 24 October 2013<br />
7.3 GOOD GOVERNANCE & PUBLIC PARTICIPATION: SWOT ANALYSIS<br />
7.3.1 STRENGTHS/OPPORTUNITIES<br />
<br />
<br />
<br />
<br />
<br />
<br />
Intention to prepare and implement an Infrastructure and Services Provision Communication Strategy.<br />
Various forums have been established to ensure coordination of service delivery.<br />
To cater for the social development needs of youth, women, the disabled and the aged, a relevant<br />
Participation Strategy is being prepared.<br />
The Audit and Risk Management Committee to facilitate the development of a formal Risk Management<br />
Framework and Strategy.<br />
Comprehensive IT security policy in place to minimize the risk of errors, fraud and the loss of data<br />
confidentiality, integrity and availability.<br />
Numerous organizational arrangements are in place for the IDP preparation process.<br />
Date: May 2013<br />
Page 187 of 194
ZULULAND IDP REVIEW 2013/2014<br />
7.3.2 WEAKNESSES/THREATS<br />
<br />
<br />
The municipality is exposed to various risks of loss including theft of, damage to, and destruction of assets,<br />
errors and omissions, injuries to employees, employee health and natural disasters.<br />
Fraud and Corruption can surface at a number of levels in any organization.<br />
8. COMBINED SWOT ANALYSIS<br />
8.1 STRENGTHS/OPPORTUNITIES<br />
Well-functioning Portfolio, EXCO and Council structures.<br />
Communication Plan and IDP Alignment processes in place.<br />
MTAS in place.<br />
Implementation of the Electronic Records Management System (EDMS) since 2006 has made considerable<br />
progress in modernizing and improving ZDMs Records system.<br />
Sub-forums under the Local Economic Development Forum include Tourism and the recently established<br />
General Business and Agricultural forums.<br />
LED Directorate’s achievements created further opportunities for growth and development.<br />
Functional GIS section.<br />
Planning Shared Services in place.<br />
Compliance with financial requirements and submission deadlines.<br />
Intention to prepare and implement an Infrastructure and Services Provision Communication Strategy.<br />
Various forums have been established to ensure coordination of service delivery.<br />
To cater for the social development needs of youth, women, the disabled and the aged, a relevant<br />
Participation Strategy is being prepared.<br />
The Audit and Risk Management Committee to facilitate the development of a formal Risk Management<br />
Framework and Strategy.<br />
Comprehensive IT security policy in place to minimize the risk of errors, fraud and the loss of data<br />
confidentiality, integrity and availability.<br />
Numerous organizational arrangements are in place for the IDP preparation process.<br />
Education, Health and Community Service Sector Plan in place although it required a review.<br />
Concerted effort to involve widows, orphans and people living with disabilities in social and economic<br />
development programmes.<br />
It is evident that the district’s largest contributors to GVA are not necessarily the fastest growth sectors.<br />
A number of tourism developments are in the pipeline or being implemented, notably the Pongolapoort<br />
Dam Proposals as well as the Emakhosini Ophathe Development Proposals.<br />
The commercial sector is well established in the towns of the <strong>District</strong>.<br />
Opportunities generally promoted in the region in terms of agri-processing include traditional medicines,<br />
venison production for export, leather production as well as vegetable and fruit processing. The<br />
diversification of agricultural production in the <strong>District</strong> will lead to further potential for agri-processing.<br />
The diversification of the products of the district and the improvement of marketing systems that will<br />
open up new local, national and international markets.<br />
Opportunities relating to timber product manufacturing should continue to be investigated. Timber<br />
construction relating to specifically the tourism industry may present opportunities for local contractors in<br />
future.<br />
Opportunities exist for the development of clothing and textile as well as building materials sector in the<br />
<strong>District</strong>.<br />
Date: May 2013<br />
Page 188 of 194
ZULULAND IDP REVIEW 2013/2014<br />
<br />
<br />
<br />
<br />
<br />
<br />
<br />
<br />
<br />
<br />
<br />
Rural road maintenance and upgrading of rural roads which will continue to establish better linkages<br />
between settlements, rural nodes and municipal centres, thus increasing access to economic<br />
opportunities whilst increasing access to job opportunities.<br />
The proposed petrol filling station and information centre (Ulundi “19”) is viewed as a lead project<br />
impacting on both the transport and tourism sector in the <strong>District</strong>. This strategically located development<br />
will increase the attractiveness of this alternative route between Gauteng and the KwaZulu-Natal coast. It<br />
will also provide an opportunity for informing people passing through the area of the attractions which<br />
the area has to offer.<br />
Opportunities still exist for small scale mining relating to mine rehabilitation as well as equipment<br />
maintenance and support.<br />
The ZDM has an indigent policy in place.<br />
To measure consumption in unmetered zones, the municipality uses the water balance to determine<br />
consumption.<br />
The <strong>Zululand</strong> <strong>District</strong> Water Services Plan gives a clear indication as to where and when water<br />
infrastructure will be provided in the <strong>District</strong>. It provides a clear indication of what amount of water<br />
capital infrastructure will be provided when and at what cost and during which year. MIG business plans<br />
in excess of R1,5 billion have already been approved.<br />
The following forums are in place to attend and align disaster management responses:<br />
Disaster Management, Health and Safety Portfolio Committee<br />
Disaster Management Advisory Forum<br />
Provincial Disaster Management Advisory Forum<br />
The ZDM has finalized the preparation of its Disaster Management Plan and procurement processes are<br />
underway to ensure the implementation of the said plan.<br />
8.2 THREATS/WEAKNESSES<br />
<br />
<br />
<br />
<br />
<br />
<br />
<br />
<br />
<br />
<br />
<br />
<br />
<br />
<br />
<br />
<br />
<br />
<br />
Large disparities are apparent in terms of the nature and structure of the built environment with the most<br />
significant disparity between the level of services and development in the rural and urban areas of the<br />
<strong>District</strong>.<br />
Only 20 % have access to a formal waste disposal system, and these are in urban areas.<br />
According to the <strong>Zululand</strong> Cemeteries Master Plan, approximately 700 ha of land will be required in the<br />
<strong>Zululand</strong> <strong>District</strong> <strong>Municipality</strong> by the year 2020 to accommodate approximately 800 000 cumulative<br />
deaths at that time.<br />
Road infrastructure is under pressure particularly from heavy vehicles.<br />
The responsibility between Local and <strong>District</strong> municipalities as well as the Department of Transport (DOT)<br />
for road provision and maintenance still needs to be finalized and has been flagged as a key development<br />
issue.<br />
The electricity network in the southern portions of <strong>Zululand</strong> has very limited capacity.<br />
Support and buy-in from government departments and local municipal structures cannot be ensured.<br />
Limited functioning Council oversight committee.<br />
LLF (Local Labour Forum) does not meet regularly.<br />
The municipality is exposed to various risks of loss including theft of, damage to, and destruction of assets,<br />
errors and omissions, injuries to employees, employee health and natural disasters.<br />
Fraud and Corruption can surface at a number of levels in any organization.<br />
Backlog in the provision of primary and secondary education facilities.<br />
Significant backlog with the distribution of clinic facilities.<br />
Poor accessibility to community halls.<br />
The high prevalence of HIV in the district poses a severe challenge for future development as HIV/AIDS<br />
inhibits economic growth by reducing the availability of human capital.<br />
Alignment of housing projects with other social and infrastructure requirements remains a challenge.<br />
Backlog with the provision of police stations.<br />
<strong>Zululand</strong> is ranked lower for economic output for the province than it is for total population indicating that<br />
the GVA per capita within <strong>Zululand</strong> is comparatively low in the provincial context.<br />
Date: May 2013<br />
Page 189 of 194
ZULULAND IDP REVIEW 2013/2014<br />
<br />
<br />
<br />
<br />
<br />
<br />
<br />
<br />
<br />
<br />
<br />
<br />
<br />
<br />
<br />
<br />
Abaqulusi and Ulundi municipalities contribute the majority of economic output for the district, between<br />
them contributing almost 63% being indicative of an economy that is not diversified throughout the<br />
district.<br />
Nongoma, which has the second highest population of all the <strong>Zululand</strong> municipalities, only contributes<br />
13.6% to economic output.<br />
Only 31.1% of the working age population are engaged in actual employment or are actively seeking work.<br />
Unemployment in <strong>Zululand</strong> is unsustainably high and is having the negatively impact of discouraging<br />
people from spending the time and money to actively search for jobs.<br />
Employment has increased by just over 13,000 people between 2003 and 2009. This is insufficient in the<br />
light of population growth of over 106,000 in the same period.<br />
<strong>Zululand</strong> DM has very high dependency ratios. The dependency ratio can be interpreted as a crude<br />
measure of poverty.<br />
Uncertainty relating to the roll-out or implementation of the Land Reform programme has impacted<br />
negatively on agricultural development and growth.<br />
The commercial sector is not easily accessible for the majority of the rural population that currently<br />
account for 75% of the district population.<br />
Manufacturing activity within the <strong>District</strong> is low, at an estimated 11% contribution to the GGP for the area.<br />
Wetland degradation occurs mainly as a result of inappropriate formal and informal development.<br />
Instances of overflowing sewage as a result of failed or incorrectly installed, vandalised pump houses.<br />
Over utilization of soils results in reduced agricultural potential.<br />
Environmental degradation due to mines that have not been rehabilitated.<br />
Proliferation of alien invasive weeds.<br />
Soil erosion and damage due to over-burning.<br />
Excessive or illegal muthi harvesting damages natural indigenous species.<br />
9. KEY CHALLENGES<br />
For the purpose of this section it is noted that a key challenge is informed by:<br />
<br />
<br />
<br />
<br />
Action to build upon strengths of municipality<br />
To address a weaknesses<br />
To tap into opportunities<br />
To counter the threats or plan around them<br />
9.1 KEY CHALLENGES FACED BY LOCAL MUNICIPALITIES WITHIN ZDM<br />
9.1.1 ABAQULUSI LM<br />
<br />
<br />
Apartheid spatial planning footprints: The challenge of the IDP is two separate developments which were<br />
caused by historical planning or apartheid planning. This requires AbaQulusi to plan and provide timebalance<br />
for the provision of basic infrastructure services to rural areas and to maintain and upgrade<br />
existing services in urban areas with due regard to limited financial resources. This need to be part of a<br />
holistic approach to achieve social upliftment and a better quality of life for all the citizens of<br />
AbaQulusi. Specific projects need to integrate social, infrastructural and economic development.<br />
Declining economic sectors: The AbaQulusi area is facing the challenge of economic development after<br />
the close down of mining sector, which was a major boost for the regional economy. This challenge left<br />
many ghost town and hostels in the area, which also requires infrastructure development and<br />
maintenance today. As a result, the municipality is required to pull all various resources which, too date<br />
have not yet been fully developed. The IDP challenge is to draw on those resources and through<br />
Date: May 2013<br />
Page 190 of 194
ZULULAND IDP REVIEW 2013/2014<br />
creative and visionary means implement measures that will result in the economic regeneration<br />
and upliftment of the population. Hence, the AbaQulusi Local <strong>Municipality</strong> need to create an enabling<br />
environment that will stimulate investment interest.<br />
Lack of skills and high rate of functional illiteracy: In terms of the sectoral departments and<br />
municipal own competencies there is a need to address skills training, adult education and increased<br />
access to job opportunities. This in turn means implementing the necessary educational programmes as<br />
well as encouraging local economic activity. From a sectoral point of view the extension of the primary<br />
sector and the development of a secondary sector in conjunction with this need to be emphasised.<br />
Existing opportunities presented through the development of the <strong>Zululand</strong> Corridor should be embraced.<br />
Finally, the role of tourism and its growing contribution to the local economy should be explored and<br />
developed.<br />
<br />
<br />
<br />
<br />
<br />
Settlement pattern: Spatially the IDP must respond to the need for the development of hierarchy of<br />
settlements/ nodes, which will rationalise the regional distribution of investment in basic<br />
infrastructure and community services. The development of a Rural Service Centres may go a long way in<br />
achieving a more equitable development and investment pattern and spatial integration. There is a need<br />
to formalise the rural settlements surrounding the urban areas through the implementation of<br />
Framework Plans or precinct plans and for consistency in policies, land use management and by-laws.<br />
Poor access to social facilities: Urban areas within the AbaQulusi Local <strong>Municipality</strong> are reasonably well<br />
developed with social facilities and services. However, the standards do need to be maintained and such<br />
facilities need to be expanded to reach the urban population due to high rate of urbanization and<br />
migration. The real challenge lies in creating similar standards of provision of facilities in the rural<br />
areas in order to achieve social upliftment and a general improvement of socio-economic conditions.<br />
Addressing this need becomes even more critical, however the creation of regional sport centres may<br />
go a long way to achieve the desired outcome if one consider the dimensions that social facilities need<br />
to be accessible and should be provided at convenient locations.<br />
Service backlog: One of the main elements of socio-economic wellbeing is the access to basic services. The<br />
status of the physical and economic development level of a community such as that of AbaQulusi is often<br />
measured based on the provision and quality of infrastructure for technical services, i.e. access to roads,<br />
electricity, water and sanitation. These are found to be a huge challenge for AbaQulusi <strong>Municipality</strong><br />
whereas the Vryheid town suffers from maintaining of existing services while rural areas have no basic<br />
services at all. In addition, the AbaQulusi Local <strong>Municipality</strong> is challenged with the maintenance and<br />
development of basic road and storm water infrastructure to serve the local community, particularly in<br />
eMondlo and rural areas. This will be severely constrained by limited financial resources. Public<br />
transport plays an important role in the economy of AbaQulusi and deserves some attention in the<br />
planning efforts of the municipality.<br />
Land Claims: About 80% of the land within AbaQulusi <strong>Municipality</strong> belongs to White group. The national<br />
government has got a target of 30% of the land must be transferred to Black communities by 2014. This<br />
makes AbaQulusi area to be considered under huge land claims by the Department of Land Affairs (DLA).<br />
This poses huge challenges to AbaQulusi <strong>Municipality</strong> due to lack of internal capacity, skills and adequate<br />
financial resources to deal with new infrastructure in the areas under land redistribution by Department<br />
of Land Affairs.<br />
HIV and AIDS: The number of individuals infected with HIV/AIDS continues to be major challenge for all<br />
spheres of government, and an attempt to stabilize the pandemic, is reflected in terms of budget<br />
allocations and programmes for implementation by the Department of health. The survey done at <strong>District</strong><br />
level by the DOH in 2005 for pregnant women reflected 37.8% of infected persons in the <strong>Zululand</strong> <strong>District</strong><br />
Date: May 2013<br />
Page 191 of 194
ZULULAND IDP REVIEW 2013/2014<br />
<strong>Municipality</strong>. The figures are very sensitive considering that AbaQulusi has a highest population in the<br />
whole district. The AbaQulusi municipality has participated in the development of a <strong>District</strong> HIV/AIDS<br />
Sector plan, and has developed HIV/AIDS Strategies through the establishment of an HIV/AIDS Council<br />
chaired by the <strong>District</strong> Mayor.<br />
9.1.2 eDumbe LM<br />
<br />
<br />
<br />
<br />
<br />
<br />
<br />
A large rural population that depends on the nearby urban area of Paulpietersburg for commercial and<br />
public services (e.g. health, social welfare, police services etc) places pressure on the primary node<br />
because of the lack of social and economic services within the rural areas.<br />
Most of the rural settlements are small thus making service delivery costly, this effect is compounded by<br />
the aspect that only 35% of the municipality’s population lives in an urban area while 65% lives in the<br />
rural hinterland of the municipality. The spatial development pattern of the municipality will have to be<br />
addressed.<br />
53% of the population of the municipality are women. Women are assumed to be acting as household<br />
heads in the absence of partners seeking employment in other urban centres. It is also accepted that<br />
these women are more disadvantaged in terms of resources. Strategies need to be developed in order to<br />
create security for women and their dependent children.<br />
Close to half of the population are children, placing pressure on the need for educational and social<br />
facilities. Many of these children will be orphaned as a result of HIV/AIDS. At least 17% of the population<br />
is already infected with HIV. The severe impact on the need for health, social and welfare services over<br />
the next 20 years will have to be accommodated in the Municipalities strategy for service delivery.<br />
Income levels in èDumbe tend to be quite low with 69% of the population earning less than R800 a<br />
month. The traditional and rural areas are the most poverty stricken.<br />
The majority of the population relies on public transport facilities. This is primarily taxi based. The quality<br />
and efficiency of the public transport sector still needs attention.<br />
Although a large portion of the population has access to household electricity the low income levels in<br />
the municipality puts a severe restriction on the number of people actually using electricity as a primary<br />
means of energy. Electricity provision at schools and health facilities are especially critical. In the wake of<br />
the looming energy crises faced by this country it is vital that the <strong>Municipality</strong> adopts policy embracing<br />
the use of alternative energy sources for new residential and commercial development.<br />
9.1.3 Uphongola LM<br />
<br />
<br />
<br />
<br />
A large rural population that depends on the nearby urban areas such as the Pongola town for<br />
Commercial and public services (e.g. health, home affairs, etc) places pressure on the primary node<br />
because of the lack of services and facilities within the rural areas. Service delivery in the rural areas will<br />
need to be attended to.<br />
The uPhongolo population is characterised by significantly more women than men. 47% households are<br />
headed by women in the absence of partners seeking employment in other urban centres. It is accepted<br />
that these women are more disadvantaged in terms of resources. Strategies need to be developed in<br />
order to create security for women and their dependent children.<br />
Close to half of the population are children, placing pressure on the need for educational and social<br />
facilities. Many of these children will be orphaned as a result of HIV/AIDS. At least 11.7% of the<br />
population is already infected with HIV. The severe impact on the need for health, social and welfare<br />
services over the next 20 years will have to be accommodated in the Municipalities strategy for service<br />
delivery.<br />
Income levels are low with 66% of households receiving no income or less than R2 400 per month. The<br />
traditional and rural areas are the most poverty stricken.<br />
Date: May 2013<br />
Page 192 of 194
ZULULAND IDP REVIEW 2013/2014<br />
<br />
<br />
<br />
<br />
<br />
Unemployment levels are relatively high and with only 13.43% of the population being formally<br />
employed. Dependency levels are also high with every employed person having to support 6.5 persons of<br />
which 3 are over 15 years of age. The farming sector employs a significant number of people, indicating<br />
the importance of the agricultural sector in the economy of the area. The local economic development<br />
strategy needs to build on this strength.<br />
The majority of the population relies on public transport facilities. This is primarily taxi based. The quality<br />
and efficiency of the public transport sector needs attention.<br />
Most of the urban communities have access to clean water with severe shortcomings in this respect as<br />
far as rural communities are concerned and have access to less than 5 liters of water per day. People rely<br />
on natural resources for water and are considered to live at survival levels.<br />
The larger urban areas have sanitation systems, but the rural areas rely on septic tanks, pit latrines or no<br />
system at all. This places tremendous strain on the environment.<br />
The population in the urban areas has access to household electricity, but few or the rural settlements<br />
have this service. Electricity provision at schools and health facilities are especially critical. In the wake of<br />
the looming energy crises faced by this country it is vital that the <strong>Municipality</strong> adopts policy embracing<br />
the use of alternative energy sources for new residential and commercial development.<br />
9.1.4 Key Challenges faced by ZDM<br />
<br />
<br />
<br />
<br />
<br />
<br />
<br />
<br />
<br />
<br />
<br />
<br />
<br />
<br />
<br />
<br />
<br />
<br />
<br />
<br />
<br />
<br />
<br />
<br />
Maintain functionality of Council structures<br />
Ensure MTAS is complied with<br />
Maintenance of EDMS system thereby ensuring accurate record keeping.<br />
Ongoing support to the LED sub-forums to continue functioning.<br />
Maintenance and continual improvement of GIS system.<br />
Ensure continued compliance with legal financial requirements.<br />
Improve vertical and horizontal alignment thereby ensuring coordinated service delivery by all spheres of<br />
government.<br />
Prioritization of needs of marginalized groups.<br />
Formulation and compliance with Risk Management Framework and Strategy.<br />
Maintain functionality of IDP organizational arrangements internally and externally.<br />
To further diversify the district’s economy.<br />
Ongoing support of tourism initiatives.<br />
Harness agri-processing opportunities in the district, notably venison production, leather processing and<br />
traditional medicines.<br />
Foster timber product ion opportunities.<br />
Improve rural road network to ensure improve linkages between settlements, rural nodes and municipal<br />
centres.<br />
Harness opportunities relating to small scale mining.<br />
Ensure indigent policy remains updated and relevant.<br />
Ensuring ongoing monitoring of water balance in rural areas.<br />
Commit and implement approved MIG business plans for roll-out of water and sanitation services in the<br />
district.<br />
Ensure disaster management forums remain functional.<br />
Redress disparities between levels of services and development in the urban and rural areas.<br />
Improve access to formal waste disposal system.<br />
Provision of adequate land to cater for anticipated required burial space.<br />
Ongoing efforts to clarity the responsibilities between Local and <strong>District</strong> <strong>Municipality</strong> as well as the<br />
Department of Transport in respect of road maintenance and construction.<br />
Date: May 2013<br />
Page 193 of 194
ZULULAND IDP REVIEW 2013/2014<br />
<br />
<br />
<br />
<br />
<br />
Improve the limited capacity of the electricity network in the southern portions of the <strong>District</strong>.<br />
Improve functionality of Council oversight committee in particular.<br />
LLF (Local Labour Forum) to meet more regularly.<br />
Risk reduction strategies and actions to be defined and implemented.<br />
Seek clarification in respect of the land reform programme roll-out/implementation.<br />
Date: May 2013<br />
Page 194 of 194